Transcription
Tenth USA/Europe Air Traffic Management Research and Development Seminar (ATM2015)Arrival Scheduling with Shortcut Path Options andMixed Aircraft PerformanceShannon J. Zelinski and Jaewoo JungNASA Ames Research CenterMoffett Field CA, USAShannon.J.Zelinski@nasa.gov, Jaewoo.Jung@nasa.govAbstract— Previous work introduced the concept of using tacticalshortcut options to improve schedule conformance in terminalairspace. When a scheduling point is congested, aircraft arescheduled to longer nominal paths, holding shortcut path optionsin reserve for tactical use if an aircraft is late, thereby improvingthe schedule conformance, reducing the required schedulingbuffer, and increasing throughput. When the scheduling point isless congested, aircraft may be scheduled to the shorter path withoriginal larger scheduling buffers. Previous work focused on asingle generic merge point serving aircraft with uniform arrivalprecision. This paper extends the previous concept to enhance theperformance of time-based arrival management and considermixed aircraft performance. Aircraft equipped to achieve a highdegree of schedule conformance may be scheduled to the shorterpath under the same conditions that a less equipped aircraftwould be scheduled to the longer path, giving the equippedaircraft an advantage that can be seamlessly integrated into thescheduler. The arrival scheduler with shortcut path options formixed aircraft performance is applied to a model of first-comefirst-served terminal metering at Los Angeles InternationalAirport. Whereas clear system benefits were found for tacticalshortcut routing and higher percentages of equipped aircraft,very little advantage could be seen for equipped over unequippedaircraft that could be used to incentivize early equipage.Keywords-scheduling and spacing; arrival management; mixedequipage operationsI.INTRODUCTIONWith today’s congested airports, a considerable amount ofresearch has focused on increasing airport throughput. Thethroughput of a single arrival runway is ultimately constrainedby how tightly flights can be spaced as they complete the finalapproach. Whereas wake separation requirements dictate aminimum allowable spacing for safety, the achieved spacing isnominally a half to one mile greater to account for imprecisionassociated with aircraft merging and wind uncertainties [1].The current practice of vectoring to properly space mergingflows is highly flexible, but demands a high degree ofcontroller attention, and produces relatively varied spacingresults.Time-based arrival management concepts such as the 4DCooperative ARrival MAnager (4D-CARMA) from GermanAerospace Center (DLR) [2-4] and FAA’s Trajectory BasedFlow Management (TBFM) [5-7] make use of improvedestimated-time-of-arrival (ETA) afforded by fixed routing,such as Area Navigation (RNAV) and Required NavigationPerformance (RNP), and wind forecasts to develop precisearrival schedules. The question of spacing precision thenbecomes one of schedule conformance. The more preciselyflights can be controlled to meet their scheduled times ofarrival, the tighter flights may be scheduled. To this end, thesetime-based arrival managers employ controller decisionsupport tools to help meet a schedule. Higher scheduleconformance can be achieved by controlling aircraft to theirscheduled time of arrival with speed control rather thanvectoring [8]. The increased schedule conformance allowsreduced scheduling buffers and increased throughput.However, speed control alone offers a limited range offlexibility to respond to disturbances. For example, maximumspeed restrictions make time recovery for late arrivals difficultin terminal airspace. A more feasible path-based method oftime recovery could increase schedule conformance, allowingthe precision schedulers to reduce their buffers and increasethroughput even further. Whereas path-based control in theterminal area is not a new concept, when coupled withscheduling, flights are usually scheduled to the shortest paths,reserving longer paths for exception handling [7,9]. However,an investigation offering standard path stretch and shortcut pathoptions to controllers to recover from highly disruptive offnominal events, found that the shortcuts were among the mostoften used [10].Previous research explored tactical use of shortcut pathoptions to allow time recovery for late arrivals with promisingresults [11]. However, the study focused on a single genericscheduling point and assumed all aircraft had similar arrivalprecision at the scheduling point. This paper extends previousresearch by applying the concept of tactical shortcut pathoptions to enhance TBFM arrival schedule conformance andthereby gain system throughput and delay benefits withoutincreasing controller workload. Tactical shortcuts areintegrated into a model of TBFM multi-point arrival schedulingat Los Angeles International Airport. TBFM development hasplaced considerable effort on integrating high precisionprocedures for equipped aircraft [17] to not only reapadditional system benefits, but to incentivize equipage. Mixedaircraft scheduling conformance performance is considered inthis study to explore what if any advantage tactical shortcutscan give to high arrival time precision aircraft. The next section
summarizes the tactical shortcuts concept explored in previousresearch and the main findings.II.BACKGROUNDA flight’s schedule consists of scheduled times of arrival(STAs) at coordination points (e.g. meter fixes, merge points,runway thresholds) along a fixed nominal route. The STAs ofsequential flights at a given coordination point are spaced toachieve at minimum the required separation between theflights plus an additional scheduling buffer to account forflight arrival time uncertainty. A suitable scheduling buffercan be calculated for a given arrival uncertainty and desiredmaximum likelihood of a separation violation requiringcontroller intervention.The tactical shortcuts concept assumes that at some pointprior to the coordination point, late flights have theopportunity to take a shortcut path option and recover time.Previous research found that shortcuts designed to recover 1.5 times the standard deviation of the flight arrival timeuncertainty, could allow flights to be scheduled with smallerbuffers without increasing the likelihood of separationviolation [11]. This equated to 11% increase in throughputduring high traffic demand periods. During low traffic periods,more benefit was found in scheduling flights directly to theshortcut path with the original larger buffers if there wassufficient slack in the schedule. Essentially, the schedulestrategically assigned a nominal or a shortcut path-based onhow well the schedule could accommodate the respectivebuffer size requirements.Because required buffer size also depends on aircraftschedule conformance precision, a similar method may beused to account for mixed aircraft performance. Aircraftequipped to meet a schedule with a higher degree of precisionrequire less buffer and so may be scheduled directly to theshortcut path under the same conditions that would schedule aless equipped aircraft requiring larger buffers to the longernominal route.One objective of this paper is to apply the tactical shortcutsconcept to multi-point scheduling modeled after a realterminal airspace. For this purpose, shortcut path options weredesigned for arrival routing into Los Angeles InternationalAirport (LAX). The resulting routing provides shortcutopportunities at up to two separate merge points along a singleroute from meter fix to runway.Another objective of this paper is to explore what if anyadvantage this method of nominal vs. shortcut path schedulingcan give to high arrival time precision aircraft that mayincentivize advanced equipage.III.METHODA. Scheduler ModelThe arrival scheduler was modeled after TBFM’s terminalmetering functionality. This is a multi-point first-come-firstserved constraint-modified scheduler [5]. Flights are assignedan arrival runway and STAs at multiple coordination pointsalong a fixed route (e.g. the arrival meter fix, runwaythreshold, and any merge points in between). Flights arescheduled on a first-come-first-served basis according to theirearliest runway ETA with a planning horizon of 40 minutes( 200 nm) from the runway. The scheduler considersconstraints based on minimum required separation atcoordination points, and feasible time-to-fly (TTF) rangesbetween coordination points.The TBFM model in this work uses given TTF rangesbetween coordination points and time blocks at each point togenerate feasible STA time windows at each point [12]. TheTTF ranges fed to the model are based on predefined nominaland slow speed profiles for the given engine type along thegiven route. Time blocks are time conversions (based onnominal speed) of the distance-based separation requirementsof previously scheduled flights plus a scheduling buffer. Inprevious research on tactical reconfiguration [13], the requiredseparation distances used by the TBFM scheduling modelwere 5nm at all coordination points more than 40 nm from theairport, and 3nm at all points within 40 nm of the airport.Some differences are applied to that model for this work. First,more realistic TTFs are calculated based on step-down speedprofiles and nominal and slow speed restrictions from routeadaptation used in TBFM [14]. Second, in-trail wake vortexseparation standards are enforced. Third, in this work, thescheduling buffer used to define the blocked times ofpreviously scheduled flights are not time conversions of aconstant distance buffer. The time-based buffers are dependenton flights’ expected arrival time performance at thecoordination point, and the availability of tactical shortcuts forthe coordination point. Parametric analyses from the previoustactical shortcuts work [11] were used to generate buffer sizefunctions of expected arrival time uncertainty standarddeviation and scheduled path (nominal or shortcut) for eachcoordination point. The use of speed control within theshortcuts allows the minimum buffer (designed for optimaltime recovery) to be used for a desired threshold percentage offlights estimated to require tactical controller intervention toavoid loss of separation. For a threshold of 10% controllerintervention, the required scheduling buffers are 1.1σ and 1.8σwhen a shortcut is and is not available, respectively, where σrepresents the estimated delivery precision based on aircraftequipage [11]. A normal distribution with zero mean isassumed.The scheduler considered two control modes within theTRACON. All flights were assumed to be RNAV equippedwith a subset also equipped with flight-deck scheduleconformance precision capability. Flight-deck Required Timeof Arrival (RTA) delivery precision is estimated to be 4 sec[15]. Flight-deck interval Management (FIM) deliveryprecision is estimated to be 4.7 or 2.2 seconds if fast speedprofiles are used [16]. For the purposes of this research, theRTA or FIM capable aircraft delivery precision is assumed tobe σRTA 4.5 sec. All flights without flight-deck scheduleconformance precision capability were controlled from theground with the aid of ground-based automation tools.Controller Managed Spacing (CMS) ground-based automationtools have been shown to have a delivery precision of 5.2seconds [8]. However, a recent evaluation suggests that CMS
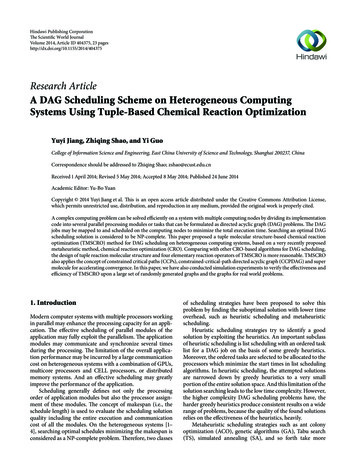
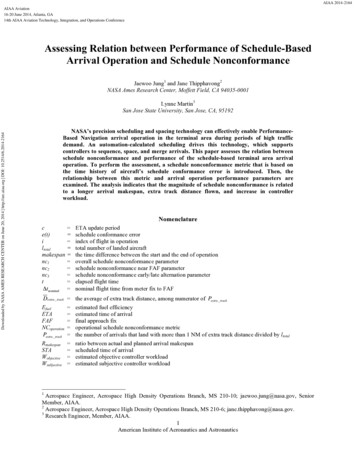
delivery accuracy may be as low as 8-10 seconds1 [17]. Forthe purposes of this research, the ground controlled aircraftdelivery precision is assumed to be σCMS 9 sec. Thus flightdeck control was assumed to have twice the precision (half thestandard deviation) as ground-based control. Table 1 showsthe scheduling buffers used in this study based on aircraftequipage and tactical shortcut availability.B. Traffic ScenariosThe tactical shortcuts concept was applied to LAX arrivalscheduling due to the availability of LAX adaptation used inrecent human-in-the-loop simulations of TBFM terminalmetering [17]. Figure 1 shows the standard arrival routes fromthis LAX adaptation. Routes extend from meter fix to runway.The Northwest flows feed only runway 24R, the South flowsfeed only runway 25L, and the East flows feed both runways.Table 1. Scheduling Buffer SizeTactical Shortcut AvailabilityAvailableNot AvailableDelivery RTA1.1σRTA 4.9 sec1.8σRTA 8.1 secPrecision CMS1.1σCMS 9.9 sec 1.8σCMS 16.2 secTraffic scenarios were generated in 15-minute incrementsto meet a desired aircraft per quarter hour set of meter-fixETAs. Each flight was then randomly assigned a weight class,engine type, and arrival meter fix according to weighteddistributions observed from July 2014 historical traffic. Figure1 shows the baseline LAX arrival routing used along withobserved traffic distributions to each meter fix. Observedarrival traffic was comprised of 94% jets and 6% turboprops.Pistons were not considered, as they comprised less than 0.1%of the traffic. Of the three Northwest meter fixes, only jets usedThe analysis will compare metrics for ratios of mixedaircraft performance between RTA and CMS control modesranging from 0 to 1 in 0.1 increments.Figure 1. Distribution of observed JET and TURBO traffic across standard arrival routes adapted to LAX.1Estimated 84th percentile (nominal distribution σ) scheduleconformance at terminal schedule points.
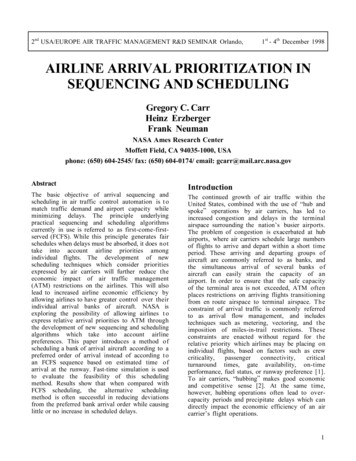
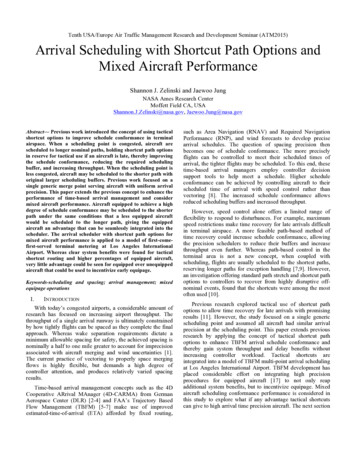
FIM and only turboprops used JEFFY, whereas VTU wasshared between jets and turboprops. Of the two South meterfixes, only a small percentage of jets used SXC, whereasSHIVE was shared between jets and turboprops. Of the twoEast meter fixes, only jets used GRAMM, whereas KONZLwas shared between jets and turboprops. Dashed lines in Fig. 1depict segregated routes used by turboprops only until theymerge with jets downstream. Although turboprops share theVTU, SHIVE, and KONZL meter fixes with jets, the routes arealtitude separated until they reach merge points SADEE, SLI,and PALAC or GAATE respectively. Jet weight classes werecomprised of 1% super, 15% heavy, 9% B757, 74% large, and1% small. Turboprop weight classes were comprised of 13%large and 87% small.The above distributions were used to randomly generate1000 2-hour traffic scenarios for an 18 aircraft per quarter hourarrival rate. Previous HITL studies of mixed equipage precisionscheduling at LAX observed an average throughput of 71aircraft per hour with standard deviation less than 3 [17]. Thisequates to 18 aircraft per quarter hour for the purposes ofgenerating traffic scenarios in 15-minute increments asdescribed above. Each of the 1000 2-hour traffic scenariosincluded 8 quarter hours of 18 aircraft each totaling to 144aircraft per scenario.C. Route ScenariosShortcut path options were designed for jet-dominatedroutes where the geometry allowed. The shortcut path optionsare shown in orange in Fig. 2 along with the percent reductionin path distance each shortcut provides in the upper rightcorner. The orange diamonds mark the decision waypoints,before which the decision to use the associated shortcut mustbe made. The orange dots are new merge points introduced byshortcuts. Red dots are merge points from the nominal routestructure that are bypassed when a shortcut is used. Thesemerge points may be scheduled with reduced buffers due totactical shortcut availability when nominal routing is assignedby the scheduler.Of the six shortcuts shown in Fig. 2, two are final sectorshortcuts (JAVSI to SAPPI2 and SLI to HUNDA), and the restare feeder sector shortcuts. In this study, all of the shortcutscould be used tactically, but only the final shortcuts wereFigure 2. Shortcut routing and segment distance saved relative to standard arrival routes.
allowed to be used strategically by the scheduler. Theexistence of downstream merge points from the feedershortcuts would inhibit their ability to offer earlier runwaySTAs by reducing buffers upstream. Therefore, it would seemadvantageous to always schedule to the feeder shortcut routes,as they would provide the same or earlier STAs as the nominalroutes. However, given the relatively large error at whichflights were delivered to meter fixes, it was expected that thebenefit of reserving these feeder shortcuts to tactically aidschedule conformance would be greater. This is why in thisstudy feeder shortcuts were not allowed to be usedstrategically by the scheduler, only used tactically insimulation.Simulation results will be compared between the baselinerouting shown in Fig. 1 and the shortcut routing shown in Fig2.D. SimulationTraffic scenarios characterized flights with unique meterfix ETA, meter fix, engine type, weight class, and equipage. Ifa flight had multiple procedure options available (due to finalshortcut and runway options), the preferred procedure wasassumed to be the one that resulted in the earliest runwayETA. Flights were ordered by this earliest runway ETA forfirst-come-first-served scheduling. Each flight was scheduledby trial scheduling each of its procedure options using thebuffers in Table 1 according to equipage and shortcutavailability, and the procedure producing the earliest runwaySTA was assigned to the flight and its schedule was frozen.After all flights were scheduled in this way, the simulationprocessed actual times of arrival (ATAs) at all coordinationpoints in order of the STAs. Flights were not allowed tochange sequence. A Gaussian error was added to the closestreachable time to the STA to get a preliminary ATA. Formerge points and runways, the Gaussian error was based onthe same arrival precision assumed by the scheduler, σCMS 4.5sec for equipped and σRTA 9 sec for unequipped aircraft.Delivery precision to the meter fix was assumed to follow aGaussian error of σMF 60 sec without the benefit of precisionscheduling and spacing tools in Center airspace. All Gaussianerrors were clipped to /-3σ to avoid extreme outliers.The reachable time assumes speed control authority canonly modify the scheduled time-to-fly (TTF) within a certainrange. The control authority assumed in the controller speedadvisory tool research was /-15% [18]. However results froma recent HITL experiment suggests that the purely speed-basedcontrol authority is less than half this [17]. For this work speedcontrol authority may increase scheduled TTF by 10% (byflying slower earlier) or decrease scheduled TTF by 5% (byflying faster longer). Note that this model is not centered atzero like the speed advisory tool, but gives more flexibility toincrease TTF (slow down) than to decrease TTF (speed up) tobe more realistic. These limits on TTF range make it possiblefor errors to cascade to the adjacent coordination point. If theerror at a coordination point is late enough such thatdecreasing the flight TTF by 5% is unable to catch up to theoriginal STA at the next point, the upstream ATA (TTF-5%)serves as the closest reachable time to which the next Gaussianerror is added.Each sequential point had an independent error applied toit. To ensure reasonable errors were applied, error was clippedto be within the range of a 10 kn head or tail wind errorbetween sequential points. For example, consider the 2-misegment between LUVYN and MINZA. Assume the finaladjusted scheduled TTF for a flight between these points is 30sec, making the average speed 240 kn. Assuming at most a 10kn wind error, the 230 kn to 250 kn average speed translates toa 28.8 sec to 31.3 sec range of reasonable actual TTF. Assumethe random sampled Gaussian error is 5 sec suggesting that theactual TTF for this segment be 35 sec. This is outside thereasonable error range for such a short distance, so the actualTTF is clipped to 31.3 sec to calculate the preliminary ATA atMINZA. For this segment distance, equipage is unlikely tomake much of a difference in precision. However, it wouldmake a difference in the next segment from MINZA toPALAC where the 13.6 mi segment distance at the sameaverage 240 kn speed results in a reasonable actual TTF rangeof 195.4 sec to 212.4 sec and an error range of -8.8 se to 8.1sec.The preliminary ATA was then compared to the precedingATA at the coordination point. If the time spacing is less thanthe required separation, the preliminary ATA was adjustedback to meet the required separation. Spacing relatedadjustments that make the actual TTF greater than thescheduled TTF 10% are assumed to require vectoring.For shortcut options simulations, schedules must be createdfor the additional merge points (orange dots) and decisionpoints (orange diamonds) seen in Fig. 2. The decision pointsthat are also meter fixes or merge points use ATA-STA errorat the decision point to determine shortcut use. The remainingdecision points are scheduled without buffers purely toestimate errors (ETA-STA) at the downstream merge pointthat the shortcut bypasses. The ATA-STA error at a decisionpoint was assumed to be the same as the ETA-STA at itsdownstream merge point. All flights that were late(ATA STA) at the decision point used the shortcut. Shortcutuse shortened the scheduled TTF of a route segment by thepercentages shown in Fig. 2. The adjusted scheduled TTF wasthen used to calculate the next downstream ATA as describedabove.Simulations were repeated 100 times for each trafficscenario with unique random errors applied in eachsimulation.IV.METRICSThe following metrics were computed for comparativeanalysis between mixed aircraft performance ratios (rangingfrom 0 to 1 in 0.1 increments) and routing models (baseline vs.shortcut).A. ThroughputDemand throughput, scheduled throughput, and actualthroughput were hourly rates of ETA, STA, and ATA,respectively. Hourly throughputs were calculated as thenumbers of ETAs, STAs, and ATAs at either runway between
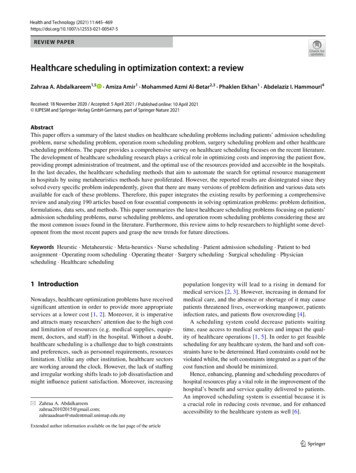
B. Scheduled DelayScheduled delays were segregated between delay absorbedin the TRACON and delay passed back to the Center.TRACON delays were further segregated between delayabsorbed by path and by speed. Center delay is the differencebetween meter fix STA and ETA. TRACON path delay is thedifference between the scheduled route runway ETA and thepreferred route runway ETA. TRACON speed delay is thedifference between runway STA and scheduled route ETAminus Center delay. Total delay is the sum of Center,TRACON path, and TRACON speed delay, which is also thedifference between runway STA and preferred runway ETA.Delays were first averaged across all 144 flights in a singlescenario and averaged again across the 1000 traffic scenarios.C. WorkloadThe highest priority controller task is maintainingseparation. The percentage of instances when the preliminaryATA must be modified was used to represent speed controlworkload. Similarly, vectoring workload was measuredseparately as the percentage of instances a flight’s actual TTFon any route segment is greater than the speed controlauthority range of scheduled TTF 10%. This may happenwhen an ATA is pushed back significantly.D. Shortcut UsageShortcut usage was evaluated for the shortcut routing caseonly as the baseline routing case did not have any shortcuts.Both scheduled and tactical shortcut usage was measured. Forall flights with the option of scheduling to a particularshortcut, scheduled shortcut usage is the percentage of flightsassigned to the shortcut route by the scheduler. Thesepercentages were calculated across all 1000 traffic scenarios.Only the final shortcuts (JAVSI to SAPPI2 and SLI toHUNDA) were available as schedulable shortcut routeoptions. VTU and FIM flights were used to evaluate JAVSI toSAPPI2 scheduled shortcut usage. SXC and SHIVE flightswere used to evaluate SLI to HUNDA scheduled shortcutusage.Tactical shortcut usage was evaluated for all shortcuts (twofinal and four feeder). For all flights scheduled to the nominalpath and able to use a particular shortcut tactically, tacticalshortcut usage is the percent of flights that used the shortcut insimulation. These percentages were calculated across all 100simulations per scenario across all 1000 traffic scenarios.E. Schedule ConformanceSchedule conformance is the difference between ATA andSTA at each coordination point. Standard error (standarddeviation from zero) and mean error were calculated at eachcoordination point across all 100 simulations per scenarioacross all 1000 traffic scenarios. Standard deviation from themean was originally considered as a schedule conformancemetric. However, the typical shape of the error histogramswas asymmetric with peaking close to zero, short tails on theleft (early) and long tails on the right (late). Therefore,standard error was chosen rather than standard deviation torepresent the error spread.V.RESULTSThis section presents the comparative analysis of themetrics between baseline and shortcut routing and betweenCMS and RTA equipage.A. ThroughputShortcut routing achieved higher scheduled and actualthroughput at lower equipage ratios, but this benefit decreasedas the RTA ratio increased.Figure 3 shows average demand, scheduled, and actualthroughput for baseline and shortcut routing cases as the ratioof RTA equipped aircraft increases from 0 to 1.Demand73#flights per hour60 and 120 minutes into each simulation. This time rangerepresents the most consistent runway loading of each 2-hourtraffic scenario. The demand and scheduled throughputs wereaveraged across the 1000 traffic scenarios generated. Actualthroughputs were averaged across 100 simulations for eachtraffic scenario before averaging again across the 1000 heduledActual72#71#70#69#68#0# 0.1# 0.2# 0.3# 0.4# 0.5# 0.6# 0.7# 0.8# 0.9# 1#RTA Equipage RatioFigure 3. Demand, scheduled, and actual throughputThe black demand throughput line is consistently 72aircraft per hour. This shows how the traffic scenarios of 18aircraft per quarter hour at the meter fixes projected the samedemand rate to the runways. The dashed and solid coloredlines represent baseline and shortcut routing casesrespectively. The blue and green lines represent scheduled andactual throughput respectively. Scheduled and actualthroughput for both routing cases increases as the ratio ofequipped aircraft increases. The actual throughput isconsistently 1 aircraft per hour lower than the scheduledthroughput for both routing cases. Both schedule and actualthroughput for shortcut routing are 1.5 flight per hour greaterthan baseline routing at low RTA ratios. However, this benefitdiminished as the RTA ratio increases until no shortcut routingbenefit is seen at when all aircraft are RTA equipped. This isbecause as the average required slot size of aircraft decreases,there are more natural gaps in the schedule and shortcuts makeless of an impact.
average total delay (seconds)330 300 BaselineCMSRTAShortcutCMSRTA270 240 210 180 150 120 0 0.1 0.2 0.3 0.4 0.5 0.6 0.7 0.8 0.9 1 RTA Equipage RatioFigure 4. Average total CMS and RTA delayaverage delay utCenterSpeedPath120"90"Figure 5 segregates delay by Center, TRACON speed, andTRACON path delay. Center delay is the most responsive toequipage ratio. This is because, even at high equipage ratios,the demand is so high that the TRACON’s ability to absorbdelay is saturated, pushing all residual delay to the Center. Thebaseline case path delay is fixed, as scheduling to shortcuts isnot an option. The path delay for the shortcut routing case isalmost as high as the baseline case suggesting that very fewflights were scheduled to shortcuts.C. WorkloadIn general, both routing cases had much higher ( 3 times)percentages of controller intervention required to prevent lossof separation than the 20% designed for in the isolated mergepoint case studied from previous research. This was due tolarge errors introduced at the meter fixes that cascaded tosubsequent flights without any relief in demand to recover.Increasing the spacing buffers is one way to add some reliefby pushing more schedule delay to the Center. Anotherapproach that should be explored in future work is to use amore realistic wind error model. Whereas it is realistic toexpect sequential flights to the same point to have verydifferent errors, it is less realistic to expect the errors of thesame flight at adjacent points along a route to have verydifferent errors due to wind.Figure 6 compares speed control workload betweenshortcut and baseline routing for varying equipage ratio. Theworkload percentages reduce very slightly ( 1%) as the RTAequipage ratio increases and the average required slot sizebecomes smaller. The difference between shortcut andbaseline routing is far more pronounced. The shortcut routingworkload percentages are 8-10% lower than those of thebaseline routing.64% 63% percent ATA modifiedB. Scheduled DelayA much larger difference in delay was seen betweenbaseline and shortcut routing than between RTA and CMSaircraft. Most of the additional scheduled delay for baselinerouting was applied to the Center.Figure 4 shows the average total delay segregated by CMSand RTA equipage for each case and equipage ratio. Thedashed and solid colored lines represent baseline and shortcutrouting cases respectively. The blue and green lines representCMS and RTA average total delay respectively. The inverseeffect to throughput is seen as delay decreases with increasedRTA equipage. Although RTA delay is usually less than CMSdelay, the difference is minimal. A much larger difference indelay is seen between baseline and shortcut routing. Theshortcut routing delay reduction over the baseline ranges fromover 1 minute at low equipage ratios to 20 sec at highequipage ratios.61% 60% 59% 58% 57% 56% 55% 30"54% 0" 0.1" 0.2" 0.3" 0.4" 0.5" 0.6" 0.7" 0.8" 0.9" 1"RTA Equipage RatioFigure 5. Average Center, TRACON speed, andTRACON path delay.Baseline 62% 60"0"Shortcut 0 0.1 0.2 0.3 0.4 0.5 0.6 0.7 0.8 0.9 1 RTA Equipage RatioFigure 6. Speed control workload vs. equipage ratioThere were no instances of vectoring for all simulations.This shows that even though the high meter fix arrival p
The arrival scheduler was modeled after TBFM's terminal metering functionality. This is a multi-point first-come-first-served constraint-modified scheduler [5]. Flights are assigned an arrival runway and STAs at multiple coordination points along a fixed route (e.g. the arrival meter fix, runway