Transcription
Data Analysis Brief:Medicare-Medicaid Dual Enrollment2006 through 2019Prepared by the CMS Medicare-Medicaid Coordination Office (MMCO)November 2020Enrollment Trends from 2006 through 2019BACKGROUNDThis report summarizes enrollment trends among people dually eligible for Medicare and Medicaid from2006 through 2019.1 This report is the sixth iteration of the original Data Analysis Brief issued in February2013.This Data Analysis Brief presents the number of beneficiaries who were “ever-enrolled” in both Medicareand Medicaid for at least one month over the course of each calendar year.2 Please see the detailed tablesthat form the basis of this report in the accompanying Excel file that is posted on our website. In this paper,we include the Medicare-only population for comparison purposes.3SUMMARY OF KEY FINDINGS Total dually eligible beneficiary population continues to grow: Between 2006 and 2019, thetotal number of dually eligible beneficiaries increased from 8.6 million to 12.3 million, an averageannual growth rate (AAGR) of 2.8 percent. In comparison, the number of Medicare-onlybeneficiaries increased from 37.0 million to 52.1 million, an AAGR of 2.7 percent. Enrollment growth in partial-benefit eligibility categories outpaces full-benefit categories buthas slowed in recent years: The number of partial-benefit4 dually eligible beneficiaries increasedfrom 1.8 million in 2006 to 3.6 million in 2019, an AAGR of 5.3 percent. This rate is more thantwo and a half times the 2.0 percent AAGR among full-benefit dually eligible beneficiaries, asubpopulation that increased from 6.8 million in 2006 to 8.8 million in 2019. Partial-benefiteligibility categories experienced faster growth than full-benefit categories from 2006 to 2013,with respective AAGRs of 7.6 percent and 1.8 percent during that period. From 2014 to 2020,the AAGR for partial-benefit dually eligible beneficiaries was 2.6 percent, compared to 2.1percent for full-benefit dually eligible beneficiaries, reflecting slowing growth rates for partial-1This report and other analytic products can be accessed at the CMS Medicare-Medicaid Coordination Office analyticswebpage: aidCoordination-Office/Analytics.html.2 Please see Attachment B, section 5 for definition of “ever-enrolled.”3 As CMS Medicaid data becomes more current, we plan to expand our comparative analysis to include the similarsubpopulations in Medicaid. For comparison to Medicaid-only individuals with disabilities, please see reports on chronicconditions and state/national profiles: id-Coordination-Office/Analytics.html.4 See Attachment B, sections 3-4, for definition of “Partial Benefit” dually eligible beneficiary.1
benefit categories. Overall, there has been a notable shift in the composition of the population,with those with partial benefits accounting for 21.2 and 28.9 percent of all dually eligiblebeneficiaries in 2006 and 2019, respectively.5 Disability status varies between dually eligible beneficiaries and Medicare-only beneficiaries:In 2019, 37.5 percent of dually eligible beneficiaries were currently qualified for Medicare dueto disability with or without accompanying end-stage renal disease (ESRD), compared to only8.0 percent of Medicare-only beneficiaries. From 2006 to 2019, the AAGR for the number ofdually eligible individuals with Medicare-qualifying disabilities was 2.7 percent, compared to 0.1percent among Medicare-only beneficiaries with Medicare-qualifying disabilities. As a result,among all Medicare-eligible individuals who had disability as their current Medicare eligibilitystatus, the proportion who were dually eligible steadily shifted from 44.3 percent in 2006 to52.6 percent in 2019. Demographic information: In 2019, dually eligible beneficiaries continue to bedisproportionately younger, female, and of minority race/ethnicity, compared to other Medicarebeneficiaries.DETAILED RESULTS AND TRENDSThis section summarizes enrollment trends among persons who are dually enrolled in both Medicare andMedicaid at any given point during the course of a given calendar year. These ever-enrolled dually eligiblebeneficiary population counts, from 2006 through 2019, are presented by age, sex, race/ethnicity, dualeligibility status, and current Medicare status. For more details, see the accompanying Excel tables.1. Trends in Dually Eligible and Medicare-only Enrollment Enrollment in Medicare, whether alone or with dual enrollment in Medicaid, has been steadilygrowing over time. (See Attachment A: Table 1 and Figure 1.1a.)oThe total Medicare population, including dually eligible beneficiaries, increased from45.7 million in 2006 to 64.4 million in 2019, an AAGR of 2.7 percent.oThe number of dually eligible beneficiaries increased from 8.6 million in 2006 to 12.3million in 2019, an AAGR of 2.8 percent.oIn comparison, the number of Medicare-only beneficiaries increased from 37.0million in 2006 to 52.1 million in 2019, an AAGR of 2.7 percent.The proportion of Medicare beneficiaries who were dually eligible for Medicaid increased onlyslightly, from 18.9 percent in 2006 to 19.1 percent in 2019. This percentage peaked at 19.8percent in 2011 but has since declined slightly to 19.1 percent in 2019. (See Attachment A:Table 1 and Figure 1.1b.)5While multiple factors may be responsible for the disproportionate growth of the partial-benefit categories, the MedicareImprovements for Patients and Providers Act (MIPPA) of 2007, which streamlined some eligibility requirements for QMB, SLMB,and QI, is likely to have been a major contributor.2
Growth in partial-benefit dually eligible enrollment appears to be driving the growth ratenoted above for the dually eligible beneficiary population overall. Specifically, the number ofpartial-benefit dually eligible beneficiaries increased at an average rate of 5.3 percent per yearfrom 2006 to 2019, from 1.8 million to 3.6 million. In contrast, the number of dually eligiblebeneficiaries with full Medicaid benefits increased by 2.0 percent per year, on average, from6.8 million to 8.8 million. (See Attachment A: Table 1 and Figures 1.1c – 1.1d and 3.)oAlso indicative of a shifting distribution, the percent of all dually eligible beneficiarieswho were eligible only for partial benefits increased from 21.2 percent to 28.9percent from 2006 to 2019.oIn 2019, 71.6 percent of all full-benefit dually eligible beneficiaries were QualifiedMedicare Beneficiaries (QMB-plus), versus 68.4 percent in 2006.oIn 2019, among partial-benefit dually eligible beneficiaries, 48.3 percent wereQualified Medicare Beneficiaries without Medicaid (QMB-only), partial-benefitindividuals who are eligible for assistance with Medicare cost sharing but are noteligible for full Medicaid benefits, up from 44.4 percent in 2006.oPartial-benefit Specified Low-Income Medicare Beneficiaries without other Medicaid(SLMB-only) made up 32.6 percent of those with partial Medicaid benefits in 2019,down from 36.1 percent in 2006.2. Trends in Demographics and Disability Status from 2006 through 2019 The composition of dually eligible beneficiaries by age, sex, and race/ethnicity changed slightlybetween 2006 and 2019. (See Attachment A: Figures 2.1 – 2.3.)oRace/ethnicity: The proportion of dually eligible beneficiaries who are of a minorityrace/ethnic group increased from 41.1 percent in 2006 to 48.0 percent in 2019.Compared to Medicare-only beneficiaries, the dually enrolled population continuesto be more racially and ethnically diverse. For instance, in 2019, 48.0 percent of duallyeligible beneficiaries and 21.6 percent of Medicare-only beneficiaries were of a racialor ethnic minority group. More specifically, among dually eligible beneficiaries, 20.5percent were Black/African American; 18.0 percent were Hispanic/Latino; 6.6 percentwere Asian/Pacific Islander; 0.9 percent were American Indian/Alaska Native; and 0.7percent were “other” race/ethnicity groups.oGender: In 2019, about 59.4 percent of the dually eligible beneficiaries were female,compared to 53.0 percent of Medicare-only (non-dual) beneficiaries. In 2006, womencomprised 62.5 percent of dually eligible beneficiaries and 54.1 percent of Medicareonly beneficiaries.oAge: In 2019, 37.9 percent of dually eligible beneficiaries were under the age of 65,down from 38.3 percent in 2006 and a high of 41.6 percent in 2014. In contrast,3
among Medicare-only beneficiaries, 8.1 percent were under the age of 65 in 2019,down from 11.3 percent in 2006. From 2006 to 2019, the number of dually eligible beneficiaries under the age of 65 and thenumber age 65 and older grew at similar overall rates but had different underlying patternsof growth. (See Attachment A: Figure 2.1.)oSince 2006, the number of dually eligible beneficiaries under the age of 65 increasedfrom 3.3 million to 4.7 million. Among those beneficiaries age 65 and older, thenumber increased from 5.3 million to 7.7 million. The AAGRs between 2006 and 2019were 2.7 and 2.8 percent for the two age groups, respectively. Since 2017, all of thegrowth has occurred in the group of dually eligible beneficiaries who were age 65 andolder while the number of dually eligible beneficiaries under the age of 65 hasdecreased slightly.oAmong dually eligible beneficiaries with partial benefits, the number of beneficiariesunder the age of 65 doubled, from 0.7 million to 1.4 million between 2006 and 2019.Among partial-benefit dually eligible beneficiaries age 65 and older, the numberenrolled increased from 1.1 million to 2.2 million individuals. The AAGRs for the twoage groups of partial-benefit dually enrolled individuals were 5.5 and 5.2 percent,respectively.oFull-benefit dually eligible beneficiaries under the age of 65 have increased in numbersince 2006, from 2.6 million to 3.3 million individuals. Full-benefit dually eligiblebeneficiaries age 65 and older have similarly increased in number, increasing from 4.2million to 5.4 million individuals. The AAGRs for both groups were 1.8 and 2.0 percent,respectively.oIn comparison, from 2006 to 2019, the Medicare-only population grew by fewer than100,000 individuals under the age of 65, remaining roughly static at 4.2 millionindividuals, and increased from 33.0 to 47.9 million individuals age 65 and older. TheAAGRs were 0.1 and 2.9 percent for the two age groups, respectively.A greater proportion of dually eligible beneficiaries than Medicare-only beneficiaries had aMedicare-qualifying disability. (See Attachment A: Figure 5.)oIn 2019, 37.5 percent of dually eligible beneficiaries were currently eligible forMedicare due to a disability (with or without ESRD), compared to 37.9 percent in2006.oIn comparison, only 8.0 percent of Medicare-only beneficiaries had a qualifyingdisability (with or without ESRD) in 2019, down from 11.1 percent in 2006.DATA SOURCES AND METHODOLOGYThis analysis used the Common Medicare Environment (CME) data from the CMS Chronic Condition4
Warehouse (CCW) to track enrollment numbers and trends across demographic groups.6 The statereported “State MMA File” data were used to identify dually eligible beneficiaries. As required by theMedicare Modernization Act (P.L. 108-173), states submit these files to CMS on an at-least-monthly basisto report which of their Medicaid beneficiaries are eligible for Medicare benefits, and their specific dualeligibility type. Using the “ever-enrolled” approach, any individual with one or more months of dualeligibility in a year was counted as a dually eligible beneficiary. The State MMA File is considered themost current, accurate, and consistent source of information on beneficiaries’ dual eligibility status forany given month. See Attachment B on defining dually eligible beneficiaries in CMS administrative datasources.6P-values were not computed because, given the large sample size, almost all differences are statistically significant.5
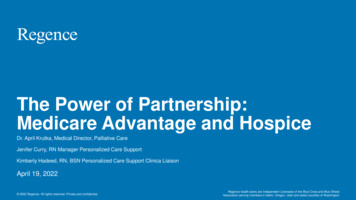
ATTACHMENT ABelow, Figure 1.1a shows the increase in dually eligible and Medicare-only enrollment from 2006 to 2019.The dually enrolled population increased steadily from 8,649,890 in 2006 to 12,339,182 in 2019, a 2.8percent AAGR over the fourteen years. Medicare-only non-dually eligible beneficiaries increased from37,035,298 in 2006 to 52,104,185 in 2019, an AAGR of 2.7 percent. Taken as a whole, the total Medicarepopulation increased from 45,685,188 in 2006 to 64,443,367 in 2019, an AAGR of 2.7 percent.Figure 1.1a: Number of Dually Eligible and Medicare-only Beneficiaries (2006-2019)Dual EnrollmentMedicare-only 0720066
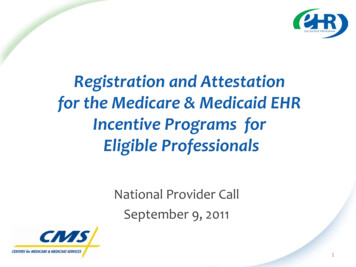
Figure 1.1b shows that the proportion of total Medicare beneficiaries composed of dually eligiblebeneficiaries increased slightly from 18.9 to 19.1 percent from 2006 through 2019. This percentage peakedat 19.8 percent in 2011 but has since declined slightly to 19.1 percent in 2019.Figure 1.1b: Dually Eligible Beneficiaries as a Proportion of All Medicare Beneficiaries 4201320122011201020092008200720067
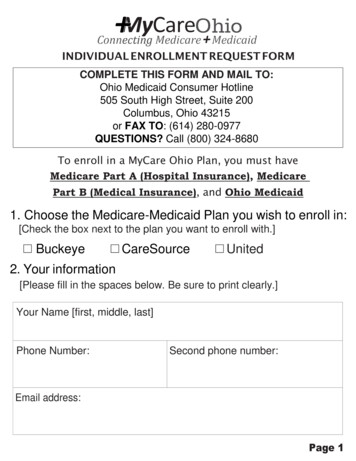
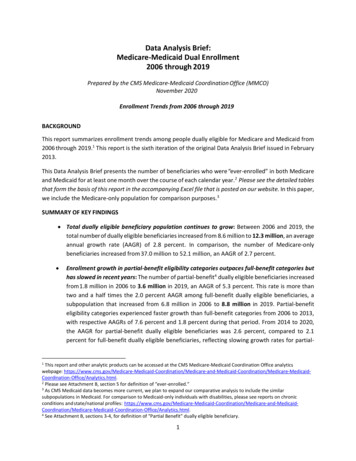
Figure 1.1c shows enrollment trends among full- and partial-benefit beneficiaries. Full-benefit enrollmentincreased from 6,819,768 in 2006 to 8,768,749 in 2019. Partial-benefit enrollment increased from1,830,122 to 3,570,433 over the same time span. These numbers equate to AAGRs of 2.0 percent amongfull-benefit beneficiaries and 5.3 percent among partial-benefit beneficiaries.Figure 1.1c: Full- and Partial-Benefit Dually Eligible Beneficiaries (2006-2019)Full-benefit Dual EnrollmentPartial-benefit Dual 201620152014201320122011201020092008200720068
Figure 1.1d shows that the proportion of dually eligible beneficiaries who receive partial benefits (i.e.,Medicaid assistance with Medicare cost sharing, but no additional Medicaid benefits eligibility) increasedfrom 21.2 percent of all dually enrolled beneficiaries in 2006 to 28.3 percent in 2013, has since remainedrelatively steady, and was 28.9 percent in 2019.Figure 1.1d: Partial-benefit as a Proportion of All Dually Eligible Beneficiaries 82017201620152014201320122011201020092008200720069
Figure 2.1 shows a shift in the age distribution of dually eligible individuals from 2006 to 2019. Generally,the proportion of dually eligible beneficiaries in all age groups declined slightly, except for age brackets 5564 and 65-74, which increased 5.6 and 6.8 percentage points to 17.4 and 32.8 percent, respectively, in2019.Figure 2.1: Percent of All Dually Eligible Beneficiaries by Age Group (2006-2019) 2121-4445-5455-6465-7475-8485 201220112010200920082007200610
Figures 2.2a and 2.2a (zoom) show a gradual shift in the race/ethnicity composition of dually eligiblebeneficiaries from 2006 to 2019. These graphs show that among the dually eligible population, theproportion of enrollees in race/ethnicity minority groups collectively increased 7.0 percentage points from2006 to 2019. Over these fourteen years, the proportion of African American, Hispanic/Latino(a), Asian,and American Indian/Alaska Native beneficiaries each increased slightly to 20.5 percent, 18.0 percent, 6.6percent, and 0.9 percent in 2019, respectively, while the White population declined by 7.0 percentagepoints to 52.0 percent.Figure 2.2a: Percent of Dually Eligible Beneficiaries by Race/Ethnicity Group (2006-2019)WhiteAfrican AmericanHispanic/LatinoAsianNorth American 62015201420132012201120102009200820072006Figure 2.2a (zoom): Percent of Dually Eligible Beneficiaries by Race/Ethnicity Group, Excluding White(2006-2019)African AmericanHispanic/LatinoAsianNorth American 201220112010200920082007200611
The race/ethnicity composition is different for Medicare-only beneficiaries, as compared to that of duallyeligible beneficiaries (Figure 2.2a). Figures 2.2b and 2.2b (zoom) show that among the Medicare-onlypopulation, enrollees in race/ethnicity minority groups increased 4.8 percentage points from 2006 through2019. In 2019, White, African American, Hispanic/Latino(a), Asian, and American Indian/Alaska Nativebeneficiaries comprised 78.9 percent, 8.1 percent, 7.4 percent, 2.7 percent, and 0.3 percent of theMedicare-only population, respectively. Note that for easy comparison, Figure 2.2b (zoom) for Medicareonly beneficiaries maintains the same scale as 2.1b (zoom) for dually eligible beneficiaries.Figure 2.2b: Percent of Medicare-only Beneficiaries by Race/Ethnicity Group (2006-2019)WhiteAfrican AmericanHispanic/LatinoAsianNorth American 6201520142013201220112010200920082007Figure 2.2b (zoom): Percent of Medicare-only Beneficiaries by Race/Ethnicity Group, Excluding White(2006-2019)African AmericanHispanic/LatinoAsianNorth American 20122011201020092008200712
Figure 2.3 shows a gradually shifting gender composition among both dually eligible beneficiaries andMedicare-only beneficiaries from 2006 to 2019. Among dually eligible beneficiaries, females declined 3.0percentage points to 59.4 percent in 2019. Among Medicare-only beneficiaries, females declined by 1.1percentage point, to 53.0 percent in 2019.Figure 2.3: Females as a Percentage of Total Dually Eligible Beneficiaries and Medicare-only Beneficiaries(2006-2019)Medicare-Medicaid EnrolleesMedicare-only 16201520142013201220112010200920082007200613
Figure 3 shows the composition of the dually eligible population by eligibility status from 2006 through2019. Partial-benefit eligibility groups (including QMB-only) account for a growing share of dually eligiblebeneficiaries, increasing from 21.2 percent of all dually eligible individuals in 2006 to 28.9 percent of alldually eligible individuals in 2019. QMB-only beneficiaries more than doubled in number, increasing from812,716, or 9.5 percent, of all dually eligible beneficiaries in 2006, to 1,726,063, or 14.0 percent, of all duallyeligible beneficiaries in 2019. Full-benefit QMB beneficiaries increased to 6,276,701 in 2019. SLMB-onlyand SLMB-plus beneficiaries increased to 1,162,997 and 327,802 beneficiaries, respectively, in 2019. Thenumber of QDWI beneficiaries remained relatively low at 1,733 in 2019. Also in the partial-benefit category,Qualifying Individuals (QI) increased in number to 679,640 in 2019. Finally, the number of beneficiaries inthe “Other Full-benefit Dual” category increased to 2,164,246 in 2019.Figure 3: Total Dually Eligible Beneficiaries by Eligibility Status 6,000,0004,000,0002,000,000-03. SLMB-only02. QMB w/ Medicaid RX01. QMB-only14201904. SLMB w/ Medicaid RX201805. QDWI201706. Qualifying 7200608. Other (Non QMB, SLMB, QWDI or QI) w/ Medicaid RX
Figure 4 shows the trends in the shifting age composition among dually eligible beneficiaries from 2006 to2019. The proportion of all individuals under the age of 65 who were dually eligible increased from 44.2percent in 2006 to 52.5 percent in 2019. In raw numbers, dually eligible beneficiaries under the age of 65increased from 3.3 to 4.7 million, thereby surpassing the number of Medicare-only beneficiaries under theage of 65, which remained roughly 4.2 million beneficiaries. Proportionally, the distribution of duallyeligible beneficiaries under the age of 65 decreased slightly from 38.3 to 37.9 percent. The comparableproportion of Medicare-only beneficiaries who were under the age of 65 dropped from 11.3 percent in2006 to 8.1 percent in 2019.Figure 4: Proportion of All Beneficiaries under the Age of 65 Who are Dually Eligible Beneficiaries 172016201520142013201220112010200920082007200615
Figure 5 shows the change in the percentage of beneficiaries with a Medicare-qualifying disability (with orwithout ESRD) and confirms the results in Figure 4. The proportion of all individuals with a current Medicarequalifying status as disability or disability/ESRD who were dually eligible increased from 44.3 percent in2006 to 52.6 percent in 2019. In 2019, 37.5 percent of dually eligible beneficiaries and 8.0 percent ofMedicare-only beneficiaries were currently eligible for Medicare due to a disability. Among dually eligiblebeneficiaries, the percentage with a Medicare-qualifying disability climbed steadily from 37.9 percent in2006 to 41.1 percent in 2014, and then fell to 37.5 percent in 2019. Among Medicare-only beneficiaries,the percentage with a Medicare-qualifying disability (with or without ESRD) gradually fell from 11.1 percentin 2006 to 8.0 percent in 2019.Figure 5: Among All Beneficiaries Qualifying for Medicare due to Disability (With or WithoutAccompanying ESRD), the Proportion Who are Dually Eligible Beneficiaries 0172016201520142013201220112010200920082007200616
Table 1: Annual Enrollment Trends, by Enrollment Type (2006-2019)TotalNumber iaries)TotalNumber ll MedicareEnrollees,the Percentwho areMedicareOnly 8,74971.1%3,570,43328.9%CalendarYearThe PercentTotalTotalWho areNumber ofNumber ongEligibleBeneficiaries All MedicareBeneficiariesEnrollees17The PercentThe PercentTotalwith FullWho areNumber gAmong AllDuallyAll eneficiariesBeneficiaries
ATTACHMENT BDefining Medicare-Medicaid Dually Enrolled Beneficiaries in CMS Administrative DataThis document provides MMCO’s recommended method of identifying Medicare-Medicaid duallyenrolled beneficiaries from CMS data. As detailed below, this recommended method relies on the StateMMA File of Dual Eligibles. There are several other ways of identifying dually eligible beneficiaries inpractice (e.g., the Transformed Medicaid Statistical Information System (T-MSIS) and data from T-MSISAnalytic Files (TAF), self-reported data in Medicare Current Beneficiary Survey (MCBS) and ConsumerAssessment of Healthcare Providers and Systems (CAHPS), State Buy-in data on the Medicare files) thatare appropriate for certain analyses. However, the State MMA File is considered the most current andmost accurate given that it is used for operational purposes related to the administration of Part Dbenefits. To the extent that users opt to use the State MMA File over other data sources, whenappropriate, the State MMA File will also contribute consistency, comparability, and relevance to CMSoperational and analytic endeavors.1. Source Data for Identifying Dual Eligibility7The State MMA File of Dual Eligibles (aka “State MMA File”) is considered the most current,accurate, and consistent source of information on dually eligible beneficiaries. As required bythe Medicare Modernization Act (MMA), states submit these data files to CMS on an at-leastmonthly basis to identify which of their Medicaid beneficiaries are also eligible to receiveMedicare. These files also include beneficiaries’ type of dual eligibility status (see Section 3below).2. Accessing the State MMA File DataThe State MMA File data are housed and can be accessed as follows:a. Integrated Data Repository (IDR): In the IDR, the State MMA File data elements aresourced from the CME DUAL MDCR Table and are named as follows (with thenumeric portion at the end of the variable corresponding to calendar month):BENE DUAL STUS 01 through BENE DUAL STUS 12.b. Chronic Condition Warehouse (CCW): In the CCW, the monthly State MMA File dataelements are named as follows (with the numeric portion at the end of the variablecorresponding to calendar month): DUAL STUS CD 01 through DUAL STUS CD 12.They are also present in the CCW with a shorter data element name as follows:DUAL 01 through DUAL 12.3. Types of Medicare-Medicaid Beneficiaries Based on BenefitsMedicare-Medicaid beneficiaries are typically classified according to the benefits that they7The State MMA File definition of Medicare-Medicaid beneficiary implies simultaneous enrollment (in any given month) inboth Medicaid and Medicare (Part A and/or Part B). Please note that, in some instances (e.g., Demonstrations), it may bemore appropriate for Medicare-Medicaid beneficiaries to be defined more stringently according to co-enrollment (in anygiven month) in both Medicaid and Medicare Parts A and B. In this case, the analyst would need to develop an appropriatesubset of the Medicare-Medicaid beneficiaries’ definition that has been provided in this document by limiting to certaindual status codes or other relevant criteria.18
are eligible to receive, which vary by income and assets at any given point in time. The seventypes of Medicare-Medicaid dual eligibility are described below.8,9Dual Status Code "01" [“Partial-benefit”] Qualified Medicare Beneficiaries without otherMedicaid (QMB-only) – These individuals are entitled to Medicare Part A, haveincome of 100 percent Federal poverty level (FPL) or less and resources that do notexceed twice the limit for SSI eligibility (adjusted for inflation), and are not otherwiseeligible for full Medicaid. Medicaid pays their Medicare Part A premiums, if any,Medicare Part B premiums, and to the extent consistent with the Medicaid State plan,Medicare deductibles and coinsurance for Medicare services provided by Medicareproviders.10Dual Status Code "02" [“Full-benefit”] Qualified Medicare Beneficiaries plus full Medicaid(QMB-Plus) - These individuals are entitled to Medicare Part A, have income of 100percent FPL or less and resources that do not exceed twice the limit for SSI eligibility(adjusted for inflation), and are eligible for full Medicaid benefits. Medicaid pays theirMedicare Part A premiums, if any, Medicare Part B premiums, and, to the extentconsistent with the Medicaid State plan, Medicare deductibles and coinsurance, andprovides full Medicaid benefits.11Dual Status Code "03" [“Partial-benefit”] Specified Low-Income Medicare Beneficiarieswithout other Medicaid (SLMB-only) - These individuals are entitled to Medicare PartA, have income of greater than 100 percent FPL but less than 120 percent FPL andresources that do not exceed twice the limit for Supplemental Security Income (SSI)eligibility (adjusted for inflation), and are not otherwise eligible for Medicaid.Medicaid pays their Medicare Part B premiums only.Dual Status Code "04" [“Full-benefit”] Specified Low-Income Medicare Beneficiaries plusfull Medicaid (SLMB-plus) - These individuals are entitled to Medicare Part A, haveincome of greater than 100 percent FPL but less than 120 percent FPL, and resources8While there are seven categories currently in use, please note that type “7” is missing and the final category is “8”. This isbecause the seventh classification “QI-2” (Qualifying Individuals-2) is not currently in use. Additionally, please note that type“9” is not included; this is because the ninth code (“other”) has typically been used by only a handful of states to indicateparticipation in a State-specific program that is not directly related to whether the beneficiary is or is not dually enrolled inMedicare and Medicaid (e.g., Wisconsin Pharmacy Waiver).9 The income and asset limits for the Medicare Savings Plans (MSPs) are released annually by CMS. The income limit forQualified Disabled Working Individual (QDWI) includes an earned income disregard of 65. The asset limit calculation forQMB, SLMB, and QI beneficiaries is 3 times the SSI resource limit, adjusted annually by increases in the Consumer PriceIndex (effective January 1, 2010). States can effectively raise the federal floor for income and resources standards under theauthority of section 1902(r)(2) of the Social Security Act, which generally permits state Medicaid agencies to disregardincome and/or resources that are counted under certain standard financial eligibility methodologies. Some states have usedthe authority of section 1902(r)(2) of the Act to eliminate any resource criteria for the MSP groups.10 Providers can bill Medicaid programs for these amounts, but states have the option to reduce or eliminate the state’sMedicare cost-sharing payments by adopting policies that limit payment to the lesser of (a) the Medicare cost-sharingamount, or (b) the difference between the Medicare paym
This Data Analysis Brief presents the number of beneficiaries who were “ever-enrolled” in both Medicare and Medicaid for at least one month over the course of each calendar year.2 Please see the detailed tables that form the basis of this report in the accompanying Excel