Transcription
AP CohortData Report GRADUATING CLASS OF 2016
About the DataThis report represents U.S. public school students only because a centralsource of enrollment and demographic data for nonpublic schools isnot available for all states. References to the total number of high schoolgraduates represent projections supplied in Knocking at the College Door(Western Interstate Commission for Higher Education, 2016). Additionally,this report looks at students’ entire experience with AP—accounting forexams taken by members of the class of 2016 throughout their time in highschool—rather than reporting exam results from a particular school year.
G R A D U AT I N G C L A S S O F 2 016 ContentsIntroduction . . . . . . . . . . . . . . . . . . . . . . . . . . . . . . . . . . . . . . . . . . . . . . . . . . . . . . . . . . . . . . . . . . . . . . . . . . . . . . 2Expanding Access.2Measuring Progress . . . . . . . . . . . . . . . . . . . . . . . . . . . . . . . . . . . . . . . . . . . . . . . . . . . . . . . . . . . . . . . . . . . 4National Highlights for the Class of 2016 . . . . . . . . . . . . . . . . . . . . . . . . . . . . . . . . . . . . . . . . . 4The Benefits of AP Courses and AP Exams . . . . . . . . . . . . . . . . . . . . . . . . . . . . . . . . 5 Focus on Access . . . . . . . . . . . . . . . . . . . . . . . . . . . . . . . . . . . . . . . . . . . . . . . . . . . . . . . . . . . . . . . . . . . . . . . 6New Courses . . . . . . . . . . . . . . . . . . . . . . . . . . . . . . . . . . . . . . . . . . . . . . . . . . . . . . . . . . . . . . . . . . . . . . . . . . . . 7Resources and Opportunities . . . . . . . . . . . . . . . . . . . . . . . . . . . . . . . . . . . . . . . . . . . . . . . . . . . . . . . . 8National AP Participation and Performance . . . . . . . . . . . . . . . . . . . . . . . . . . . . . . 12Figure 1: 2016 Performance . . . . . . . . . . . . . . . . . . . . . . . . . . . . . . . . . . . . . . . . . . . . . . . . . . . . . . . . 13Figure 2a: Performance Trend . . . . . . . . . . . . . . . . . . . . . . . . . . . . . . . . . . . . . . . . . . . . . . . . . . . . . 14Figure 2b: Performance Trend, Percentage Change Over TimeFigure 3: Score Distributions by State.15.16Opportunity for All Students . . . . . . . . . . . . . . . . . . . . . . . . . . . . . . . . . . . . . . . . . . . . . . . . . . . . 17Equity: Creating Access and Opportunity for All Students . . . . . . . . . . . . . . . . . . 17Figure 4a: Demographics of AP Exam Takers . . . . . . . . . . . . . . . . . . . . . . . . . . . . . . . . . . 18Figure 4b: Demographics of the Class of 2016 . . . . . . . . . . . . . . . . . . . . . . . . . . . . . . . . . 18Focus on Low-Income Students . . . . . . . . . . . . . . . . . . . . . . . . . . . . . . . . . . . . . . . . . . . . . . . 19Changes to Federal Funding for Low-Income AP Students. . . . . . . . . . . . . . . . . . 19Figure 5: Equity Gaps Among Low-Income Students. . . . . . . . . . . . . . . . . . . . . . . . . 20Next Steps . . . . . . . . . . . . . . . . . . . . . . . . . . . . . . . . . . . . . . . . . . . . . . . . . . . . . . . . . . . . . . . . . . . . . . . . . . . . . . 22Strategies for Progress and Supporting Student Success.22Appendix . . . . . . . . . . . . . . . . . . . . . . . . . . . . . . . . . . . . . . . . . . . . . . . . . . . . . . . . . . . . . . . . . . . . . . . . . . . . . . . . 24A P C O H O R T D ATA
A P C O H O R T D ATA G R A D U AT I N G C L A S S O F 2 016First AP Exam Administration, 1956IntroductionExpanding AccessFor 60 years, the College Board’s AP Program has been deliveringexcellence in education to millions of students across the country.In 1956, during the first AP Exam administration, 1,229 students in 104schools sat for 2,199 AP Exams. By 2016, those numbers had grown to 2.6million students in nearly 22,000 schools sitting for 4.7 million exams.AP currently offers 38 courses in a wide variety of subject areas—includingart, computer science and mathematics, world languages and culture,natural and physical sciences, English, government and politics, and more.Students who participate in AP dig deeper into the subjects they love,exploring new ideas with their classmates and teachers, while facing uniquechallenges and learning skills that will lead to increased readiness for lifeafter high school.2
G R A D U AT I N G C L A S S O F 2 016 In fall 2016, AP launched its newest course: AP Computer Science Principles(AP CSP). AP CSP was designed to broaden the invitation to computerscience, especially to students who are traditionally underrepresentedin the computer science field. Over 2,500 schools are offering APCSP in its first year, making it the largest course launch in AP’s history.Expanding access to AP CSP means expanding access to computerscience education that will prepare students for the jobs of tomorrow.Another important component of expanding AP access is ensuringthat low-income students are able to take AP Exams. Since 1998, thefederal government has provided funding for low-income students totake AP Exams under the Advanced Placement Test Fee Program. Theresults have been significant. In 1999, nearly 45,000 low-income studentsused federal funding to help cover the cost of AP Exams; in 2016, morethan 450,000 did. Beginning with the May 2017 AP Exams, however, theAP Test Fee Program is ending, and federal funds will be distributed tostates through one block grant: Every Student Succeeds Act (ESSA)Title IV, Part A. Suggestions for how states and districts can ensurethat low-income students continue to receive federal funding to reducethe costs of their AP Exams can be found on page 19 of this report.As schools have worked with parents to encourage prepared andwilling students to take AP, they’ve also ensured that AP classes remainchallenging, college-level academic environments. In “AP at Scale:Public School Students in Advanced Placement, 1990–2013,”1 AmericanEnterprise Institute researcher Nat Malkus presents data showing thatincreasing numbers of students are embracing and succeeding in APcourses. The report points out that while AP participation increasedsignificantly between 2000 and 2009, there was no corresponding drop inthe test scores of AP students, demonstrating that the program continuedto grow while maintaining its high level of quality. Malkus wrote, “Expandingat scale without sacrificing rigor is the rarest kind of success in publiceducation, and AP is showing just that.” He also noted that “AP’s dramaticgrowth has made it an indispensable part of public education, but the realfeat has been maintaining quality at scale.” Malkus called AP perhaps “thesingle happiest education story of the century.”1. Malkus, Nat. “AP at Scale.” (2016). .pdf3A P C O H O R T D ATA
A P C O H O R T D ATA G R A D U AT I N G C L A S S O F 2 016Measuring ProgressTaking a closer look at the progress states are making toward expandingaccess to AP, the College Board reports on the participation andperformance of U.S. public school students in each year’s graduating class.2The AP Cohort Data Report uses multiple years of AP data to present afull picture of a graduating class’s entire experience with the AdvancedPlacement Program , tracking exams taken by graduates throughout theirtime in high school.The longitudinal approach of the AP Cohort Data Report revealsthe longer-term results of state- and district-level initiatives,providing information educators and policymakers can use to: Celebrate their successes. Understand their distinct challenges. Set meaningful, data-driven goals to increase access, opportunity,participation, and performance for all students.National Highlights for the Class of 2016 1.1 million students in the class of 2016 took more than 3.8 millionAP Exams in public high schools nationwide, as educators across thecountry continue to enable a wider and more diverse population ofstudents to participate in AP. 36.2% of the class of 2016 took at least one AP Exam during highschool, and 21.9% of the graduating class scored a 3 or higher on atleast one AP Exam. In the class of 2016, AP Exam Fee Reductions were used by 30.1%of total AP Exam takers and 24.9% of AP Exam takers scoring a 3or higher on at least one AP Exam. More low-income students areparticipating and experiencing success in AP than ever before, makingthe funding of AP Exams under ESSA grant programs an essential partof creating equal access for all students going forward. Over the past 10 years, the percentage of all U.S. public high schoolgraduates earning a score of 3 or higher on at least one AP Exam hasgrown by 7.6 percentage points. Traditionally underrepresented students—including black/AfricanAmerican, Hispanic/Latino, American Indian/Alaska Native, and NativeHawaiian/Other Pacific Islander students—need increased accessand support to succeed in AP.2. Because reliable enrollment and demographic data for nonpublic schools are not availablefor all states, this national report represents U.S. public school students only.4
G R A D U AT I N G C L A S S O F 2 016The Benefits of AP Coursesand AP Exams In addition to college-level coursework, taking AP Exams is anessential part of the AP experience and helps students to:Save time and money once they get to college, providingthem with opportunities to move directly into upper-levelcourses by earning college credit, advanced placement,or both.Stand out in the college admission process by showingthat they’re committed to success beyond high schooland prepared for the challenges of college.Earn academic scholarships and awards from collegesand universities.Develop confidence to overcome new academicchallenges.Why do AP Exam scores of 3 or higher matter?When compared to their peers who did not take an AP Examwhile in high school, students who score a 3 or higher on anAP Exam typically:3 Earn higher grade-point averages (GPAs) in college. Perform as well as or better in subsequent college coursesin the exam discipline than non-AP students who took thecorresponding introductory college course. Take more—not less—college coursework in the discipline. Are more likely to graduate from college on time in four years. Have higher graduation rates. More recent research4 shows that even students who score1s and 2s on exams are more likely to graduate from collegein four years.3. For supporting research, see bit.ly/WnOQBn, bit.ly/YWbtTg, and bit.ly/13MGkl1.4. For supporting research, see bit.ly/2dEhUmI.5 A P C O H O R T D ATA
A P C O H O R T D ATA G R A D U AT I N G C L A S S O F 2 016Focus on AccessThe AP Program encourages educators to make equitable accessa guiding principle for their AP courses and give all willing andacademically prepared students the opportunity to participatein AP. In schools across the country, educators are: Eliminating barriers that restrict access to AP for students fromethnic/racial and socioeconomic groups that have been traditionallyunderrepresented. Making every effort to ensure their AP classes reflect the diversityof their student population. Providing all students with access to academically challengingcoursework before they enroll in AP classes.Complementing the local efforts of educators, the AP Program has recentlylaunched five new courses, diversifying course options and appealingto more students’ interests, and developed free resources and otheropportunities for teachers, school and district administrators, and stateleaders to help greater numbers of students succeed in AP.6
G R A D U AT I N G C L A S S O F 2 016New CoursesAP courses give students greater opportunities to explore the academicareas that interest them the most. Since 2014, five new courses have beenadded to AP: AP Seminar and AP Research are the two courses that constituteAP Capstone —an innovative diploma program that equips studentswith the independent research, collaborative teamwork, and writtenand oral communication skills that are increasingly valued by colleges.This program is designed to complement and enhance the in-depth,discipline-specific study experienced in other AP courses. AP Computer Science Principles was developed to introducecomputer science to a broader range of high school students. Itteaches students the foundational concepts of computer science andchallenges them to explore how computing and technology can impactthe world. With a unique focus on creative problem solving and realworld applications, AP Computer Science Principles prepares studentsfor college and career. AP Physics 1: Algebra-Based and AP Physics 2: Algebra-Based arethe equivalent of the first and second semesters of an introductory,algebra-based physics college course. Because these courses areintended to be yearlong courses, teachers have time to foster deeperconceptual understanding through student-centered, inquiry-basedinstruction. Students have time to master foundational physicsprinciples while engaging in science practices.7 A P C O H O R T D ATA
A P C O H O R T D ATA G R A D U AT I N G C L A S S O F 2 016Resources and OpportunitiesFOR TEACHERSWhen more teachers are knowledgeable about and prepared to teach AP,schools can offer new AP courses and more sections of existing AP coursesto open doors for greater numbers of students to participate in AP.Free resources on AP Central include the following. For moreinformation on teacher resources, visit apcentral.collegeboard.com.Student Performance Q&AIn this resource, the chief reader ofthe AP Exam compiles feedbackfrom leaders at the AP Reading todescribe how students performedon the free-response questions,summarizes typical student errors,and addresses specific conceptsand content with which studentshave struggled the most that year.Two-Page Course OverviewsThese documents providesuccinct descriptions of AP coursesand exams.Course and Exam DescriptionThis is the core document for eachAP course. It lays out the coursecontent and describes the AP Examand the AP Program in general.Instructional Planning ReportThis report shows the performanceof a school’s students on themultiple-choice and free-responsesections and on specific topicswithin an AP Exam, compared to allstudents who sat for that exam.Course FAQsThese documents provide answersto commonly asked questions aboutAP courses and exams.Course SyllabusDevelopment GuidesThese documents include theguidelines reviewers use to evaluatesyllabi along with three samples ofevidence for each requirement. Theguides also specify the level of detailrequired in the syllabus to receivecourse authorization.Video Overview ModulesThis series of videos provides anin-depth look at the AP courseand exam.Sample Course Planningand Pacing GuidesWritten by AP teachers, theseversatile guides demonstrate avariety of ways to plan and pace theAP curriculum across one academicyear. Each author presents a host ofideas for activities, resources, andassessments.Teaching and Assessing VideosThis series of videos features masterteachers modeling key instructionalstrategies for challenging skills, aswell as content and resources to helpteachers implement these strategiesin their classrooms.8
G R A D U AT I N G C L A S S O F 2 016 A P C O H O R T D ATAOther opportunities include:Becoming an AP ReaderTeachers who participate in theAP Reading in June get invaluableinsight into the AP Exam scoringprocess and can exchange ideasthrough networking with othereducators.Past Free-Response QuestionsTeachers can find free-responsequestions from the most recent examand exams from previous years to aidtheir classroom instruction and to getstudents ready for the AP Exam.Full-Length Practice ExamsTeachers can access full-lengthpractice exams through their APCourse Audit accounts to givestudents a real testing experienceprior to exam day.Becoming an APWorkshop ConsultantExperienced AP teachers can sharetheir expertise and best practiceswith other education professionalsby becoming AP workshopconsultants.Attending the APAnnual ConferenceTeachers can attend the AP AnnualConference with thousands of theirpeers and choose from hundreds ofdynamic sessions in one inspiringprofessional development event heldeach summer.AP Teacher CommunityTeachers can connect with othereducators in the AP TeacherCommunity—their online homefor discussing teaching strategies,asking questions, and sharing bestpractices. These online communitiessupport AP coordinators andteachers across all AP courses.AP Annual Conference 20169
A P C O H O R T D ATA G R A D U AT I N G C L A S S O F 2 016FOR SCHOOL AND DISTRICT LEADERSSchool and district leaders have shown dedication to AP by implementingand sustaining school practices and structures that support growingAP programs.Free resources include:Online Score Reports for EducatorsAuthorized school administratorsand AP coordinators have access tothe following reports that help thembetter understand the growth in APat their schools.AP Potential AP Potential is designed to helpeducators increase access to APand to ensure that no student whohas the chance of succeeding in APis overlooked. AP Potential is a free,web-based tool that allows schoolsto identify students who are likelyto score a 3 or higher on a given APExam based on their performance onthe PSAT/NMSQT , PSAT 8/9, PSAT 10, or SAT . AP Instructional Planning Report Subject Score Roster School Score Roster School Scholar Roster Scholar Summary ReportAP Potential is rooted in a long lineof research5 showing moderateto strong correlations betweenPSAT/NMSQT scores and AP Examresults, and that PSAT/NMSQTscores are stronger predictors ofstudents’ AP Exam scores thanthe more traditional factors such ashigh school grades and grades insame-discipline coursework. Student Score Report Student Data File Current Year Score Summary Five-Year School Score Summary School Summary by StudentDemographics School Summary withComparable Groups AP Equity and Excellence ReportEducators can use AP Potential toadd AP courses to their school’smaster course offerings and/or toadd more sections of AP coursesalready offered at their schools. College and University TotalsOther opportunities include:AP MentoringSchool and district administratorscan support their AP EnglishLiterature and Composition, AP U.S.History, and AP Computer SciencePrinciples teachers by connectingthem with expert teachers whowill help them enhance theirinstructional practices.5. For supporting research on AP Potential, see bit.ly/2f2k7OT, bit.ly/2ezRA3k, and bit.ly/2eFI0s0.10
G R A D U AT I N G C L A S S O F 2 016FOR STATE LEADERSPolicymakers at the state level are collaborating with local educators to increaseaccess to AP, especially among traditionally underrepresented students.Together, they are committing to: Professional DevelopmentOffer/require professional developmentopportunities for AP teachers thatinclude College Board workshops or APSummer Institutes. FundingProvide funding for all studentsto take AP Exams. Credit PolicyEnsure that public colleges anduniversities develop transparent, datadriven AP Exam policies that recognizestudent achievement by awardingcourse equivalent college creditand advanced placement based onqualifying scores, which leads to: AP PotentialEncourage students with AP potentialto choose AP by sending personalizedletters to students who qualify. Classroom ResourcesInvest in classroom resources, such asAP Insight, that provide digital toolkitsof assessments, instructional activities,and professional learning resources. AccountabilitySet a clear, measurable statewide goalfor AP to be incorporated into the statereport card, establishing indicators forboth AP participation and performance. 11Improved enrollmentefficiency for higher educationthrough seamless coursearticulation and transfer;Better student outcomes withincreased credit portability anddegree completion rates;Reduced duplication oraccumulation of excesscredit hours; andMinimized economic burdensfor students and families. A P C O H O R T D ATA
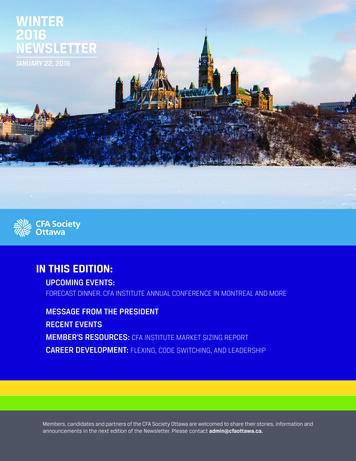
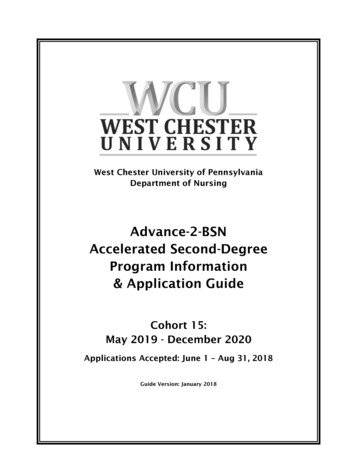
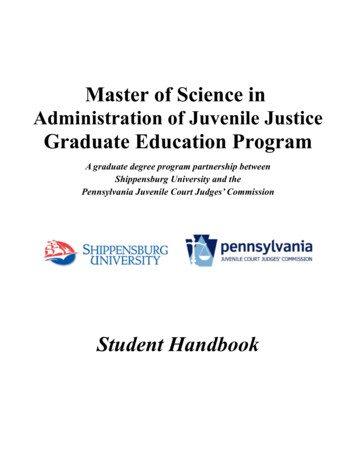
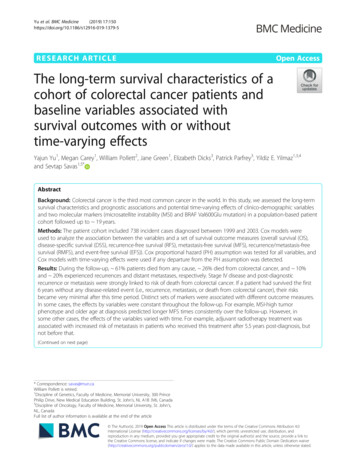
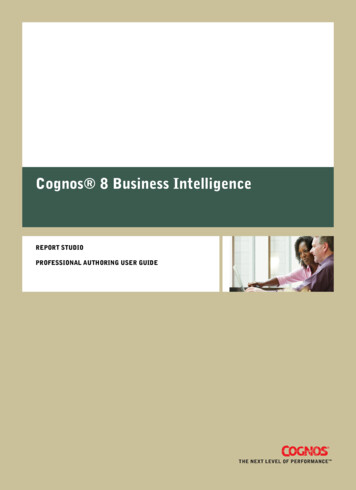
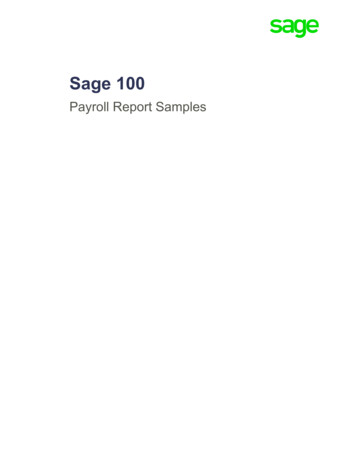
A P C O H O R T D ATA G R A D U AT I N G C L A S S O F 2 016National AP Participationand PerformanceOver the last 10 years, the national percentage of all U.S. public high schoolgraduates who took an AP Exam during high school has grown steadily, ashas the percentage of all U.S. public high school graduates who scored a 3or higher on at least one AP Exam.Within the graduating class of 2016: 1,136,792 U.S. public high school graduates took at least one AP Exam. 688,377 of those graduates scored a 3 or higher on an AP Exam.AP Participation and PerformanceWithin the Class of 2016In the class of 2016, 36.2% of students took an AP Exam during high school,up from 22.9% of the class of 2006. Also, 21.9% of the class of 2016 scoreda 3 or higher on at least one AP Exam, up from 14.3% of the class of 2006.6This increase reflects the hard work of teachers and students, as well asa commitment from states and districts to provide students with greateraccess to academic opportunities. Figure 1 shows the percentage of all U.S. public high school studentsin the class of 2016 who scored 3 or higher on an AP Exam during highschool, by state. These data show the degree to which students areparticipating in AP Exams and are achieving success. Figures 2a and 2b reveal the progress states have made over one,three, five, and 10 years toward ensuring that their students have theopportunity and preparation to succeed in AP. Figure 3 shows the score distributions, by state, for AP Exams takenby students in the class of 2016 throughout their time in high school.6. Due to changes in the U.S. public school list and recent updates to the Western Interstate Commissionfor Higher Education (WICHE) projection of high school graduates, AP Cohort Data Report figures shouldnot be compared to those in previous reports.12
G R A D U AT I N G C L A S S O F 2 016 A P C O H O R T D ATAFIGURE 1Percentage of the Class of 2016 Scoring a 3 or Higher on an AP Exam During High iforniaVirginiaNew YorkColoradoNew GeorgiaMinnesotaUNITED STATESMaineNorth CarolinaTexasNew HampshireMichiganDelawareSouth CarolinaRhode oAlaskaArizonaHawaiiDistrict of ColumbiaIowaSouth DakotaAlabamaMontanaNew MexicoIdahoTennesseeOklahomaWyomingMissouriWest VirginiaKansasNebraskaNorth %WHAT DO THE DATA SHOW?21.9%of U.S. public high schoolgraduates scored a 3 orhigher on an AP Exam duringhigh school.31.0%of public high schoolgraduates in Massachusettsscored a 3 or higher on an APExam, leading the nation.NATIONALAVERAGE21.9%Raw numbers for this figure are available in the Appendix. States with a tie in the rankings are listed alphabetically.13
A P C O H O R T D ATA G R A D U AT I N G C L A S S O F 2 016FIGURE 2APercentage of the Classes of 2006, 2011, 2013, 2015, and 2016 Scoring a 3 or Higheron an AP Exam During High School, by State, Ranked by the 10-Year Percentage PointChange Appearing in Figure 2b2006MassachusettsConnecticutFloridaIllinoisRhode IslandMinnesotaNew aOregonPennsylvaniaUNITED STATESAlabamaNew HampshireVirginiaOhioNew YorkVermontArizonaMaineTexasIowaDistrict of ColumbiaMissouriSouth CarolinaNebraskaLouisianaWyomingDelawareWest VirginiaNorth CarolinaSouth DakotaTennesseeAlaskaUtahKansasNew MexicoMontanaIdahoMississippiNorth DakotaOklahomaPercentage of Graduating 1.211.811.714WHAT DO THE DATA SHOW?Marylandhad the highest percentage ofpublic high school graduatesscore a 3 or higher on an APExam in four of the five yearsshown—2006, 2011, 2013,and 2015.Massachusettshad the highest percentage ofpublic high school graduatesscore a 3 or higher on an APExam in 2016.Due to changes in the U.S. public school listand recent updates to the Western InterstateCommission for Higher Education (WICHE)projection of high school graduates, APCohort Data Report figures should not becompared to those in previous reports.Raw numbers for this figure are available in theAppendix. States with a tie in the rankings arelisted alphabetically.
G R A D U AT I N G C L A S S O F 2 016 A P C O H O R T D ATAFIGURE 2B1-Year, 3-Year, 5-Year, and 10-Year Change in the Percentage of Graduates Earning a 3 orHigher on an AP Exam During High School, by State, Ranked by the 10-Year PercentagePoint sRhode IslandMinnesotaNew aOregonPennsylvaniaUNITED STATESAlabamaNew HampshireVirginiaOhioNew YorkVermontArizonaMaineTexasIowaDistrict of ColumbiaMissouriSouth CarolinaNebraskaLouisianaWyomingDelawareWest VirginiaNorth CarolinaSouth DakotaTennesseeAlaskaUtahKansasNew MexicoMontanaIdahoMississippiNorth 27.76.21.23.45.811.01.94.37.010.81.24.26.610.3WHAT DO THE DATA usettshad a 12.2-point increase over 10years in the percentage of publichigh school graduates earning a 3or higher on an AP Exam, leadingthe nation. The state also hadthe largest five-year increase.Nevadahad both the largest three-yearincrease and one-year increase inthe percentage of public high schoolgraduates earning a 3 or higher on anAP Exam.7.6 point increasesince 2006 in the percentage of U.S.public high school graduates scoring3 or higher on an AP Exam.0.6 point increasesince 2015 in the percentage of U.S.public high school graduates scoring3 or higher on an AP Exam.Raw numbers for this figure are available in the Appendix.States with a tie in the rankings are listed alphabetically.15
A P C O H O R T D ATA G R A D U AT I N G C L A S S O F 2 016FIGURE 3Score Distributions of AP Exams Taken by the Class of 2016 During High School, by StateScore of 1StateScore of 2No.of 2,9662,5713,801,414Score of 4Score of 5% of Exam loradoConnecticutDelawareDistrict of kaNevadaNew HampshireNew JerseyNew MexicoNew YorkNorth CarolinaNorth DakotaOhioOklahomaOregonPennsylvaniaRhode IslandSouth CarolinaSouth est VirginiaWisconsinWyomingUNITED STATESScore of 19.625.1 18.129.418.8 5.418.9 11.120.8 12.3 421.029.225.814.8 17.234.628.114.723.411.214.422.425.014.119.0 10.920.915.823.528.517.3 9.613.55.227.728.224.316.215.4 9.223.025.123.620.3 11.022.329.211.918.315.8 8.517.6 10.112.813.416.7 .7 12.127.719.0 9.825.015.0 8.530.124.224.717.024.520.719.5 11.5 6.327.621.123.723.614.217.7 10.232.221.2 .817.8 311.721.122.620.5 12.917.619.2 11.031.526.521.415.614.2 6.523.3 11.917.9 9.814.7 122.726.320.213.727.911.615.420.880%20.7 12.3 8.3 6.531.113.560%20.2 11.1 5.928.722.923.313.3 7.221.429.129.029.923.01624.714.423.717.2 8.418.9 12.614.1*Due to rounding,percentages do not alwaysadd up to 100.0.
G R A D U AT I N G C L A S S O F 2 016 Opportunity for All StudentsA
In fall 2016, AP launched its newest course: AP Computer Science Principles (AP CSP). AP CSP was designed to broaden the invitation to computer science, especially to students who are traditionally underrepresented . in the computer science ield. Over 2,500 schools are ofering AP CSP in its irst year, making it the largest