Transcription
Key Performance Indicators for safe fluid interactions withinautomated vehiclesMarios Sekadakis1, Christos Katrakazas1*, Erika Santuccio2, Peter Mörtl2,George Yannis11National Technical University of Athens, Department of Transportation Planning and Engineering,5 Heroon Polytechniou str., GR-15773, Athens, Greece2Virtual Vehicle Research GmbH, Inffeldgasse 21/A, 8010 Graz, Austria* Email: ckatrakazas@mail.ntua.grAbstractThis study attempts to identify critical Key Performance Indicators (KPIs) to assess the safety and general impactof fluid interactions between the user and Human Machine Interfaces (HMIs) within automated vehicles. Morespecifically, safety, driving performance, and general impact indicators were considered for such an assessment.The identification of KPIs was based on a literature review, previous knowledge obtained from similar researchprograms and a hazard identification process. The derived KPIs were categorized into two main categories, namelysafety and general impact, and these categories were distinguished in 11 additional subcategories. The most criticalKPIs within the safety group were found to be take-over time as well as the number of take-overs, whereas comfort,the feeling of safety and trust were the most crucial impact-related KPIs. Nevertheless, validation of those KPIs infield trials is, however, deemed necessary.Keywords: Automated Vehicles, Human Machine Interface - HMI, Safety and Impact Assessment, KeyPerformance Indicators - KPIsΠερίληψηΑυτή η εργασία επιχειρεί να εντοπίσει Βασικούς Δείκτες Απόδοσης (KPIs) ώστε να αξιολογήσει την ασφάλειακαι τη γενική επίπτωση των αδιάλειπτων αλληλεπιδράσεων, μεταξύ του επιβάτη και μίας Διεπαφής ΑνθρώπουΜηχανήματος (HMI) στα πλαίσια ενός αυτόνομου οχήματος. Πιο συγκεκριμένα, δείκτες ασφάλειας, οδικήςεπίδοσης και γενικών επιπτώσεων συμπεριλήφθηκαν για την αξιολόγηση. Προκειμένου να εντοπιστούν οι δείκτεςKPIs, πραγματοποιήθηκε βιβλιογραφική ανασκόπηση, διερευνήθηκε η υφιστάμενη γνώση από παρόμοιαερευνητικά προγράμματα και εκτελέστηκε μια διαδικασία αναγνώρισης κινδύνου. Έπειτα, οι δείκτεςκατηγοριοποιήθηκαν σε δύο κύριες κατηγορίες, αυτούς που αφορούν την ασφάλεια και εκείνους που αφορούντην γενική επίπτωση. Οι πιο κρίσιμοι δείκτες εντός της κατηγορίας που αφορά την ασφάλεια είναι ο απαιτούμενοςχρόνος μεταξύ αυτόνομης και μη αυτόνομης οδήγησης καθώς και η συχνότητα των φορών που απαιτήθηκε, ενώστην ομάδα των γενικών επιπτώσεων, η άνεση, η αίσθηση ασφάλειας και η εμπιστοσύνη. Ωστόσο, κρίνεταιαπαραίτητη η επαλήθευση αυτών των Βασικών Δεικτών Απόδοσης (KPIs) σε δοκιμές πεδίου.Λέξεις Κλειδιά: Αυτόνομα οχήματα, Διεπαφή Ανθρώπου-Μηχανήματος, Αξιολόγηση Ασφάλειας και Επιπτώσεων,Βασικοί Δείκτες Απόδοσης-1-
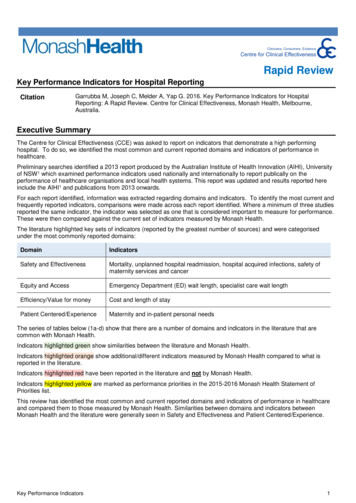
1. IntroductionConnected and Automated Vehicles (CAVs) are expected to dominate the market share in 2050,if the CAV prices decrease at an annual rate of 15% or 20% (Talebian & Mishra, 2018). Asroad fatalities claim approximately 1.35 million deaths per year (WHO, 2020), assessing thelevels of safety during conventional and automated driving (AD) becomes essential formitigating road fatalities and injuries. Towards that end, the automobile industry aims to reachthe absolute goal of SAE level 5, fully automated vehicle (AV), which requires no human input(SAE, 2016). It is important, however, to assure high levels of trust amongst users in order toachieve higher acceptance and consequently higher penetration rates in the market share(Manchon et al., 2020).With regards to the positive impact of CAVs on passengers and drivers, a significant proportionof the population, such as the elderly, children, and disabled will have the opportunity tocommute in contrast to conventional vehicles. Additionally, the passengers or even the driverwill be able to execute non-driving related tasks (NDRTs) during driving, e.g., working on anelectronic device, eating, drinking, reading, watching entertainment content, and texting orcalling on their phones (Kim et al., 2018).At the intermediate SAE automation levels prior to the highly automated (i.e., SAE levels 2, 3),the driving task will still require human inputs and interventions. Human Machine Interfaces(HMIs) are expected to play a key role between user-vehicle interaction. To that aim, HumanMachine Interfaces (HMIs) could support the calibration of trust, which is an essentialrequirement for safe and comfortable operation (Carsten & Martens, 2019) of CAVs. The roleof HMI is to make humans understand what is expected of them in terms of environmentmonitoring and active intervention (Carsten & Martens, 2019). Nevertheless, the HMI shouldalso be designed in order to understand the required interaction and if it is in line with thedriver's state. Otherwise, the safety level will be negatively affected by driving requirementsthat the driver could not handle appropriately due to the incorrect recognition of the driver'sstate.It is essential to develop a “safer” automated vehicle with a seamless HMI, which will assist inreducing and delimiting human errors during driving. In this context, by developing acomprehensive assessment, opportunities are created to evaluate the effect of new HMIs onsafety as well as their general impact. This paper attempts to identify critical KPIs that arecapable of assessing the safety and general impact of fluid interactions between the user andthe HMI within automated vehicle applications. The exported KPIs can contribute to guidefurther research in this direction, and additionally can be exploited and expanded to otherautomated technologies and systems.The work included in this study was conducted within the EU H2020 HADRIAN project, whichaims at developing an innovative HMI (titled as fluid-HMI or f-HMI) that will provide seamless(“fluid”) interactions between the driver and the automated vehicle. The project is based onthree use cases (or mobility scenarios), which are illustrated in Figure 1. The three use casesconsist of an elderly driver, a truck driver, and an office worker driver, each of which hasdifferent mobility needs and requires special conditions in terms of driving performance.-2-
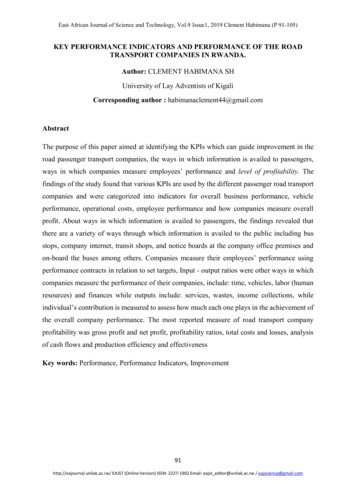
(a)(b)(c)Figure 1: The HADRIAN use cases: (a) Elderly (b) Truck (c) Office Working DriverThe paper is structured as follows; after the introduction, the methodology follows, includingthree main subsections. The first presents the initial step of the methodological framework ofthe safety and impact assessment framework of HADRIAN, part of which is the identificationof KPIs. The second describes the KPIs derived from the literature review and they wereincluded in the development of the KPIs list. The third presents a brief example of theaforementioned methodological approach. After that, results are presented in terms of findingswhich structures the final list of the KPIs. Results are followed by the study limitations andthen, conclusions for relevant stakeholders are drawn.2. MethodologyFirstly, the methodological approach is presented briefly with the aim to understand thestructure of the study, as the study is structured according to the flow of the methodologicalapproach. Figure 2 represents the methodological approach of the safety assessment withinHADRIAN. Specifically, the HADRIAN framework sets the parameters (i.e., levels ofautomation and innovations) and use cases by framing the desired driving scenarios or tasks.Each driving tasks consist of description and subtasks. The driving tasks consist of all thenecessary descriptions and elements in the driving scenarios in which the HADRIAN projectaims to test its innovations. An analysis named hazard identification, considering the drivingsubtasks description, revealed the risk factors which were potentially present during the drivingscenarios. In the subsequent phase, relevant KPIs were identified with the purpose ofquantifying the potential risk factors within the driving scenarios and considering existingknowledge from literature (i.e., literature review KPIs). To this point, the list of KPIs wasconcretized and it was designed to be applied within the HADRIAN project by measuring twodifferent scores i) the real-time score and ii) the post-trip score. In the final phase of theassessment, a concrete total score is aimed to be evaluated in order to compare directly thesafety impact of HADRIAN system innovation to a baseline system.-3-
Literature BackgroundDriving Task AssessmentHADRIANframeworkTask DescriptionDriving reKPIsKPIsReal-time scoresPost-trip scoresTotal task scoreFigure 2: Assessing driving tasks within HADRIAN2.1 Hazard IdentificationThe hazard identification was conducted by identifying all possible hazards into the planneddriving scenarios that the HADRIAN HMI is tested. The driving scenarios consist of three usecases, namely an elderly driver, a truck driver, and an office worker driver, as mentioned before.Additionally, for each driving scenario, different HADRIAN innovations and differentautomation levels are tested.Hazard identification broke down the operational driving scenarios or tasks into severalsegments or subtasks. For all the segments, it was essential to define the different needs andhazards within the user’s driving system, such as driver’s and environmental sensing needs,user-centered interaction needs, and safety hazards. As a result, there was a breakdown of the-4-
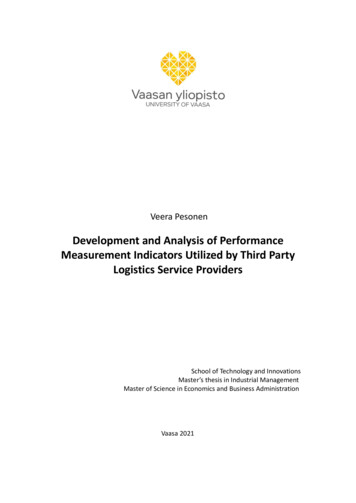
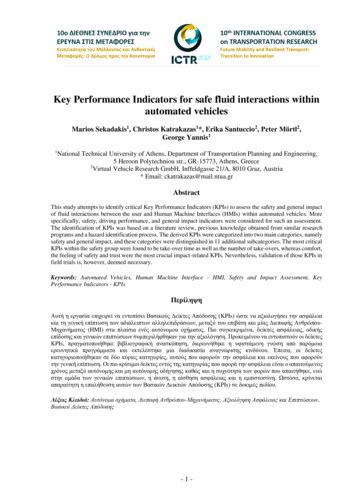
planned driving scenarios, and then the collected KPIs from the literature review (these KPIsare presented in 2.2) were associated in order to investigate if there were capable of assessingthe corresponding hazard or need. At this step, many KPIs derived from the literature reviewwere adapted to HADRIAN needs.For the whole safety and impact assessment, it is vital to explicate the assumptions andinnovations of the f-HMI, as they were used in the hazard identification procedure in order toidentify missing aspects within the assessment.Initially, the term “hazard” is the basis of hazard identification. Therefore, its meaning shouldbe analyzed, and hence a representative diagram was created, as shown in Figure 3. This aimsto investigate more profoundly each potential hazard in the driving scenarios by attempting tofind answers to the question “what causes the hazard?”. Each hazard consists of three basiccomponents: Hazardous Element: This is the basic hazardous resource creating the impetus for thehazard, such as a hazardous energy source such as explosives being used in the system. Initiating Mechanism: This is the trigger or initiator event causing the hazard to occur.This causes actualization or transformation of the hazard from a dormant state to anactive mishap state. Target and Threat: This is the person or thing that is vulnerable to injury or damage, andit describes the severity of the mishap event. This is the mishap outcome and theexpected consequential damage and loss.Figure 3: Hazard term explanationAfter the explanation of the hazard, the procedure of identifying how the hazard leads to amishap is explained. A mishap is an actual event that has occurred and resulted in death, injury,or loss. A hazard is a potential condition that can potentially result in death, injury, or loss. Thehazard triangle concept aims to conduct the best hazard recognition by evaluating each of itscomponents from a system context, as depicted in Figure 4. The state transition between ahazard and a mishap is the hazard triangle, including hazard components and risk factors.-5-
Figure 4: Hazard and Mishap relationThe study of the hazard components leads to the study of the hazard causal factors (HCF). HCFswere the basis of hazard identification. HCFs are all the specific items/elements responsible forthe presence of a hazard in the investigated system. The HCFs can be divided into categoriesaccording to the hazard components (i.e., humans, interfaces, functions, environment, etc.).Therefore, the term system should be explained thoroughly in order to recognize where thehazards can be met.For several years, the system concept includes only the interrelationship and collaborationbetween the vehicle and the HMI, as shown in Figure 5. On the contrary, in the HADRIANproject, the new system concept was included in the hazard identification as mentionedpreviously in order to identify relevant multiparametric KPIs on the several hazard components.The “new system concept” is illustrated in Figure 6. For each scenario segment and eachsystem element (i.e., the vehicle, HMI, etc.), different hazards were recognized in order to bequantified and subsequently assessed.Figure 5: Conventional concept of "system"-6-
Figure 6: New “system” conceptIn the hazard identification, in combination with the new system concept, the followingquestions were investigated among the driving subtasks, as illustrated in Figure 7: Vehicle Behaviour: What are the required capabilities of the AVs? Driver Role: What is the driver’s role inside the vehicle? Which are the expectedactions? Driver Sensing: What are the motoric and cognitive skills of the driver? Infrastructure: What are the infrastructure requirements in the driving environment? HMI features: How the communication between driver and vehicle establishes? Other vehicle behaviour: The vehicle is in a mixed or full autonomous environment?How are they behaving?The above questions lead to the below schematic diagram, which shows the elementsinvestigated in the hazard identification procedure and subsequently to the obtained KPIs.Figure 7: Investigated elements in hazard identification procedure2.2 Literature Review KPIsIn order to obtain KPIs that are relevant for the HADRIAN use cases and innovations that theproject envisions deploying, a literature review was conducted in order to exploit knowledgefrom previous projects. By exploiting previous project findings, identifying hazards, and-7-
focusing on the most crucial risk factors, the KPIs could be used to obtain a score capturing thesafety level as well as the general impact of the developed HMI and the innovations that arebrought about from the project.Initially with the purpose of identifying critical KPIs, a literature review was conducted. Itconsisted of two main steps: i) Literature review on existing KPIs derived from previousresearch projects, ii) Literature review on existing KPIs derived from generic drivingperformance and safety metrics. The first literature review focused on reports or deliverablesby various research programs with relevant knowledge on AVs safety assessment. The secondwas conducted using popular databases such as Google Scholar, Science Direct, and Scopusand using specific search terms. The literature review used prioritization criteria for studiespublished after 2010 and came mainly from Europe and the U.S.Looking at previous projects, three projects were deemed closer to the purposes of HADRIANand the use of KPIs. The first one was, the safety and impact assessment performed within theEU - US - Japan Trilateral project (Innamaa et al., 2017). Furthermore, the EU CARTRE projectapplied KPIs in order to quantify the impacts related to automated driving (Rämä et al., 2018),while the H2020 LEVITATE project applied KPIs in order to quantify the potential impacts onconnected and automated vehicles (Elvik et al., 2020).The reviewed KPIs derived from research programs were categorized into six categories: userrelated (which was separated to driving performance, user preference/perception), vehiclerelated, safety indicators, infrastructure or network-related, mobility-related, and widerimpacts. The criterion of categorization was to create solid categories taking into account aswell the elements in the aforementioned new system concept. For instance, a dedicated categorywas created for the vehicle itself, the user, infrastructure or network, etc. Therefore, each KPIwas categorized depending on this criterion. Table 1 includes the entire list of the obtainedKPIs. Amongst the KPIs, there were KPIs that required a subjective answer from users orindividuals (e.g., Safety Feeling, Intend to use, Trust of AVs, etc.), and a Likert scale wasapplied to evaluate these KPIs.Table 1: Reviewed KPIs of the research projects along with their descriptionKPIscategoryUser-relatedKPIs descriptionDriving performance: Number of take-over instances1 Usage of automated driving functions1, 2 Average and maximum driving speed2 The 95th of percentile speed2 Reaction time2 Post encroachment time (PET) 2 Headway time2 Number of decelerations due to Vulnerable Road Users (VRUs) 2 Eco-driving: compare the actual driving with the optimal energy efficientdriving style2-8-
VehiclerelatedSafetyIndicatorsInfrastructureor NetworkrelatedMobilityrelatedUser preference/perception: Comprehensibility of the driving functions1 Safety Feeling1, 2 Type and duration of in‐vehicle activities1 User perception of travelling quality1 User perception of travelling reliability1,2 Adaptability to traffic conditions2 Required attention and concentration for driving2 Public acceptance and general feeling (i.e., reliable, safe, useful and purposeof the use)2 Trust of AVs2, 3 Perceived usefulness2 Perceived comfort2 Feeling of control of the overall situation2 Intend to use2 Number of take-over instances1 Mean and maximum take-over time1 Number of emergency decelerations1 Number of crashes1 Number of emergency take-over instances1 Number of conflicts encountered when the TTC (i.e., time to collision) isless than a predefined threshold1 The number of vehicles per hour through a particular road section orintersection, whenever available it can be normalized to the number of lanesand proportion of green lighting time1 Maximum road capacity for specific road sections1 Peak period travel time along a route1 Road capacity2, 3 Total or average travel time per road-km2, 3 Intersection capacity2 Congestion: Delays to traffic3 Infrastructure wear3 Infrastructure design: Equipping roads with technology for vehicle-toinfrastructure communication3 Parking space: Size of areas designated for parking3 Share of transport modes (e.g., car, bike, bus, etc.)1,2, 3, 4 Number of trips and trip type1, 2 Total duration and distance of trips1, 2, 3 Travelling at peak hours: Share of trips made during peak hours2 Travelling reliability: Subjective scale or share of trips completed withoutdelays or below a threshold2 Travelling comfort: Subjective scale2,3 Accessibility of lower density areas: the number of opportunities or activitysites available for people living in the low-density area within a particulartravel time or distance2-9-
Wider Impacts Valuation of time: Willingness-to-pay for reduced travel time3Vehicle operating cost: Direct cost for operating a vehicle3Vehicle ownership cost: The cost of buying and keeping a vehicle3Access to travel: The opportunity of taking a trip whenever and whereverwanted3Route choice3Vehicle ownership rate3Shared mobility: Sharing a vehicle with others on a trip-by-trip basis3Vehicle utilization rate: Share of time a vehicle is in motion (not parked);cabin factor (share of seats in use) 3Total distance travelled by active modes of transportation (i.e., walking andbicycle)2The proportion of people with improved access to health services2Improved access to recreation and other services2Social isolation: Lack of potential for interactions with other people(subjective or decrease in the number of potential interactions)2Number of injuries2, 3 and Type of injury (e.g., slight, severe)Type of conflict4Number of fatalities2Propulsion energy: Source of energy used to move vehicles3Energy efficiency: the rate of loss due to conversion of energy to heat ornoise3Vehicle emissions3Air pollution3Noise pollution: Number of individuals exposed to noise above a specifiedthreshold3Public health: Incidence of morbidity and mortality; subjectively ratedhealth state3Employment: Changes in the number of people employed in givenoccupations3Geographic accessibility: Time used to reach a given destination fromdifferent origins3Inequality in transport: Statistics indicating skewness in the distribution oftravel behaviour between groups according to social status3Commuting: distance of trips to and from work3Land use: Density of land use for given purposes (residential, industrial, etc.)3 Public finances: Income and expenses of the public sectorEU – US - Japan ITS Cooperation Project (Innamaa et al., 2017)2CARTRE project (Rämä et al., 2018)3LEVITATE project (Elvik et al., 2020)4Christoph et al. (2013)1- 10 -
2.3 Method ExampleA representative example was generated at the following table (Table 2) which explains theprocedure of methodological approach as it is explicated in the present section. The first columnincludes the driving task which was derived from the HADRIAN project, and it is a subpart ofthe driving scenarios in which the HADRIAN innovations are tested. After the driving task, ascan be seen in Figure 2, the driving task is separated into task description and driving subtasks.Exploiting the driving tasks, the hazards during driving were identified by the aforementionedhazard identification procedure. After the hazards recognition for each driving task, relevantKPIs, which are capable to capture the enhancement of HADRIAN innovations, were matchedconsidering the literature findings, as explained previously.Within hazard identification, a comprehensive investigation was carried out by recognizing allcomponents of the hazard, as illustrated in Figure 3. For each hazard, the hazardous element,initiating mechanism, and the target/threat were found. This aimed to investigate the transitionbetween the hazard and the mishap, as depicted in Figure 4. Furthermore, the identified hazardsof this procedure consider hazardous situations that can be encountered in the new systemconcept, i.e., vehicle, user, HMI, cooperative traffic, and infrastructure. The new systemconcept was described previously in Figure 6. The relevant KPIs consist of literature KPIs(related research projects, driving and safety metrics) and some of them adapted to HADRIANneeds, and additional KPIs were developed with the purpose of assessing the hazards that theliterature KPIs were insufficient. In the following section, the relevant KPIs are categorized andpresented in an extensive list.Table 2: An example of the Hazard Identification ProcedureDriving TaskTaskDescriptionDriving SubtasksHazardRelevant KPIsHarold (the elderlydriver) drives on ahighway at SAELevel 3. As the endof the automateddriving is estimated,the HMI signalsHarold to start totake over (startdriving manuallyagain). HMImonitors Haroldduring this time andtells him what to do(to check the speed,the events in front,etc.).TransitionADL 3 - Manual &anticipationof systeminformation The takeovertime might benot enough.The operatormight provokean accident. Take-overTime AccidentProbabilityAccidentSeverity LevelNumber ofCrashesNumber ofIncidentsTTCNumber ofHarshDecelerations Understandingthe signalscoming fromthe systemReacting tosystem signalsTransition intomanual mode The operatormight get offthe road.- 11 - Time-to-LineCrossing(TLC)
Driving TaskTaskDescriptionDriving SubtasksHazardRelevant KPIs The operatormight feeldisoriented. LateralDistanceVariationLateralAccelerationLane CrossingsNumber ofHard . Results3.1 KPIs groupingBefore merging the exploitable knowledge from literature and the KPIs that were obtainedthrough hazard identification, it was decided to group KPIs into two main categories, namelysafety and general impact as presented in Table 3. The safety group contains KPIs such asaccident or safety risk, driving safety threshold, driver’s state, driver’s emotions, drivingcondition, and driver’s health. Similarly, in the general impact group, the subcategories were:comfort, acceptance & usability, trust, reliability, and accuracy.SafetyTable 3: Subcategories of safety and impact KPIsKPIssubcategoryAccident or SafetyRiskDriving SafetyThresholdDriver’s StateDriver’s EmotionsDriving ConditionDefinitionMeasurements that indicate risky or dangerous situations during driving.Specific driving thresholds which may indicate that the driver is in arisky moment.Driver’s special condition or state at a particular time (e.g., frustration,mental workload).Driver’s strong feelings such as anger, stress, etc. that can potentiallyaffect the driving performance.Special external circumstances in the driving environment related to thedriving conditions might affect driving performance (e.g., rain, fog, etc.)- 12 -
General ImpactDriver’s HealthComfortAcceptance &UsabilityTrustReliabilityAccuracyIssues or impairments that are related to the driver’s health and mayaffect driving performance.Comfort is when the driver has a pleasant feeling of being relaxed.Acceptance is defined as the willingness of the driver to use the newHMI. Usability is the degree to which it is easy to use the new HMI.Trust is defined as believing that something is safe and reliable.Reliability refers here to the ability of the fluid interface to provideinterventions at least (%) of the time.Accuracy means that this intervention is appropriate at least (%) in thecase of an intervention carried out.3.2 Final list of considered KPIsThe final list of KPIs was included in Table 4. Along with the description of the KPIs, the typeof required measurement data are defined as well as the corresponding units.Table 4: Final KPIs list for safety and impact assessmentKPIAccidentProbabilityAccident SeverityLevelNumber of CrashesNumber ofIncidentsTTCNumber of HarshDecelerationsNumber ofPedestrian IncidentsNumber of CyclistsIncidentsNumber of HardShoulder usageNumber ofUnexpected TakeoversKPI DescriptionAccident or Safety RiskAccident probabilityAccident severity level regarding thefollowing categories: a)Non-Injury, b)MinorInjury, c)Major Injury, d)FatalNumber of crashes in total or per kmNumber of incidents in total or per km(excluding crashes)Number of times when TTC (time tocollision) is below 1 secNumber of hard brakings (harshdecelerations) in total or per km (or hour)Number of instances when not reacting to apedestrian appropriately (% of all pedestriansevents)Number of instances when not reacting to acyclist appropriately (% of all cyclists events)Number of instances using the hard shoulderNumber of unexpected take-overs due tounexpected events (in total or per km)Driving Safety Threshold- 13 -Type CategoricalCountCountCountCountCountCount
KPIKPI DescriptionBrake ReactionTimeTake-over TimeBrake reaction timeReaction TimeReaction time in general (excluding brakingsituation; e.g., accelerating when the trafficlight turns greens)Headway Time between the front and thefollowing vehicle passing the same point.Time to Collision: “The time until a collisionbetween the vehicles would occur if theycontinued on their present course at theirpresent rates.” (Mahmud et al., 2017).Time-to-Accident: “the time that remains toan accident from the moment that one of theroad users starts an evasive action if they hadcontinued with unchanged speed anddirections” (Mahmud et al., 2017).Margin to Collision: “Ratio of the summationof the inter-vehicular distance and thestopping distance of the preceding vehicledivided by the stopping distance thefollowing vehicle.”(Mahmud et al., 2017).Crash Potential Index: “Probability that agiven vehicle Deceleration Rate to Avoid aCrash (DRAC) exceeds its maximumavailable deceleration rate (MADR) during agiven time interval.” (Mahmud et al., 2017).Time Integrated TTC: “Integral of the TTCprofile during the time it is below thethreshold” (Mahmud et al., 2017).Post encroachment time (PET): “The timebetween the moment that a road user(vehicle) leaves the area of a potentialcollision and the other road user arrivescollision area.” (Mahmud et al., 2017).Time-to-line crossingHeadway TimeTime to CollisionTime-to-AccidentMargin to Collision(MTC)Crash PotentialIndex (CPI)Time IntegratedTTC (TIT)Post EncroachmentTime (PET)Time-to-LineCrossing (TLC)Lateral DistanceVariationLateralAccelerationLane CrossingsDuration of take-overs (in total or per km)Lateral position variation (st. dev. of distancefrom the center of the lane)Acceleration in general and during lanechangeNumber of lane crossings- 14 -Type M/S2Categorical
KPIKPI DescriptionDistractionCount and duration of observations that thedriver had involved in a distraction task(distinguished for each type) orDistraction measurement with an eye trackerMotion sickness test: 4 point SimplifiedSimulator Sickness Questionnaire (SSSQ)Feeling of frustration (rated by a Likert scale,i.e., 1–9, low–high) or NASA Task LoadIndex (NASA-TLX) orFrustration test: Posture information (withdistance sensors) or facial expressionsMental workload: NASA Task Load Index(NASA-TLX) or Likert ScaleInattention: question with Likert-type scale(0-10)Quality of drivers reaction to a take‐overrequestDriver’s EmotionsFeeling of impatience (rated by a Likertscale, i.e., 1–9, low–high)Feeling of aggressiveness rated by a Likertscale, i.e., 1–9, low–high or Propensity forAngry Driving Scale (PADS), Driving AngerScale (DAS), Driving Anger ExpressionInventory (DAX), Trait-anger (T-Ang), Australian Propensity for Angry Driving Scale(Aus-PADS)The feeling of boredom (rated by a Likertscale, i.e., 1–9, low–high)Feeling of stress (rated by a Likert scale, i.e.,1–9, low–high)Stress measured with Heart Rate Variability(HRV), Electrocardiograph (ECG), Heart ratevariability
- 1 - Key Performance Indicators for safe fluid interactions within automated vehicles Marios Sekadakis 1, Christos Katrakazas *, Erika Santuccio2, Peter Mörtl2, George Yannis1 1National Technical University of Athens, Department of Transportation Planning and Engineering, 5 Heroon Polytechniou str., GR-15773, Athens, Greece