Transcription
East African Journal of Science and Technology, Vol.9 Issue1, 2019 Clement Habimana (P 91-105)KEY PERFORMANCE INDICATORS AND PERFORMANCE OF THE ROADTRANSPORT COMPANIES IN RWANDA.Author: CLEMENT HABIMANA SHUniversity of Lay Adventists of KigaliCorresponding author : habimanaclement44@gmail.comAbstractThe purpose of this paper aimed at identifying the KPIs which can guide improvement in theroad passenger transport companies, the ways in which information is availed to passengers,ways in which companies measure employees’ performance and level of profitability. Thefindings of the study found that various KPIs are used by the different passenger road transportcompanies and were categorized into indicators for overall business performance, vehicleperformance, operational costs, employee performance and how companies measure overallprofit. About ways in which information is availed to passengers, the findings revealed thatthere are a variety of ways through which information is availed to the public including busstops, company internet, transit shops, and notice boards at the company office premises andon-board the buses among others. Companies measure their employees’ performance usingperformance contracts in relation to set targets, Input - output ratios were other ways in whichcompanies measure the performance of their companies, include: time, vehicles, labor (humanresources) and finances while outputs include: services, wastes, income collections, whileindividual’s contribution is measured to assess how much each one plays in the achievement ofthe overall company performance. The most reported measure of road transport companyprofitability was gross profit and net profit, profitability ratios, total costs and losses, analysisof cash flows and production efficiency and effectivenessKey words: Performance, Performance Indicators, Improvement91http://eajournal.unilak.ac.rw/ EAJST (Online Version) ISSN: 2227-1902 Email: eajst editor@unilak.ac.rw / eajscience@gmail.com
East African Journal of Science and Technology, Vol.9 Issue1, 2019 Clement Habimana (P 91-105)misinterpretation, myopia, narrow focus,etc (OECD, 2008).IntroductionPerformance indicators are a numericalFinally, performance indicators must bemeasure of the degree to which an objectivetaken and used for what they are, i.e. ais being achieved. Performance indicators,snapshot of performance in time. They doby definition, are not exact measures ofnot provide a guide to future performanceperformance but “indicate” the level ofperformanceregardingthenor do they explain why a target has beenoverallachieved”.objectives agreed upon. They are practicalEnvironmentattempts to improve the quality andobtain a broader picture and a betterSpecific,understanding of the current situation and ofMeasurable, Achievable, Result-orientedactions to be taken to improve futureand Time-based. It might be useful also toperformanceensure that performance indicators are not“DUMB”,i.e.Dangerous,performance,from the entities concerned in order toperformance indicators is to make sure thati.e.ofinformation. They should seek feedbackcommonly used “tip” to build-up effective“SMART”,(SOE)Stateconsider other sources of formal or informalby focusing on key synthesis indicators. Aarereviewingshareholder entities should thus alsoconsistency of performance measurementtheyIn(OECD,2008;UKDepartment for Transport, 2010).Unethical,The UK Department for Transport (2010)Malleable and Biased (OECD, 2008).notes that the starting point for anyBadly chosen performance indicators mightbiastheincentivestructuresperformance improvement programmedandshould be to understand the currentconsequently have serious perverse effectsperformanceor unintended consequences. This will atingthemeans collecting data on key aspects ofyour operation, and turning this informationinto specific measures that can help inperformance of the SOE vis-à-vis ecompany’s/organization’s operation. Thisthe case when the performance indicatorsencourageofidentifying areas for improvement. Forbehavioursinstance, how much it costs to delivergaming,products to customers, how many miles thevehicles run empty or the number of late92http://eajournal.unilak.ac.rw/ EAJST (Online Version) ISSN: 2227-1902 Email: eajst editor@unilak.ac.rw / eajscience@gmail.com
East African Journal of Science and Technology, Vol.9 Issue1, 2019 Clement Habimana (P 91-105)deliveries registered in a given period.have an in-depth knowledge of the areaThesebeing measured (OECD, 1997)measuresareknownaskeyperformance indicators, or KPIs. A KPI onMeasurable: KPIs can show changes inits own will not tell much. Individualperformance over time. For this to happen itmeasures and data need to be turned intois essential to compare like-with-like datainformation that can help in decision(UK Department for Transport, 2010). It ismaking. This means setting a target, andeasy to fall into the trap of comparing twomeasuring and monitoring KPIs over adrivers on different routes for timeperiod of time to see how performanceutilization or miles per gallon (MPG). If onemeets the targets. Weekly, monthly androute is more demanding than the other, thisannual reports allow monitoring progresscould be misleading. Similarly, comparingand seeing which areas need the greatestdrivers when they drive vehicles ofimprovement. Producing graphs or chartssubstantially different age or vehicle typewill often be the best way of showingcan also be deceptive. There are ways toperformance progress.address these problems however, such asHowever, UK Department for Transportrotating drivers onto different vehicles and(2010) notes that there are a number ofdifferent routes and then monitoring boththings that can be considered before hand indriver and vehicle performance, to spotorder to decide which ones may be right forconsistently high and poor performers (UKthe entity. A KPI should be relevant and itDepartment for Transport, 2010).should also be SMART - Specific,Achievable: Any targets that are set shouldMeasurable, Achievable, Realistic andbe achievable. It may seem beneficial to setTimed.high targets in the hope that this leads toSpecificically, KPIs should be specific,greater improvements in performance, butsimple to use and easy to understand.people can become disillusioned when theyComplicated statistics and formulae cancontinually fall short of the targets set forlead to confusion and uncertainty aboutthem (UK Department for Transport, 2010).what is actually being measured in the firstRegularly reviewing performance towardsplace. If KPIs are specific and kept simple,targets and then resetting the targets tothey can be easily communicated across theencouragebusiness and there is no need for staff tocumulative) improvements may work muchsmallerincremental(butbetter in the long run.93http://eajournal.unilak.ac.rw/ EAJST (Online Version) ISSN: 2227-1902 Email: eajst editor@unilak.ac.rw / eajscience@gmail.com
East African Journal of Science and Technology, Vol.9 Issue1, 2019 Clement Habimana (P 91-105)Realistic: Remember that decisions andused to help managers develop strategy,management actions will be taken as a resultplan and make decisions, while at theof the data collected and presented, so theoperational level they can show clearly thedata collection method needs to be realistic,areas that need improvement, or a change inreliable and consistent. It is important thatapproach.the data required to produce the particularAn individual KPI can tell how well theKPI can be collected easily and on a regularcompany or organization is performing atbasis, as comparison over time forms thean operational level. However, when lookedbasis of benchmarking and then improvingperformance(UKDepartmentat in combination with other measures, aforpicture can be provided of how you areTransport, 2010).performing in terms of revenue andTimed: The frequency of monitoring is anprofitability and overall fleet efficiency, andimportantorin relation to customer service and legalmonthly monitoring is recommended forobligations (UK Department for Transport,many KPIs but this can depend on the2010).consideration.Weeklymeasure and the needs of a particularProblem statementbusiness (UK Department for Transport,2010). Some information may have to beRwanda is a landlocked country in the heartcollected on a daily basis, such as staffof Africa and far from the maritime ports onabsences in the warehouse, daily deliverythe Indian Ocean, with the distance to thedrops or nightly trucking volume. If certainnearest port of Dar es Salaam being aroundmeasures are not recorded and presented toone thousand four hundred kilometersthe agreed timescales, the risk of changes in(1,400 km). This poses a major limitation inperformance going unnoticed rises.its national development efforts (RwandaTransport Development Agency, 2012).Which KPI is Right for Me? To understandThe current state of transport infrastructurethe KPIs that are right for a company orin Rwanda may be attributed to theorganization, it is important to considergenocide of 1994 against the Tutsi, whichseveral factors such as the entity’s size, typedestroyed the economic infrastructure of theand management (OECD, 2008). The size,country considerably. This situation istype and management structure of aaggravated by other institutional problems,company is likely to influence the range andsuch as the absence of key performancetype of KPIs you might use. KPIs can beindicators for the performance of the sector,94http://eajournal.unilak.ac.rw/ EAJST (Online Version) ISSN: 2227-1902 Email: eajst editor@unilak.ac.rw / eajscience@gmail.com
East African Journal of Science and Technology, Vol.9 Issue1, 2019 Clement Habimana (P 91-105)institutionalweaknessesintheindicators that can improve the performanceperformance, as well as the absence of ain the road transport companies.strategy for maintenance of transportMethodinfrastructure (Rwanda Utilities RegulatoryThe study was conducted based onAuthority, 2013). There is a lack ofdescriptive design where quantitative anddiversification of the means and modes ofqualitativeenhancement of the performance in the roadinvolved.population is the totality of persons andsatisfaction, reliability, vehicle utilization,objects with which a study is concerned.revenue collections, safety of passengers,The target population was 600 made bydrivers, lack of practical applications ofprivate (350) and public (250) transportaccessibility analysis in transport appraisalcompanies. For this study, a sample size ofmethodologies is mainly due to concerns334 respondents was chosen; stratifiedabout double counting of effects (Geurs &sampling technique and simple randomvan Eck, 2001), the perceived complexity ofsampling were conducted during the datatheir formulations and their resulting(GeursareAccording to Williams et al (1990), studytransportation. The lack of passengerdifficulty of interpretationapproachescollection that cut across the public and&privateRitsema van Eck, 2003). Each of thecompanies.Selfadministeredquestionnaires were used to enable theformulations of accessibility is particularlyrespondents to have adequate time tosuited to address a certain transportrespond to the same set of questions in aplanning problem and the selection of thepredetermined order. A 5-point Likert scaleappropriate indicators for a particular caserangingis a complex task (UK Road Safetyfrom1-5where1(stronglydisagree), 2(disagree), 3Not sure), 4(agree),Authority, 2009). Studies done in Rwanda5(strongly agree) was used to gather data(MININFRA, 2008; 2012) have dwelt onfrom three transport companies of RITCO,the performance of the government ownedKBS, and Horizonpassenger road Transport Company and nostudies exist on how the key performanceFromKBSandHorizontransportindicators can improve the performance ofcompanies, 186 respondents were selectedroad transport companies in Rwandafrom the 350 total employees of KBS (211)(Niyonsenga, 2012). This study thereforeand Horizon (139) transport companies. Ofwas undertaken on the key performancethe 186 respondents from KBS andHorizon, 180 respondents were selected95http://eajournal.unilak.ac.rw/ EAJST (Online Version) ISSN: 2227-1902 Email: eajst editor@unilak.ac.rw / eajscience@gmail.com
East African Journal of Science and Technology, Vol.9 Issue1, 2019 Clement Habimana (P 91-105)2ndusing systematic sampling while six (6)everypersonwasselectedandrespondents were selected purposively. Toconsidered for the study (See Table 1.1).select 180 respondents, a list of 211 fromKBS, 139 from Horizon and 250 fromRITCOwereobtainedfromthesecompanies. For each of these company lists,Table 1.1: Sample size selectionCategoryof PublicrespondentsTransport Private Transport 660Supervisors10101434Sub Total14879107334Source: Field data 2013Questionnaire administration was used as atransport companies. The key informantsmethod of obtaining information on thewere interviewed because they are believedroad transport companies’ key performanceto possess deeper information about the keyindicators in Rwanda. In-depth interviewsperformance indicators of road transportwere held with the key informants;companies. The method was used because itmanagers, supervisors, directors of bothenabled the recording of opinions, andprivate and public road transport ctedfeelings of respondents regarding theIn-depthusingstudied phenomena (Yin, 2003). Secondaryandata were gathered using documentaryinterview guide as the tool in data ,(intermsreview. The sources of these documentsofwere both online sources especially Google,effectiveness,Google scholar, and physical reportsinput-output ratios et c) of the roadaccessed at Ministry of Infrastructure,96http://eajournal.unilak.ac.rw/ EAJST (Online Version) ISSN: 2227-1902 Email: eajst editor@unilak.ac.rw / eajscience@gmail.com
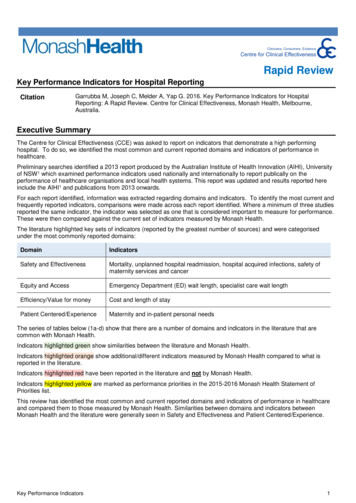
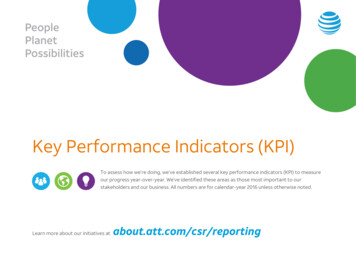
East African Journal of Science and Technology, Vol.9 Issue1, 2019 Clement Habimana (P 91-105)Rwanda Transport Development Agencyperformance reports, public transport policy(RTDA), KBS, HORIZON and RITCOand strategy for Rwandacompanies, National University of Rwanda,FindingsUniversity of Lay Adventist of Kigali andIdentify the KPIsthe documents included: sport companiesmanagerial strategy manuals, transportplanninginwhich can guideandTable 1.2: Key performance indicatorsKey Performance indicatorsRespondentsPublicPrivateClientsFrequency %Frequency %Frequency %Passenger satisfaction292026143417Level of customer information161124133115Reliability18122715189Cost of providing transport 1913291623111616920109009401692211servicesSafety of passengers and drivers 23and conductorsSize of the market shareTransportfaresrelative13to 0distance travelledVehicle utilization171115873Revenue collections13933182713I do not know0000147Total148100186100205100Source: Field data 2013Passenger satisfaction is one of the KPI thatimprovement in the management systems inwas found to be used by the road transportthe road transport companies as revealed bycompanies in measuring29 (20%) of the respondents belonging to97http://eajournal.unilak.ac.rw/ EAJST (Online Version) ISSN: 2227-1902 Email: eajst editor@unilak.ac.rw / eajscience@gmail.com
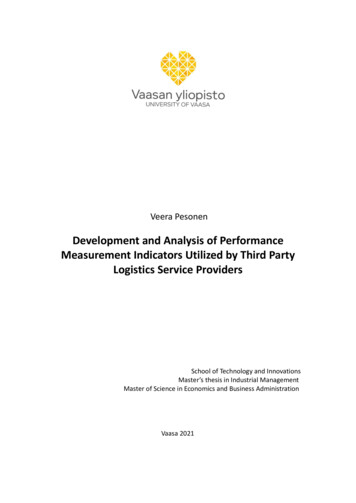
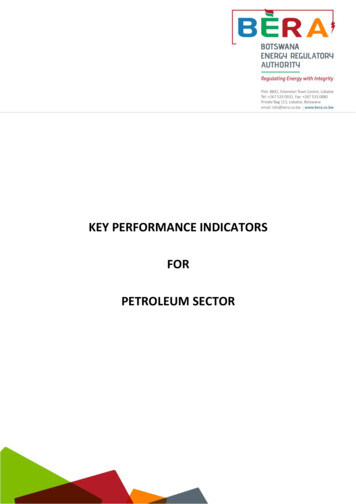
East African Journal of Science and Technology, Vol.9 Issue1, 2019 Clement Habimana (P 91-105)the public transport companies, 26 (14%) ofas reported by 23 (16%) of the respondentsthe private transport companies respondentsfrom the public transport companies, 16and 34 (17%) of the clients. The above(9%) of the respondents from the privateresults are supported by a study done bytransport companies and 20 (10%) of theFellesson and Margareta (2008) found thatrespondents belonging to the category ofattributesfrequency,clients. Accessibility and convenience werecomfort, information, driver behaviour, andonly reported by 13 (9%) of the publiccleanliness are key elements of publictransport company respondents and 9 (4%)transportofof the clients, Vehicle utilization was alsocustomer information as another KPI wasrevealed by 19% of the respondents as anreported by 16 (11%) of the respondentsindicator of an efficient transport service.from the public transport companies, 24The amount of revenue collected by the(13%) from the private transport companiescompany on daily, monthly and annualand 31 (15%) of the clients. Reliability asbasis is another KPI as reported by 13 (9%)another KPI reported by 18 (12%) of theof the respondents from the public transportrespondentspubliccompanies, 33 (18%) from the privatetransport companies, 27 (15%) from thetransport companies and 27 (13%) of theprivate transport companies n.belongingtoLeveltheand 18 (9%) of the clients. Transport faresWays in which information is availed tocharged by the transport companies relativepassengersto the distance involved and the cost offeredby other transport companies serves anThe ways in which information (whichimportant indicator of efficiency of the roadinformation – bus schedules, fares, routestransport company reported by 16 (9%) ofetc)the private transport companies respondentsdetermined from the 539 respondents thatand 22 (11%) of the clients. Safety waswere studied and the results are presented inanother KPI employed by the roadFigure 1.3.isavailedtocustomerswerepassenger transport companies in Rwanda98http://eajournal.unilak.ac.rw/ EAJST (Online Version) ISSN: 2227-1902 Email: eajst editor@unilak.ac.rw / eajscience@gmail.com
East African Journal of Science and Technology, Vol.9 Issue1, 2019 Clement Habimana (P 91-105)Pinned flyers in the buses: This servicewas reported to be common among all theTable 1.3: Ways in which information isbusavailed to passengerstransportcompaniesinRwandarevealed by 8 (5%) of the respondents fromThe findings revealed that there are athe public transport companies, 37 (20%)variety of ways through which informationfrom private transport companies and 47is availed to the public. Among them are:(23%) from the clients.bus stops, company internet, transit shops,and notice boards at the company officeCompany websites: The findings showedpremises and on-board the buses amongthat both private and public ngers via the websites revealed by 15On-board the bus: This was the commonly(10%) of the public transport companiesused method of availing information torespondents, 26 (14%) of the privatepassengers as revealed by 30 (16%) of thetransport respondents and 8 (4%) of thepublic transport respondents, 36 (14%) ofclientsthe private transport companies respondentsand 51 (25%) of the passengersBus stops: The study revealed that the allthe bus companies availed information via99http://eajournal.unilak.ac.rw/ EAJST (Online Version) ISSN: 2227-1902 Email: eajst editor@unilak.ac.rw / eajscience@gmail.com
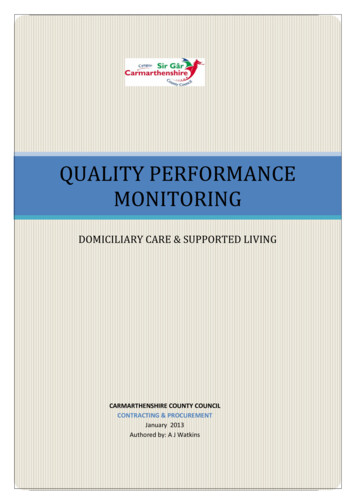
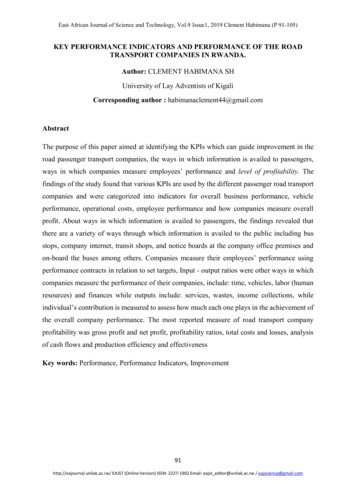
East African Journal of Science and Technology, Vol.9 Issue1, 2019 Clement Habimana (P 91-105)bus stops as reported by 17 (11%) of theRadio announcements: Announcementspublic companies respondents, 5 (3%) fromare run on the radios informing passengersthe private transport companies and 42of disruptions in the bus operations and as a(20%) of the clientsresult passengers are able to make informeddecisions regarding their travel plans.Printed time tables: The use of printedAnnouncementstime tables was reported by 19 (13%) of therespondentsfrompublicaswaysof availinginformation to passengers were reported bytransport11 (7%) of the public transport companiescompanies, 25 (13%) from the privaterespondents, 21 (11%) of the respondentstransport companies and 6 (3%) of thefrom the private transport companies and 11clients(5%) of the clientsWays in which companies measure employees’ performanceThe ways in which companies measure employees and company performance was askedstudied and the results are presented in Figure 1.4.100http://eajournal.unilak.ac.rw/ EAJST (Online Version) ISSN: 2227-1902 Email: eajst editor@unilak.ac.rw / eajscience@gmail.com
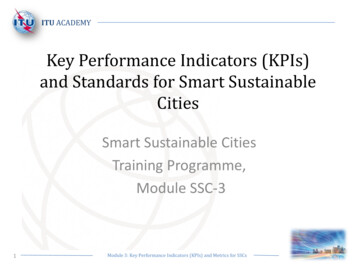
East African Journal of Science and Technology, Vol.9 Issue1, 2019 Clement Habimana (P 91-105)the private transport companies and 12 (6%)Table 1.4: Ways in which companiesof the clients as another way in whichmeasure employees’ performancecompanies measure their performanceThe findings revealed that of the 539respondents the majority who were 34Daily collections vs costs were revealed by(23%) from public transport companies, 4020 (14%) from the public transport(22%) from private transport companiescompanies, 23 (12%) from the privateand 36 (18%) of the clients revealed that thetransport companies and 44 (21%) of theroad transport companies measure theirclients. A study conducted by Levinson etemployees’usingal. (1998) revealed that bus performancesperformance contracts in relation to setdiffer from bus to bus. Another way intargetswhich companies measure employees’performanceperformance was by assessing companyInput - output ratios were other ways invehicle handling and condition relative towhich companies measure the performanceother vehicles as revealed by 13 (9%) of theof their companies as revealed by 23 (16%)public transport companies respondents, 10of the respondents from the public transport(5%) of the private transport companiescompanies, 41 (22%) from the privaterespondents and 31 (15%) of the clients.transport companies and 9 (4%) of theCommitment to work was reported by 13clients(9%) from the public transport companies,Individual contribution relative to the set18 (10%) from the private transporttargets was revealed by 10 (7%) from thecompanies and 34 (17%) of the clients as apublic transport companies, 34 (18%) fromway of measuring employees’ performanceWays in which companies measure level of profitabilityThere was a mix of ways in which companies measure the levels of profitability and these arepresented in the Table 1.5.101http://eajournal.unilak.ac.rw/ EAJST (Online Version) ISSN: 2227-1902 Email: eajst editor@unilak.ac.rw / eajscience@gmail.com
East African Journal of Science and Technology, Vol.9 Issue1, 2019 Clement Habimana (P 91-105)Table 1.5: Ways in which companies measure level of profitabilityMeasures of cPercentagyeyeGross profit vs net profit41284424Total costs30203619Business growth and development over 19132111timeProfitability ratios107137Analysis of Cash Flows139126Production efficiency and effectiveness 19132715Total losses16113318Total148100186100Source: Field data 2013The most reported measure of roadwhich companies measure their profitabilitytransport company profitability was grossas revealed by 16 (11%) of the respondentsprofit vs net profit as revealed by 41 (28%)from the public transport companies and 33of the respondents from public transport(18%)companies and 44 (24%) of the privatecompanies. Analysis of cash flows wastransport companies. The second mostreported by 13 (9%) of the respondents fromreportedcompanythe public transport companies and 12 (6%)profitability as revealed by 30 (13%) of thefrom the private transport companies asrespondents from the public transportanother way in which companies measurecompanies and 36 (19%) of the privateprofitability of road transport companies.transport companies was total costs. TotalProduction efficiency and effectiveness alsolosses were also reported as another way inmeasures the company’s profitability ournal.unilak.ac.rw/ EAJST (Online Version) ISSN: 2227-1902 Email: eajst editor@unilak.ac.rw / eajscience@gmail.com
East African Journal of Science and Technology, Vol.9 Issue1, 2019 Clement Habimana (P 91-105)revealed by 19 (13%) of the respondentscollections per route and trip schedules tofrom the public transport companies and 27determine the routes that are viable and the(15%)transporttrips which are viable and the causes ofcompanies. Profitability ratios were anothervariations in collections for managementway by which companies measure theirdecision making. Based on this information,profitability as reported by the least numbermanagement decisions can be made for theof respondents 10 (7%) from the publicbesttransport companies and 13 (7%) from theAlthoughprivate transport companies who weretransport companies was used, it waslargely accountants, cashiers and otherlargely more helpful in the private transportemployees with a background in businesscompanies as opposed to the icbythetransportcompanies were found to operate on routesConclusion and recommendationsthat are not profitable since one of theirAs objective was to identify the keymandates is to provide passenger servicesperformance indicators that can guide theon certain routes regardless of whether theimprovement in performance of the roadroutes are profitable or not. Revenuetransport companies in Rwanda. Passengercollections by the transport companies wassatisfaction was the commonly used KPI toanother KPI that was considered vital inguide improvement in the performance ofimproving the performance of the roadthe road transport companies in Rwanda.transport companies in Rwanda. AccordingPassenger satisfaction is considered theto the respondents, daily, weekly, monthlyheart of the transport business and all effortsand annual revenue collections are verywere therefore made to ensure customerimportantsatisfaction.passengerimprovement in the performance of thesatisfaction data through periodic passengercompanies. Cost of providing the transportsurveys should be an integral part of theservices was also an important KPI in thecompanies.operations of the road transport ompanies’determinesindicatorsthatguidetheThis is implemented by analyzing the costsroyalty of passengers which is associatedinvolved in providing passenger transportwith revenue collections by the transportservices on different routes operated by thecompanies. A trend analysis can becompanies. Assessment of the costs is madeconducted of these routes by comparing thebased on the revenues generated and the103http://eajournal.unilak.ac.rw/ EAJST (Online Version) ISSN: 2227-1902 Email: eajst editor@unilak.ac.rw / eajscience@gmail.com
East African Journal of Science and Technology, Vol.9 Issue1, 2019 Clement Habimana (P 91-105)potential of the route for increased numberssafety of the clients and employees does notof passengers. Using this indicator theonly depend on analyzing the safety of thepresent and future performance of thetravelers but rather on other factors such ascompany is computed and estimated. It wasavailability of funds. It is possible for somehowever found that the public transportcompanies to start operations on certaincompanies did not consider this indicator onroutes and they immediately implementcertain routes due to its mandate oftravelers’ safety measures.providing transport services in at below theReferencesmarket rates in areas which are not servedby private transport companies. This hasFellesson, M. & Margareta, F. (2008).kept the company’s costs high compared toPerceiveditsbreedingTransport Service in Nine European Cities.inefficiency in service delivery. Safety ofJournal of the Transportation Researchthe passengers and company staffs wasForum, Vol. 47, No. 3, pp. other important KPI used by the roadGeurs, K. T., & Rirsema van Eck, J.R.transport companies in Rwanda to guide(2001).their performance. Safety of the passengersAccessibilitymeasures:review and applicatons. RIVMand company staffs is determined byreportanalyzing the frequency of accidents by the408505006.NationalInstitute of Public Health and thecompanies’ buses, the extent of theEnvironment, Bilthoven.casualties determined by analyzing theGeurs, K. T., & van Eck, R. (2003).number of people who die and are injuredAccessibility evaluation of land useduring the accident and the extent ofscenarios:damage of the buses. A company whosethecompetition,buses are frequently involved in accidentsimpactlandofjobuseandinfrastructure developments for thecannot in any way be considered to beNetherlands.performing better. It should also be notedEnvironmentandPlanning 30 (1), 69 – 87.that transport companies which put effort inanalyzing the safety of the passengers andLevinson, D.M., Gillen, D. & Kanafani, A.their staff are in most cases more likely to(1998). The social costs of intercityinstitute measures to enhance the safety oftransportation:their clients and employees. Nevertheless,comparison of Air and Highway”.areviewinstituting the measures to enhance the104http://eajournal.unilak.ac.rw/ EAJST (Online Version) ISSN: 2227-1902 Email: eajst editor@unilak.ac.rw / eajscience@gmail.comand
East African Journal of Science and Technology, Vol.9 Issue1, 2019 Clement Habimana (P 91-105)Transport Reviews, Vol. 18, No. 3,coverage and service delivery in215-240).Rwanda.Niyonsenga, D. (2012). Assessing publictransportsupplyforUK Department for Transport. (2010).Kigali,PerformanceManagementforRwanda. MSc Thesis, Enschede,Efficient Road Freight Operations.The Netherlands.Retrieved from:OECD, (2008). Implementation guide rency in state ownership.uk/journals/tf/01441647.htFranceUK Road Safety Authority. (2009). Bus andOECD, (1997). Performance Indicators fortruck operators’ guide to managingthe Road Sector, Road Transportfor road saf
studies exist on how the key performance indicators can improve the performance of road transport companies in Rwanda (Niyonsenga, 2012). This study therefore was undertaken on the key performance indicators that can improve the performance in the road transport companies. Method The study was conducted based on