Transcription
International Journal of Technology and Inclusive Education (IJTIE), Volume 5, Issue 2, December 2016The Impact of Mobile Telecommunication Services on Students’ Lives:Findings from a Comparative Study in South Africa and NigeriaOmotayo Kayode Abatan1, Manoj Maharaj2University of South Africa1, University of KwaZulu-Natal2AbstractThe advancement in telecommunication networkand computer based communication is of greatimportance in global communications, especially onyoung adults that constitute the sample of the study.In most mobile telecommunication services, qualityis ascertained during the service delivery and notprior to the delivery of service making it to offervarious services that is of interest to young people.These services are used to create and maintainsocial interactions while also depending on it foreducational activities. This paper is based onempirical research to examine the impact of ation Technology (IT) students at Lagos StateUniversity (LASU), Lagos, Nigeria and University ofKwaZulu-Natal (UKZN) Durban, South Africa. Thestudy enables the understanding of the quality ofservices required to identify students’ experiencesand perceptions of mobile telecommunicationservices and the effect it has on their academic andsocial life.1. IntroductionMobile telecommunication is experiencing atremendous revolution that will change the world.Mobile telecommunication network will beeverywhere in such a way that computing willmigrate from the traditional desktop towardsconsumer-oriented computing using smart wirelesspersonal multimedia devices that will communicatewith each other [1]. Mobile telecommunicationservices have been available since the early 1960sand its diffusion was affected by technologicalinnovations such as transition from analogue todigital technology, competition within the industry,spectrum licensing and the harmonization to acommon technical standards [2].Mobile telecommunication technologies havedeveloped in successive generations which includesthe first generation (1G) technology, secondgeneration (2G) or Global System for Mobilecommunications (GSM) technology which ismassively used to date, the third generation (3G)technology that depends critically on theincorporation of multimedia services and the fourthgeneration (4G) technology that produce data rates ofCopyright 2016, Infonomics Society200 Mbps, [3]. Mobile phones have become aneveryday commodity for millions of people all overthe world and are being used more and more in themost developed and developing countries [4.]Telecommunication has transformed the worldinto a global village, it has resulted in profoundchanges within the social structure that rivals thosewithin the industrial revolution [5]. The role thatmobile telecommunication technology has played insocial relations has become increasingly important.The implementation of GSM standards has direct andindirect contribution to the global economic growth,it has contributed to the creation of new employmentopportunities and has enhanced the Gross DomesticProduct (GDP) of several nations [6]. Theseassumptions holds true for students in South Africa,Nigeria and elsewhere for that matter.This study draws from students’ articulation ofthe use of mobile telecommunications servicesacross mobile telecommunication networks in SouthAfrica and Nigeria. Students’ narratives of their useof mobile telecommunication services for academicand social activities foreground the importance ofthese services in students’ lives. Therefore, theresearch questions are broken down into three-folds:- What are the perceptions of first-year ITstudents in UKZN and LASU vis-à-vis mobiletelecommunication services in Durban and Lagos?- What effect does mobile telecommunicationservices have on first-year IT students’ academicendeavour?- What effect does mobile telecommunicationservices have on first-year IT students’ social life?In what follows, this paper discusses the modelsthat serve as the theoretical anchors for the study. Itthen presents the research method, including themode of data collection and analysis. Next, a nications narrows down into thedescription of the study’s findings in respect of firstyear IT students at UKZN and LASU. The rating ofthe quality of mobile telecommunication services onthe mobile telecommunication network. The paperthen presents the limitation of the study andconcludes with an argument for the integration ofmobile telecommunication services into teaching and820
International Journal of Technology and Inclusive Education (IJTIE), Volume 5, Issue 2, December 2016learning as well as creating awareness of the linkbetween the use of technology and life outcome.2. Conceptual frameworksTechnology Acceptance Model (TAM) is thetheory adopted for the study. “TAM is a theoreticalmodel that has been used to explain and predictuser’s behaviour in information technology” [7].TAM provides a foundation for identifying the effectof external variables on the internal values, attitudesand the intention to use technology [8]. According toTAM the attitude of users determines the intention touse technology and the intention eventuallyinfluences the actual use of such technology [9].However, Davis and Venkatesh deemphasize thesignificance of attitude as a determinant of the use oftechnology but argue that perceived usefulness andperceived ease of use are critical factors thatinfluence the use of technology [9].In addition to the factors mentioned above, theawareness of the availability of technology is crucialto determining the intention of using the technologyand the actual use of the technology. Theassumptions of TAM offer some utility to this study.Students’ behaviour in the form of their attitudes andintentions, perceived usefulness as well as perceivedease of use of mobile telecommunication servicesalso determine the actual use of the services. Furtherbacking to the theoretical framework adopted for thispaper was from Siragusa and Dixon who stated thatthe theory of planned behaviour is also used tounderstand people’s intention to engage in a numberof activities [10]. Some of the activities weredescribed in this study which includes the use ofmobile telecommunication services for academic andsocial activities. Therefore, the theory of plannedbehaviour presupposes that intentions to involve andrelate with a particular programme is achieved byattitudestowardsusinginformationandcommunication technology, supposed social pressureto do so and by perceived control over the interaction[11].The conceptual models (TAM and the theory ofplanned behaviour) are used to interpret the findingsof this study. The paper essentially extrapolates theassumptions of TAM. One of such assumptionspresupposes that the use of technology is a functionof the awareness of the existence and usefulness ofsuch technology by a potential or actual user. In thecontext of this study, the use of mobiletelecommunication services by first-year IT studentsis dependent on the awareness about the availabilityof such services.Students’ behaviour in the form of their attitudesand intentions, perceived usefulness as well asperceived ease of use of mobile telecommunicationservices also determine the actual use of the services.The attitudes and intentions of first-year IT studentsCopyright 2016, Infonomics Societytowards technology in general and mobiletelecommunications in particular are reflected intheir use of mobile telecommunication services foracademic and social activities. The academicactivities entail finding new information, informationsharing, research and the use of SMS to checkexamination results. Some of the social activitiesinclude keeping in touch with family, keeping intouch with friends, making new friends and usingdata services for social networking sites i.e.,Facebook.Therefore, there is a possibility of unpacking thepreferences of first-year IT students with reference tothe acceptance and the usage of tion of the assumptions of TAM.Furthermore, the theory of planned behaviourimplies that the intention to connect and relate with aprogramme or application has an effect on theattitudes directed at the usage of mobiletelecommunications services by first-year ITstudents.3. Methodology3.1. Population and samplingThe data for this paper was generated fromresearch conducted in 2011 amongst first-year ITstudents at the Westville-Durban campus of theUniversity of KwaZulu-Natal and Ojo-Lagos campusof the Lagos State University. The population offirst-year IT students in UKZN was estimated at 945and that of LASU was estimated at 950 based on the2011 student roll. The sample for the study wasobtained through simple random technique. Simplerandom sampling of finite population is described bychoosing elements randomly from a population onestep at a time and at each step the remainingelements in the population are guaranteed that theyhave the probability of being selected [12]. Usingthis logic, a 50% simple random sample was selectedby distribution of 500 questionnaires to the studentcohort of each institution. A total number of 313questionnaires were obtained out of the 500 handedout at UKZN and a total number of 310questionnaires were obtained out of the 500 handedout at LASU.3.2. Data collection instrumentA self-administered questionnaire was designedfor the primary data collection procedure. The selfadministered questionnaires consisted of structured,closed format, biographical and rating scale type ofquestions. The format of the questionnaire elicitedinformation about the relevant issues on the use ofmobile telecommunication services amongst first-821
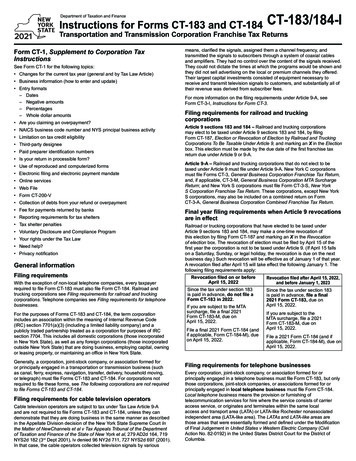
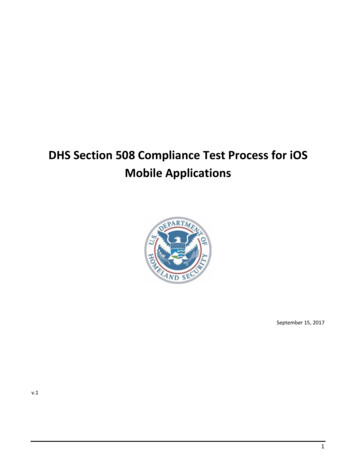
International Journal of Technology and Inclusive Education (IJTIE), Volume 5, Issue 2, December 2016year IT students in UKZN. The data and informationcollected are pre-structured according to the assumedrelationship between the concepts of the models used[13]. Data analysis was elaborated using set ofstatistical techniques for data diagnosis such as datapreparations, data descriptions and scale analysis soas to improve the validity and reliability of findings.A descriptive and inferential analysis was used toanalyze the collected data. Basic features of thecollected data were described and interpreted. Acombination of statistical software Statisticalpackage for Social Sciences (SPSS) and MicrosoftExcel was used for the data analysis. The findingsare presented in a subsequent section of this paper.4. Findings4.1. Students’ perceptions oftelecommunication services - UKZNmobileMobile telecommunication network operatorsoffer a range of services through which studentscould satisfy their academic and social needs.Participants were asked to indicate the mobiletelecommunication services that they use. Figure 1shows the number and corresponding percentage ofparticipants who use each service. The use of eachservice is measured in relation to all 313 participantsat UKZN. An overwhelming majority of students(89.8%) use SMS, followed by 69.6% who useMMS. Voice call is used by 65.8% of participantswhile 46.6% use data services. 36.1% and 10.9% ofstudents use GPS services and International roamingrespectively. 26 students, with the lowest percentageof 8.3% use conference 10.9Figure 1. Mobile telecoms services - UKZNParticipants were also asked to indicate thequality of these services on the mobiletelecommunications network. This question wasintended to offer insight into how the quality ofmobile telecommunication services could affect theactivities (academic and social) that students engagein. With respect to each services, participants wererequired to indicate on a scale of 1-5 theirCopyright 2016, Infonomics ation services with the possibleanswers being very poor, poor, average, good andvery good. The researcher took special cognizance ofservices that have a direct impact on the academicand social life of students. The assumption is that thehigher the quality of the services the more likely thatthey could enhance the academic and social life ofstudents. A significant number of participants rateddata services as of good quality: 41.8% (good) and22.1 (very good).The same can be said of MMS services, in whichcase 38.2% and 37.9% rated the services as good andvery good respectively. SMS had the highest ratingin terms of quality with 34.4% participants indicatingthat the service was good while 54.6% indicated thatthe service was very good. Voice call had the thirdhighest rating in which 33% of participants statedthat the service was good and 47.5% indicated that itwas very good. It can be seen from Table 1 thatparticipants generally perceived the quality of mobiletelecommunication services as of good quality.Table 1. Rating of mobile telecoms services - UKZNServicesRating (% of respondents)Very poorPoorAverageGoodVery goodConference Call9.44.725.837.522.7Data 4.454.6Voice Call1.53.414.63347.5International Roaming4.2. Duration of subscription to mobiletelecommunication network - UKZNTo help in determining the experiences of firstyear IT students in UKZN vis-à-vis their use ofmobile telecommunication services, it was necessaryto find out the number of years they have beensubscribed to their network provider. 36.7% on network for more than 5 years.16.2% had subscribed for more than 1 year but lessthan 2 years, 13.6% for more than 3 years but lessthan 4 years, 10.1% for more than 4 years but lessthan 5 years. Subscribers who had been on theirnetwork for more than 2 years but less than 3 yearsconstituted 7.5%.Participants who had been on theirnetwork for more than 6 months but less than 1 yearmade up 6.8%. The percentage of participants whosubscribed to the mobile telecommunication networkless than 6 months at the time of the study was 9.1%.822
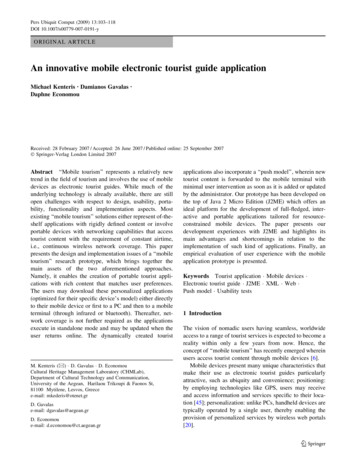
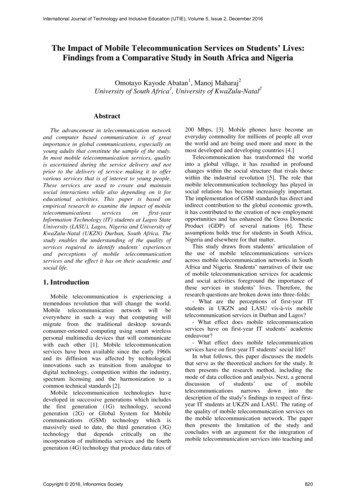
International Journal of Technology and Inclusive Education (IJTIE), Volume 5, Issue 2, December 20164.3. Challenges in the use of mobiletelecommunication services – UKZNIn order to determine the overall perception of thequality of services, participants at UKZN were askedto identify the challenges that they encountered usingof mobile telecommunication services. Table 2indicates Yes or No responses to some of thechallenges that could impair the use and benefits ofmobile telecommunication services. From Table 2, itis evident that comparatively lower number ofparticipants experienced challenges related to the useof mobile telecommunication services. This confirmsthe high quality rating of mobile telecommunicationservices described in earlier sectionTable 2. Challenges in the use of mobile telecomsservices – UKZNChallengesParticipants' answers (% )YesCall dropNo15.884.2Delayed SMS delivery43.0956.91Delayed MMs delivery36.563.5Poor voice quality22.477.6Low data speed37.562.543.0956.91Unstable network4.4. Students’ perceptions oftelecommunication services – LASUmobileA total of 310 first-year IT students at LASUindicated the mobile telecommunication services thatthey use. Figure 2 shows the number andcorresponding percentage of participants who useeach service. The use of each service is measured inrelation to all participants at LASU. The vastmajority of students constituting 92.9% use SMS,followed by the use of MMS at 62.9%. Voice call isused by 59.4% of students surveyed whileconference call and data services are used by 54.5%and 52.9% respectively. Global Positioning System(GPS) services and International roaming have thelowest percentage usage of 19.7% and 11.6%respectively.First-year IT students at LASU were required toindicate the quality of each of the services offered bymobile telecommunications network operators. Thesame assumptions made in section 4.1 above inrespect of services apply here. A number ofparticipants (45.2%) rated the quality of data servicesas average while 25.3% noted that data services wereof good quality and 27.8% deemed the quality ofdata services as very good. In the case of MMSservices, 34.8% considered the services as average,30.8% of participants indicated that the quality ofMMS services was good and 34.1% noted the servicequality as very good. As was the case withparticipants at UKZN, SMS had the highest qualityrating amongst first-year IT students at LASU inwhich 79.1% of participants responded that SMSservice quality was very good. Many participants,comprising 59.1% of those surveyed rated the qualityof voice call positively in the category of very good.Positive ratings for mobile telecommunicationservices were generally higher in the case of UKZNparticipants than their LASU counterparts.Apparently, this is attributable to the verychallenging operational environment within whichmobile network providers operate in Nigeria. Theenvironment is characterized by deficientinfrastructure and unstable electricity supply but avery huge subscriber base. Thus, the lowerpercentages of LASU participant’s vis-à-vis qualityratings in the good and very good categories may besituated in the context of Nigeria’s operationalenvironment.It can be seen from Table 3 that participantsgenerally perceived the quality of mobiletelecommunication services as of good quality eventhough the percentages were lower than thoseobtained from UKZN participants. The exception tothe foregoing pertains to the percentage ofparticipants who rated the quality of SMS services asvery good.Table 3. The rating of mobile telecoms services – LASUServicesConference ng (% of respondents)Very poorPoorAverageGoodVery good0.51.668.911.517.5Data onal 315.379.1Voice Call0.70.329.610.359.119.711.64.5. Duration of subscription to mobiletelecommunication network – LASUFigure 2. Mobile telecoms services - LASUCopyright 2016, Infonomics Society26.3% of participants had subscribed to theirnetwork operator for more than 1 year but less than 2years, 22% for more than 2 years but less than 3years, 15.5% for more than 6 months but less than 1year, 12.2% for more than 3 years but less than 4823
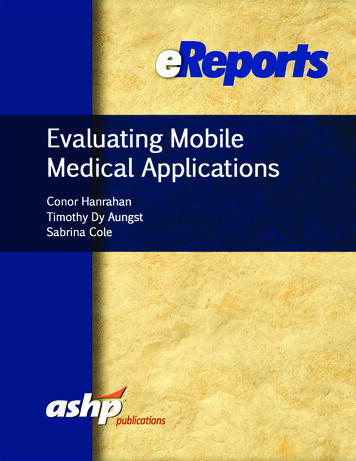
International Journal of Technology and Inclusive Education (IJTIE), Volume 5, Issue 2, December 2016years, 9.5% more than 5 years, 8.2% for less than 6months. 6.3% of participants subscribed for morethan 4 years but less than 5 years. The higherpercentages for participants who had subscribed forless than 2 years seem to reflect a commonassumption that most students in Nigeria do not haveaccess to mobile phones until their first year at theuniversity.4.6. Challenges in the use oftelecommunication services – LASUmobileAs in the case of UKZN participants, challengesencountered by LASU participants in the usage ofmobile telecommunication services serve todetermine the perceptions as to the quality ofservices. In Table 4, participants’ responses in theform of Yes or No to questions about challengesrelated to the use of mobile telecommunicationservices are captured to reflect the extent to whichthey determine the quality of services. The biggestchallenge relates to unstable network with 68.5% ofparticipants experiencing this problem. Thesignificance of the problem of network instability isthat it affects all other mobile telecommunicationservices. Perhaps, this explains why majority ofLASU participants had lower service quality ratingsthan their UKZN counterparts.Table 4. Challenges in the use of mobile telecomsservices – LASUChallengesParticipants' answers (% )YesCall dropNo1189Delayed SMS delivery21.478.6Delayed MMS delivery38.361.7Poor voice qualityLow data speed23.776.340.5859.4268.531.5Unstable network4.7. Impact of mobile telecommunicationservices on students’ life – UKZN4.7.1. Academic life. In light of the foregoing, it isnecessary to find out from participants’ perspectivethe impact that mobile telecommunication serviceshave on their academic life. Figure 3 providespertinent information on the impact of ademic endeavour.Figure 3. The effect of mobile telecoms on academicendeavours - UKZNThe description of the findings in this aspect ofthe study is presented according to the sequence ofimpact assessment as portrayed in Figure 3 below.The lowest number of participants (4.1%) describedthe impact of the use of mobile telecommunicationservices on their academic endeavour asoverwhelmingly negative.Next is another group of participants (23.7%) whodescribed the impact as somewhat negative. It shouldbe said that negative impact assessment isunderscored by the potential and actual drawbacksrelated to the usage of mobile telecommunicationservices namely possible disruptions to academicroutine and distractions as well as addiction totechnology. The highest number of participants(43.7%) did not know the impact that mobiletelecommunication services had on their academicendeavour. It may be said that students in thiscategory could not or had yet to establish acorrelation or interface between academicperformance/outcomes and their use of mobiletelecommunication services for academic purposes.The third highest number of participants (23.4%)identified the impact of the use of mobiletelecommunication services on their academicendeavour as somewhat positive.The last group of students in terms of sequence,representing 5.1% of participants indicated that theimpact of mobile telecommunication services ontheir academic endeavour is overwhelminglypositive. For the students in these latter categories(Somewhat positive and overwhelmingly positive)there is a beneficial correlation between the use ofmobile telecommunication services for academicpurposes and academic performance. It is notedtherefore that the use of mobile telecommunicationservices for academic purposes, while avoiding thepotential drawbacks, may engender positiveoutcomes.4.7.2. Social life. In view of the frequency of the useof mobile telecommunications for social activities,the study considers participants’ articulation of theimpact of mobile telecommunications on their sociallife.Copyright 2016, Infonomics Society824
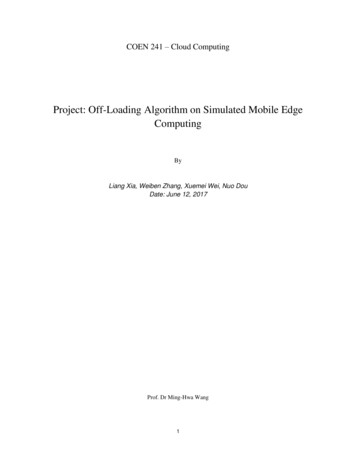
International Journal of Technology and Inclusive Education (IJTIE), Volume 5, Issue 2, December 2016Figure 4. The effect of mobile telecoms on social life UKZNFigure 5. The effect of mobile telecoms on academicendeavours - LASUFigure 4 describes the impact assessment fromparticipants’ perspectives. The description of thefindings in this aspect of the study is presentedaccording to the sequence of impact assessment asportrayed in the figure below. The lowest number ofparticipants (2.3%) described the impact of the use ofmobile telecommunication services on their sociallife as overwhelmingly negative. This is followed bythe group of participants (9.7%) who described theimpact as somewhat negative. It should be said thatnegative impact assessment is underscored by thepotential and actual drawbacks associated with theuse of mobile telecommunication services namelypossible impairment of interpersonal physical contactand distractions as well as addiction to technology.Another group of students representing 23.8% ofparticipants did not know the impact that mobiletelecommunication services had on their social life.The highest number of participants (49.3%)identified the impact of the use of mobiletelecommunication services on their social life assomewhat positive. The last group of students interms of sequence, representing 14.8% ofparticipants indicated that the impact of mobiletelecommunication services on their social life isoverwhelmingly positive. It can be said that studentsin the last two categories (Somewhat positive onbetweentheuseofmobiletelecommunication services for social activities andimproved social interactions.It is necessary to find out the impact of mobiletelecommunication services have on participants’academic endeavour based on participants’perceptions. The description of the findings in thisaspect of the study is presented according to thesequence of impact assessment as portrayed inFigure 5 below. Only 1.3% of participants describedthe impact of the use of mobile telecommunicationservices on their academic endeavour asoverwhelmingly negative. Next is another group ofparticipants (14.4) who described the impact ofmobile telecommunication services on theiracademic endeavour as somewhat negative. Thelowest number of students with only 1% ofparticipants did not know the impact that mobiletelecommunication services had on their academicendeavour. It is said that participants in this categorycould not or had yet to establish a correlationbetween academic performance and their use ofmobile telecommunication for their academicpurposes. A very huge and the highest number ofstudents with 77.5% of participants identified theimpact of the use of mobile telecommunicationservices on their academic endeavour as somewhatpositive. The last group of participants in terms ofsequence, representing 5.9% of participants indicatedthat the impact of mobile telecommunicationservices on their academic endeavour isoverwhelmingly positive. Putting into consideration,the students in the category of somewhat positiveand overwhelmingly positive. There is a positiverelationship between the use of mobiletelecommunication services for academic purposesand academic performance. It is considered that theuse of mobile telecommunication services foracademic purposes produced positive impacts.4.8. Impact of mobile telecommunicationservices on students’ life – LASU4.8.1. Academic life. Figure 5 provides ationservicesonparticipants’academic endeavour in LASU.Copyright 2016, Infonomics Society4.8.2. Social life. In the light of the frequency of theuse of mobile telecommunications for socialactivities, the study considers munications on their social life. Figure 6depicts the impact assessment from participants’perspectives.825
International Journal of Technology and Inclusive Education (IJTIE), Volume 5, Issue 2, December 2016Figure 6. The effect of mobile telecoms on social life LASUThe description of findings is representedaccording to the sequence of impact assessment asportrayed in Figure 6 below. A small amount ofstudents (0.7%) described the impact of mobiletelecommunication services on their social life asoverwhelmingly negative. It is followed by the groupof participants (3.6%) who described the impact ofmobile telecommunication services as somewhatnegative. Having said that negative impactassessment is underscored by the potential and actualdrawbacks associated with the use of mobiletelecommunication services namely possibleimpairment of interpersonal physical contact anddistraction as well as addiction to technology. Thesmallest group of students representing 0.3% ofparticipants did not know the impact that mobiletelecommunication services have on their social life.The highest number of students (48%) described theimpact of the use of mobile telecommunicationservices as somewhat positive. The last group ofstudents in terms of sequence with 47.4% ofparticipants identified that the impact of mobiletelecommunication services on their social life isoverwhelmingly positive. It can be said thatparticipants in the last two categories (Somewhatpositive and overwhelmingly positive) impliedpositive correlation between the use of mobiletelecommunication services for social activities andimproved social interactions.5. Discussions of findingsThe evaluation of research findings is done in thecontext of the research questions using inferentialstatistics mainly in the form of cross-tabulations andChi-Square tests. These means of analysis enable theunderstanding of the significance of the variables andtheir influence on participant’s perceptions.Therefore, the responses of participants are crosstabulated and Chi-Square tests are used to establishthe significance of factors that could offer answers tothe main research questions. A Cross-tabulation isthe procedure with which a table of two or morecategory variables is produced, in order to comparethe incidence of one characteristics against the otherCopyright 2016, Infonomics Society[14]. If there is no association then (p is greater than0.05) it means there is no evidence of bias. A low pvalue indicates rejection of the null hypothesis and inthis case implies bias.The overriding question that the study seeks toaddress is the perception of first-year IT studentsabout mobile telecommunication services. In order tounderstand the perceptions, participants were askedto state the impact of mobile telecommunicationservices on both their academic and social life. n services have on students’academic life, a number of factors were taken intoconsideration. Some of these factors include the useof mobile telecommunication services for a range ofacademic activities. In the final analysis,participants’ assessment of the impact of mobiletelecommunication services on their academic life issummed up in a few categories that may be broadlyportrayed as either negative or positive. Aninferential analysis of this research sub-questionpertaining to the effect of mobile telecommunicationservices on students’ academic life is presented inTables 5 and 6. In line with the definition of Crosstabulation above, significance is established wherep 0.05.Table 5. Cross-tabulation results on effect of telecomservices on academic endeavoursLocationDurbanWhat effect does your use of mobile telecom services have onyour academic endeavour?OverwhelmiOverwhelmi
telecommunication services - UKZN Mobile telecommunication network operators offer a range of services through which students could satisfy their academic and social needs. Participants were asked to indicate the mobile telecommunication services that they use. Figure 1 shows the number and corresponding percentage of