Transcription
MEASURING ALFALFA YIELD AND PERSISTENCE DURING THEBUSH AND OBAMA ADMINISTRATIONSMike Rankin1/IntroductionEver since the demise of the Wisconsin Green Gold Program in 1996 there has been nopublic source of on-farm alfalfa yield data. Unlike corn and soybeans, obtaining accurate yieldinformation for forage crops involves considerable planning, time, and effort on behalf of theperson collecting the yield data and the farmer. Historically, few producers had the capacity orpatience during harvest to undertake such a task. Further, past efforts to measure alfalfa yieldwere usually limited to the best small area of the best field. In the past ten years, many largerdairies have installed on-farm scales for measuring purchased production of forages and/or feedcommodities. These scales now make it relatively easy to weigh production not just from smallareas of fields, but entire fields over the course of several years.Knowing actual alfalfa production offers some unique value beyond just documenting whatis being harvested on Wisconsin farms. It allows us to contrast what is being found with currentsmall-plot research trials and identify management areas where improvements can be made.Further, we can document progress over time.During the early spring of 2007, members of the Univ. of Wisconsin Extension TeamForage decided to initiate the Wisconsin Alfalfa Yield and Persistence Program. The objectivesof the program were to:1. To verify the yield and quality of alfalfa harvested from production fields over the life ofthe stand beginning with the first production year (year after seeding).2. To quantify decreases in stand productivity of alfalfa fields as they age.Data CollectionEach year, interested producer participants with qualifying fields are solicited All fields inthe program are entered at the beginning of the first production year (the year following seeding).Further, fields must remain in the program for the life of the stand. For each field, an accuratemeasure of field size is determined (if not previously calculated). Forage yield from an entireproject field is weighed (usually this is done with an on-farm drive over scale). Both empty andfull weights for all trucks/wagons used are recorded. Two forage samples from each harvest aretaken and submitted to the Marshfield Soil and Forage Analysis Laboratory for NIR analysis(only one sample was submitted per harvest in 2007). Data from the two forage samples isaveraged and recorded by the local coordinator. Information is inputted into an Excel spreadsheetprogram and shared with the producer following each harvest. At the end of the season, all datais collected and summarized. Summary reports are available on the UW-Extension Team Forageweb site Crops and Soils Agent, UW Extension-Fond du Lac Co., 400 University Dr.,Fond du Lac, WI 54935. Email: michael.rankin@uwex.eduProc. of the 2011 Wisconsin Crop Management Conference, Vol. 50
2010 OverviewThe year 2010 marked the fourth year of this project. As in previous years, UW-Extensionagents were asked to identify forage producers who would be willing to weigh and sample foragefrom a 2009-seeded field and continue to do so for the life of the stand. Six such fields wereidentified on two separate farms. As is always the case in these types of studies, there is someattrition of fields over time. This is usually the result of not being able to obtain critical yield orforage quality data for a cutting or multiple cuttings. This year there were six 2006-seeded fieldsdropped from the project simply because the producers decided not to harvest a fourth productionyear from the stands. In total, production data was collected for 23 fields in 2010 (the samenumber as 2009). Over 6500 tons of forage was harvested from the project fields in 2010. Asummary of all fields is presented in Table 1.Table 1. Field background e04/061679.3dropped in 20103072007Outagamie04/061637.0no ’08 1st-cut data4072007Outagamie04/0616156.7dropped in 20105072007St. Croix08/06NA51.0dropped in 20106072007Waupaca04/061524.1dropped in 20087072007Fond du Lac04/061715.7dropped in 20088072007Fond du 50.310082008Outagamie08/0715194.81092009St. ebago08/081578Field #107Proc. of the 2011 Wisconsin Crop Management Conference, Vol. 50FieldSize (ac) Notes103.7dropped in 2010dropped in 2010dropped in 200975
Table 1 (cont.). Field background ingMo/Yr.08/08SeedingRate(lb/ac)18FieldSize 05/09161115102010Fond du Lac04/091750.36102010Fond du Lac04/091719.3Field #409Notesdropped in 2010Harvest SchedulesAcross Years:Mean cutting dates by year are presented in Table 2. Average first-cut date ranged from May22 in 2007 and 2010 to June 3 in 2008. Regardless of first-cut date, the average fourth-cut datewas generally close to September 1. The vast majority of fields in this study were cut four times.Across years and sites, 8 fields were cut three times, 54 fields were cut four times (generally priorto or soon after September 1), and 8 fields were cut five times (generally four times beforeSeptember 1 with a final cut in October).Table 2. Mean cutting dates by yearYear20071st CutDate22-May2nd CutDate24-June3rd CutDate25-July4th CutDate30-Aug5th Oct*average excludes data from two fields where a 4th-cut was taken in October2010Cutting dates for all project fields harvested in 2010 are presented in Table 3. All of the 23fields were cut at least four times with two being cut five times. The average first-cut date ofMay 22 was the earliest since 2007. Unlike 2007, second-cut was delayed by rain in many areas76Proc. of the 2011 Wisconsin Crop Management Conference, Vol. 50
of the state. In some cases, third-cut was also delayed. Contrasting 2007 with 2010, although theaverage first cut date was the same, the third-cut date was one week later in 2010. Even so, manyof the project participants generally took their fourth-cut before September 1, resulting in a veryshort interval between the third and fourth cuttings. Two fields, 208 and 409, had a fourth-cutharvested in October. These two fields were not considered into the mean of the average fourthcut date.Table 3. Summary of 2010 Cutting DatesField ID#3071st CutDate2nd CutDate3rd CutDate4th CutDate5th ul17-Aug7-Sep13-Octth*average excludes data from two fields where a 4 -cut was taken in OctoberProc. of the 2011 Wisconsin Crop Management Conference, Vol. 5077
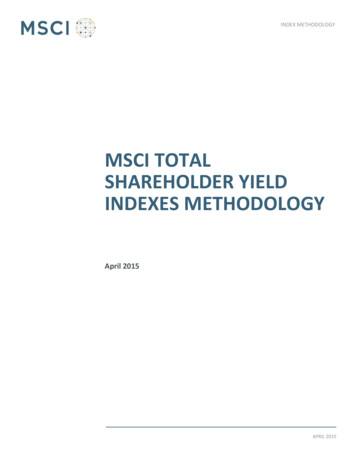
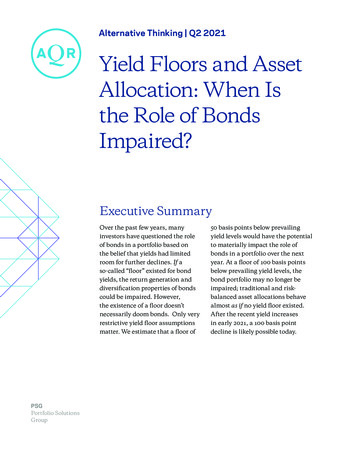
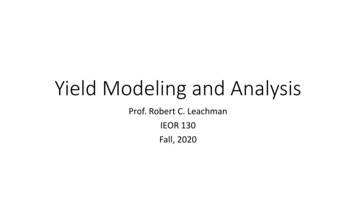
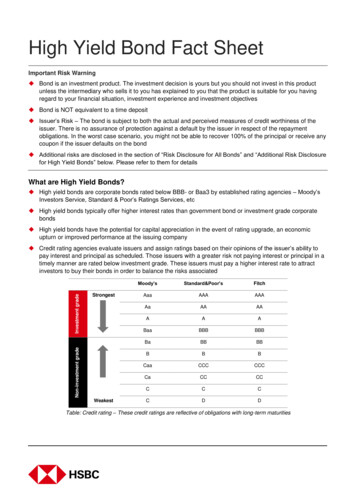
Forage Dry Matter at HarvestAlfalfa was harvested as haylage for all but eight individual cuttings over the four years.Harvest dry matter data from the eight dry hay harvests was not included in the forage dry matterdata summary. Average harvested forage dry matter content has consistently been at or slightlybelow 50 percent (Figure 1). In both 2009 and 2010 only five of the twenty-three fields had totalseason forage dry matter levels (weighted average) below 45 percent.Range for individual fields:Alfalfa Dry Matter % at Harvest by Year60.051Dry Matter %50.05147 485153514748504947 485153565049464749 4940.02007 (n 8):For individual cutting:33.9% - 67.6% DMFor total season:41.6% - 54.2% DM2008 (n 16):For individual cutting:33.0% - 63.3% DMFor total season:37.0% - 54.4% DM30.020.010.00.01st Cut2nd Cut20073rd Cut20084th Cut20095th CutTot Sea2010Figure 1. Average dry matter of harvested forage by cutting andas a weighted average for the total season (2007-2010).2009 (n 23):For individual cutting:27.7% - 66.6% DMFor total season:37.9% - 59.2% DM2010 (n 23):For individual cutting:27.6% - 63.1% DMFor total season:37.4% - 54.9% DMAlthough project participants were not asked about storage structure, there is good reason tobelieve most of the farms are storing this forage in bunker/pile silos. Dry matter percentage hasconsistently been near 50 percent throughout the first four years of the project. This is well abovethat recommended by ag engineers to obtain optimum fermentation and silage porosity.Conversely, many nutritionists are recommending drier alfalfa haylage to offset the wetter cornsilage component of the diet, decrease the percentage of soluble protein, and to avoid any chanceof butyric acid formation. Clearly, the latter strategy is being followed on these farms andpresumably many others.Forage Dry Matter YieldAverage yield by cutting and for the season in each project year are presented in Figure 2. In2010, exceptional weather conditions in April and May allowed for the highest average first-cutyield (1.81 tons d.m./A) of any project year. Average second-cut yield (1.49 tons d.m./A) alsowas higher than any of the previous three years. Third-cut yield was about average (1.08 tonsd.m./A), while fourth-cut dropped to 0.64 tons d.m./A. The lower fourth-cut yield can besomewhat be attributed to a relatively short harvest interval (perhaps induced by a need to beginharvesting corn silage in some cases). The mean average total season yield in 2010 was 5.05 tons78Proc. of the 2011 Wisconsin Crop Management Conference, Vol. 50
d.m./A, just slightly higher than 2007 but a full ton higher than 2009. A summary of dry matteryields by cutting and for the total season are presented in Table 4.Average Alfalfa Dry Matter Yield by Cutting and Total Season6.005.05.05.00DM Yield (tons/A)4.44.04.003.002.001.5 1.5 1.61.81.51.41.1 1.01.001.0 1.11.10.60.8 0.8 0.90.60.70.40.40.001st Cut2nd Cut20073rd Cut20084th Cut20095th CutTot Sea2010Figure 2. Average dry matter yield by cutting and for the total season.Data is segregated by calendar year.Table 4. Mean dry matter yield and range by cutting and for the total season in 2007-20101st Cut2nd Cut3rd Cut4th Cut5th CutTot SeaDM YldDM YldDM YldDM YldDM YldDM Yld-----------------------------------tons 53.336.17MeanLowHigh1.811.162.34Proc. of the 2011 Wisconsin Crop Management Conference, Vol. 5079
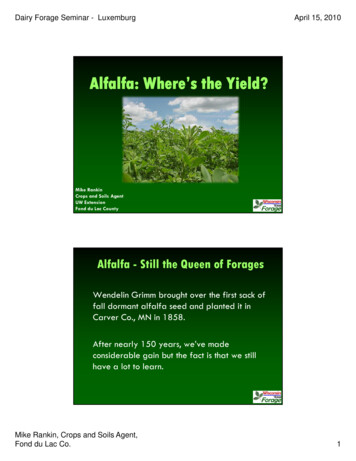
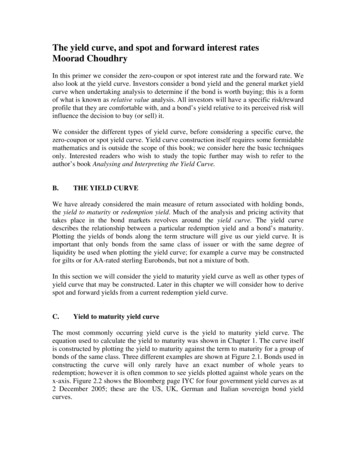
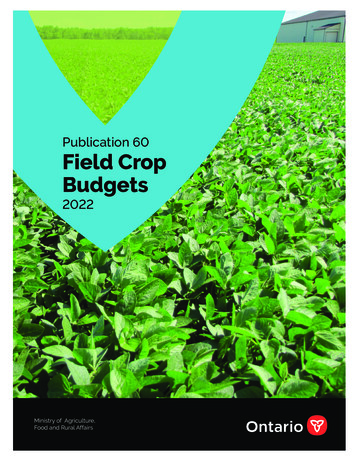
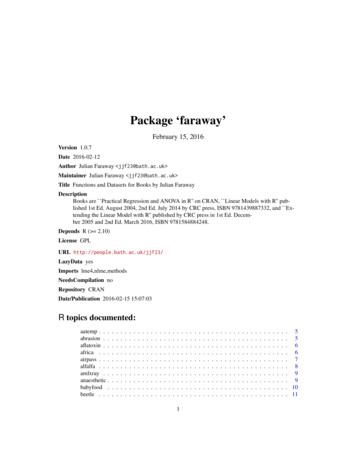
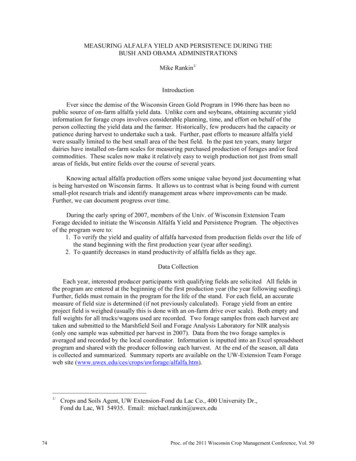
A comparison of 1st, 2nd, 3rd, and 4th production year fields cut four times in 2010 (essentiallyall fields) shows the highest average yield occurred with the 2nd production year fields (5.4 tonsd.m./A), followed by the 3rd production year fields (5.1 tons d.m./A), 1st production year fields(4.9 tons d.m./A), and 4th production year fields (4.5 tons d.m./A) (Figure 3). Average first- andsecond-cut yields were generally lower for the 4th production year fields. As is always the case,there is extreme yield variability between fields that can be attributed to cutting schedule andenvironment.Average Alfalfa Dry Matter Yield by Cutting and Production Yearfor 4-cut system fields in 20106.005.41st Prod Yr2nd Prod Yr3rd Prod Yr4th Prod YrDM Yield (tons/A)5.004.00n 6 fieldsn 6 fieldsn 8 fieldsn 2 fields5.14.94.53.002.001.82.01.81.31.5 1.6 1.51.31.21.1 1.0 1.11.000.80.50.6 0.70.001st Cut1st Prod Yr2nd Cut3rd Cut2nd Prod Yr3rd Prod Yr4th CutTot Sea4th Prod YrFigure 3. Average dry matter yield by cutting and for the totalseason. Data is segregated by stand production year.How profitable is it to take a 5th cutting in October? During 2007-2010, there were eightproject fields where this cutting strategy was used. The yield range was from 0.34 to 0.88 tons/A.Given the potential for reduced yield in the subsequent growing season and the cost of harvestingsuch a small amount of forage per acre, is such a practice viable in Wisconsin? Perhaps the “needfor feed” might justify the practice in some years, but long term it’s likely not a sustainable orprofitable management practice on a routine basis.Cutting schedule x yield:It’s often interesting to look at cutting schedule as a function of yield. The average yield ofalfalfa harvested for fields cut 3, 4, or 5 times per year is presented in Figure 4. Not surprisingly,more harvests per year translated to higher total season yields. It should be noted that this is asimple average that did not take into account the previous year cutting schedule. Further, thesecomparisons are made across a range of environments and locations.80Proc. of the 2011 Wisconsin Crop Management Conference, Vol. 50
Alfalfa Dry Matter Yield for Fields Cut 3, 4, or 5 Times perYear (2007 - 2010)6.005.40DM Yield (tons/A)5.004.644.003.333.002.001.00n 51n 84 cuts/yr5 cuts/yrn 90.003 cuts/yrFigure 4. Alfalfa dry matter yield for fields cut 3, 4, or 5 times peryear (2007-2010)Alfalfa Persistence:In-seasonAn analysis was done to determine the percent of total season yield for each cutting (Table 5).Data was summarized for 3-, 4-, and 5-cut systems for all project years. Five-cut fields were alsoincluded in the 4-cut summary with the final fall harvest not included in the total season yield.It’s significant to note the wide variation in percent yield for an individual cutting. In some casesthis is the result of environmental conditions (e.g. drought) previous to the harvest while in othersituations it’s simply a function of cutting date.Between yearsBeing four years into the project, it’s difficult to draw too many firm conclusions on standpersistence across years. Persistence is influenced over time by the age of the stand, cuttingschedule, and environment. For this project, persistence is being measured as a percent of 1stproduction year dry matter yield. Persistence data in Table 6 consists of 2006 through 2008seeded fields and is averaged over all cutting schedules. Although ranges indicate a widevariation, yields to date for the 2nd production year fields have usually equaled or exceeded the 1stproduction year. Production for 3rd-year fields remained equal with 1st-year stands, while theyield for the two 4th-year stands dropped off to 77 percent of their 1st-year production.When should an alfalfa stand be terminated? Most of the project fields have maintainedproductivity equal or greater to the 1st production year for three years after the seeding year.Time will tell if this trend continues, but to date it appears that keeping stands for at least threeproduction years seems to be the prudent decision.Proc. of the 2011 Wisconsin Crop Management Conference, Vol. 5081
Table 5. Average percent of total season yield by cutting for 3, 4 and 5 cut harvest systems*3-cut system (N 9 site years)MeanLowHigh1st cut2nd cut3rd cut4326593023432616501st cut2nd cut3rd cut4th cut36205827143720532179303rd cut4th cut4-cut system (N 58 site years)MeanLowHigh5-cut system (4 1 fall)1st cut(N 8 site years)2nd cut5th cut31242114Mean2514199Low39312619High* high and low figures are for individual cuttings and will not add to 100%10614Table 6. Percent of 1st production year yield by cutting and total season for 2nd and 3rdproduction year stands.2nd Production Year Stands (N 22 site years)MeanLowHigh1st cut2nd cut3rd cut4th cutTot Sea1338227512457291117234919061128112782363rd Production Year Stands (N 14 site years)MeanLowHigh1st cut2nd cut3rd cut4th cutTot Sea119612501296529988321509023169101631704th Production Year Stands (N 2 site years)MeanLowHigh821st cut2nd cut3rd cut4th cutTot Sea7676779783111908695665874776886Proc. of the 2011 Wisconsin Crop Management Conference, Vol. 50
Forage QualityForage quality was measured for harvests but is not the focus of this paper. A summary offorage quality results can be viewed in the annual program summary found .pdfSummaryThe Wisconsin Alfalfa Yield and Persistence Program is designed to provide forage growersand agricultural professionals a unique look at what is happening at the farm level. As morefields are entered and years pass, the reliability of information will increase. It’s important tokeep in mind that only four years of data have been collected. Environmental conditions have aprofound influence on both yield and quality and during the course of the past four years therehave been no two alike. Nevertheless, there certainly is enough information to begin to formulatepossible trends and topics for discussion.AcknowledgmentsFirst and foremost, UW-Extension Team Forage wishes to thank the producers who took theextra time and effort to obtain weights and forage samples for the project fields at each cutting.UW coordinators for this project:Greg Andrews, Pierce CountyMike Bertram, Marathon CountyGreg Blonde, Waupaca CountyJerry Clark, Chippewa CountyMark Hagedorn, Brown CountyKevin Jarek, Outagamie CountyBryce Larson, Calumet CountyLee Milligan, St. Croix CountyMike Rankin, Fond du Lac CountyNick Schneider, Winnebago CountyFunding for this project provided by UW Extension Team Forage and the Midwest ForageAssociation (MFA).Proc. of the 2011 Wisconsin Crop Management Conference, Vol. 5083
Ever since the demise of the Wisconsin Green Gold Program in 1996 there has been no public source of on-farm alfalfa yield data. Unlike corn and soybeans, obtaining accurate yield information for forage crops involves considerable planning, time, and effort on behalf of the person collecting the yield data and the farmer.