Transcription
Higher Education: Gaps inAccess and Persistence StudyAugust 2012NCES 2012-046U. S. D E PA R T M E N T O F E D U CAT I O N
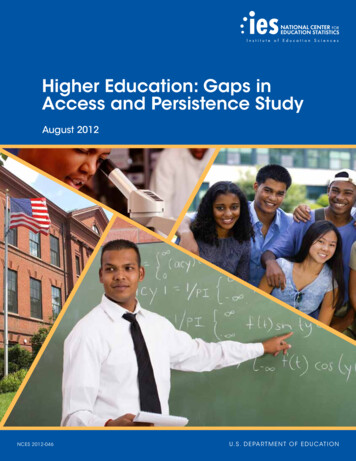
Higher Education: Gaps inAccess and Persistence StudyStatistical Analysis ReportAUGUST 2012Terris RossGrace KenaNational Center for Education StatisticsAmy RathbunAngelina KewalRamaniJijun ZhangPaul KristapovichEileen ManningAmerican Institutes for ResearchNCES 2012-046U . S . D E PA R T M E N T O F E D U C AT I O N
U.S. Department of EducationArne DuncanSecretaryInstitute of Education SciencesJohn Q. EastonDirectorNational Center for Education StatisticsJack BuckleyCommissionerThe National Center for Education Statistics (NCES) is the primary federal entity for collecting, analyzing, andreporting data related to education in the United States and other nations. It fulfills a congressional mandate to collect,collate, analyze, and report full and complete statistics on the condition of education in the United States; conductand publish reports and specialized analyses of the meaning and significance of such statistics; assist state and localeducation agencies in improving their statistical systems; and review and report on education activities in foreigncountries.NCES activities are designed to address high-priority education data needs; provide consistent, reliable, complete,and accurate indicators of education status and trends; and report timely, useful, and high-quality data to the U.S.Department of Education, the Congress, the states, other education policymakers, practitioners, data users, and thegeneral public. Unless specifically noted, all information contained herein is in the public domain.We strive to make our products available in a variety of formats and in language that is appropriate to a variety ofaudiences. You, as our customer, are the best judge of our success in communicating information effectively. If youhave any comments or suggestions about this or any other NCES product or report, we would like to hear from you.Please direct your comments toNCES, IES, U.S. Department of Education1990 K Street NWWashington, DC 20006-5651August 2012The NCES Home Page address is http://nces.ed.gov.The NCES Publications and Products address is http://nces.ed.gov/pubsearch.This report was prepared for the National Center for Education Statistics under Contract No. ED-IES-12-000716 withthe American Institutes for Research. Mention of trade names, commercial products, or organizations does not implyendorsement by the U.S. Government.Suggested CitationRoss, T., Kena, G., Rathbun, A., KewalRamani, A., Zhang, J., Kristapovich, P., and Manning, E. (2012). HigherEducation: Gaps in Access and Persistence Study (NCES 2012-046). U.S. Department of Education, National Center forEducation Statistics. Washington, DC: Government Printing Office.Content ContactTerris Ross(202) 502-7302terris.ross@ed.gov
Letter from theCommissioner of theNational Center for Education StatisticsAugust 2012Numerous studies have documented persistent gaps between the educational attainment of White males andthat of Black, Hispanic, American Indian/Alaska Native, and Native Hawaiian/Pacific Islander males. Further,there is evidence of growing gender gaps within these racial/ethnic groups, as females participate and persist ineducation at higher rates than their male counterparts. In the interest of formulating policies to address thesegaps, Congress has directed the U.S. Department of Education to produce a report documenting the gaps inaccess to and completion of higher education by minority males and to outline specific policies that can helpaddress these gaps (Higher Education Opportunity Act, H.R. 4137, 110th Cong. §1109, 2008). Within the U.SDepartment of Education, the National Center for Education Statistics (NCES) was given the responsibilityfor responding to the component of the mandate related to producing a report that documents gaps in access toand completion of higher education.The NCES report Higher Education: Gaps in Access and Persistence Study presents 46 indicators of importantdevelopments and trends in the education of males and females within and across specific racial/ethnic groups.These indicators focus on student demographics, school characteristics, student behaviors and afterschoolactivities, academic preparation and achievement, students’ college knowledge, postsecondary education, andpostsecondary outcomes and employment. In the chapters that follow, we use the most recent data available toexplore the educational achievements and challenges of males and females, noting where the groups are similarand where they differ.The primary focus of the Higher Education: Gaps in Access and Persistence Study is to examine differencesbetween males and females overall and within racial/ethnic groups. The racial/ethnic groups of interest includeBlacks, Hispanics, Native Hawaiians/Pacific Islanders, and American Indians/Alaska Natives. The secondaryfocus of the report is to examine overall sex and racial/ethnic differences. In addition to the indicators,this report also includes descriptive multivariate analyses of variables that may influence male and femalepostsecondary attendance and attainment in different ways.Jack BuckleyCommissionerNational Center for Education StatisticsLetter from the Commissioneriii
This page intentionally left blank.iv Higher Education: Gaps in Access and Persistence Study
Numerous studies, including those of the National Centerfor Education Statistics (NCES), have documentedpersistent gaps between the educational attainment ofWhite males and that of Black, Hispanic, AmericanIndian/Alaska Native, and Native Hawaiian/PacificIslander males. Further, there is evidence of growinggaps by sex within these racial/ethnic groups, as femalesparticipate and persist in education at higher rates thantheir male counterparts (Aud, Fox, and KewalRamani2010; Aud et al. 2011). In the interest of formulatingpolicies to address these gaps, Congress directed theU.S. Department of Education to produce a reportdocumenting the gaps in access to and completion ofhigher education by minority males and to outlinespecific policies that can help address these gaps (HigherEducation Opportunity Act, H.R. 4137, 110th Cong.§1109, 2008). NCES was directed to produce the HigherEducation: Gaps in Access and Persistence Study, a statisticalreport that documents the scope and nature of the gaps bysex and by race/ethnicity.The primary focus of the Higher Education: Gapsin Access and Persistence Study is to examine gaps ineducational participation and attainment betweenmale Blacks, Hispanics, Native Hawaiians/PacificIslanders, and American Indians/Alaska Natives andtheir female counterparts and to examine gaps betweenmales in these racial/ethnic groups and White males.The secondary focus of the report is to examine overallsex and racial/ethnic differences. In addition to thesedescriptive indicators, this report also includes descriptivemultivariate analyses of variables that are associatedwith male and female postsecondary attendance andattainment.Postsecondary attendance rates are generally lower foryouth from lower socioeconomic backgrounds andthose from various racial/ethnic groups (e.g., Blacks andHispanics) when compared to Whites and Asians (Audet al. 2011). In 2010, as in every year since 1980, a lowerpercentage of male than female 18- to 24-year-olds wereenrolled either in college or graduate school (39 vs. 47percent). This pattern was also observed for Whites (43vs. 51 percent), Blacks (31 vs. 43 percent), Hispanics (26vs. 36 percent), American Indians (24 vs. 33 percent),and persons of two or more races (40 vs. 49 percent). Inaddition to college enrollment differences, there are gapsin postsecondary attainment for males and females. Forinstance, among first-time students seeking bachelor’sdegrees who started full time at a 4-year college in 2004,a higher percentage of females than males completedbachelor’s degrees within 6 years (61 vs. 56 percent)—apattern that held across all racial/ethnic groups.This report will document the scope and nature of anumber of differences between sex and racial/ethnicgroups in education preparation and achievement aswell as differences in postsecondary access, persistence,Executive SummaryExecutive Summaryand attainment between males and females within andacross racial/ethnic groups. The report presents indicatorsthat include the most recently available, nationallyrepresentative data from NCES, other federal agencies,and selected items from the ACT and the College Board.The report draws on multiple sources that representdifferent years and different populations.Demographic ContextChildren in Poverty and Language MinoritiesIn 2010, some 21 percent of children under age 18 wereliving in poverty, and the poverty rate for children livingwith a female parent with no spouse present was44 percent. The poverty rate for children living witha female parent with no spouse present was higher forAmerican Indian children (53 percent) than for childrenof all other racial/ethnic groups (with the exception ofBlack and Hispanic children). There were no measurabledifferences in male versus female poverty rates for childrenliving with a female parent with no spouse present.Also, in 2010, some 11.8 million children ages 5 to17 (about 22 percent of the school-age population)spoke a language other than English at home (2.7 millionspeaking English with difficulty). The percentage whospoke a language other than English at home and spokeEnglish with difficulty was higher for Hispanics(16 percent) and Asians (15 percent) than for AlaskaNatives (7 percent), Native Hawaiians/Pacific Islanders(5 percent), American Indians (2 percent), children of twoor more races (2 percent), Whites (1 percent), and Blacks(1 percent). No measurable differences were observedbetween males and females overall. However, higherpercentages of Asian and Hispanic males (16 percent each)spoke a language other than English at home and spokeEnglish with difficulty than females (14 and 15 percent,respectively) in their racial/ethnic group. In addition, ahigher percentage of Hispanic school-age children bornoutside of the United States spoke a non-English languageat home and spoke English with difficulty than did theircounterparts born within the United States (35 vs.13 percent).Parents’ Educational Attainment andInvolvement in EducationIn 2010, about 11 percent of children between the agesof 6 and 18 lived in a household where neither parenthad earned at least a high school credential (either adiploma or an equivalency credential such as a GeneralEducational Development [GED] certificate). Thepercentage of children with parents who had not earneda high school credential was 11 percent for both malesand females. Also, no measurable differences by sexwithin racial/ethnic groups were found at any of thethree levels of educational attainment examined (lessthan high school completion, high school completion,Executive Summaryv
and bachelor’s or higher degree completion). However,differences by race/ethnicity were observed. For example,the percentages of Asian (59 percent), White (44 percent),and children of two or more races (38 percent) who hadparents with a bachelor’s degree or higher were higherthan the corresponding percentages of Black (20 percent),Hispanic (16 percent), Native Hawaiian/Pacific Islander(18 percent), American Indian (18 percent), and AlaskaNative children (16 percent).In 2007, parents’ participation in their children’seducation varied by type of involvement. For example,among students in kindergarten through 12th grade,about 89 percent had parents who reported attendinga general school or PTO/PTA meeting, 78 percent hadparents who reported attending regularly scheduledparent-teacher conferences, 74 percent had parents whoreported attending a school or class event, 65 percent hadparents who reported participating in school fundraising,and 46 percent had parents who reported volunteeringor serving on a school committee. A higher percentageof female than male students had parents who reportedparticipation in such school-related activities as attendinga school or class event or volunteering or serving ona school committee. However, a higher percentageof males than females had parents who attendedregularly scheduled parent-teacher conferences. Parentalparticipation in some school-related activities varied byrace/ethnicity. For example, 77 percent of White maleshad parents who reported attending a school or classevent, compared with 62 percent of Black males and61 percent of Hispanic males.Figure 1.Special Needs ChildrenIn 2009, about 10 percent of 9th-grade students receivedspecial education services. A higher percentage of male(13 percent) than female (7 percent) students receivedspecial education services. This pattern was also foundfor Whites (13 vs. 8 percent), Blacks (16 vs. 7 percent),Hispanics (12 vs. 6 percent), and students of two ormore races (14 vs. 7 percent). Among male students, ahigher percentage of American Indian/Alaska Natives(27 percent), Whites (13 percent), Blacks (16 percent),Hispanics (12 percent), and males of two or more races(14 percent) received special education services than Asianmales (2 percent).Characteristics of SchoolsRacial/Ethnic Concentration and Poverty inSchoolsIn 2010–11, over 49 million students were enrolled inpublic elementary and secondary schools. Enrollmentpatterns for males and females were similar withinracial/ethnic groups. Looking at enrollment patterns bystudents’ race/ethnicity, 84 percent of White studentsattended a predominantly White school (a school whereat least 50 percent of the students were White), 46 percentof Black students attended a predominantly Black school,56 percent of Hispanic students attended a predominantlyHispanic school, 12 percent of Asians attended apredominantly Asian school, 13 percent of Pacific Islanderstudents attended a predominantly Pacific Islanderschool, and 23 percent of American Indian/Alaska Nativestudents attended a predominantly American Indian/(Figure 5-1) Percentage of students receiving special education services in 9th grade, by race/ethnicity andsex: ican Indian/Alaska NativeTwo ormore racesFemale! Interpret data with caution. The coefficient of variation (CV) for this estimate is 30 percent or greater.1Total includes other racial/ethnic groups not shown separately in the figure.NOTE: Reporting standards for Native Hawaiians/Pacific Islanders were not met; therefore, data for this group are not shown in the figure. Race categoriesexclude persons of Hispanic ethnicity.SOURCE: U.S. Department of Education, National Center for Education Statistics, High School Longitudinal Study of 2009, Base-Year Restricted-Use Data File.vi Higher Education: Gaps in Access and Persistence Study
(Figure 6-2) Percentage of students in low- and high-poverty public elementary and secondary schools, byrace/ethnicity and sex: School year 2010–11PercentLow-poverty schoolsExecutive SummaryFigure 2.High-poverty schools60503042 4138 394038 3833 3331 3124 2425 25209 91013 1314 1420 2019 1915 1411 1116156 60Total1WhiteBlack Hispanic Asian Pacific American Two orIslander Indian/ moreAlaska racesNativeTotal1WhiteBlack Hispanic Asian Pacific American Two orIslander Indian/ moreAlaska racesNativeRace/ethnicityMaleFemale1Total includes other racial/ethnic groups not shown separately in the figure.NOTE: Low-poverty schools are those where 25 percent or fewer students were eligible for free or reduced-price lunch; high-poverty schools are those wheremore than 75 percent of students were eligible for free or reduced-price lunch. Race categories exclude persons of Hispanic ethnicity.SOURCE: U.S. Department of Education, National Center for Education Statistics, Common Core of Data (CCD), “Public Elementary/Secondary SchoolUniverse Survey,” 2010–11.Alaska Native school. Other racial/ethnic patternsinclude higher enrollment at high-poverty schools forBlack (41 percent), Hispanic (38 percent), and AmericanIndian/Alaska Native students (31 percent) than forPacific Islander (19 percent), two or more races(16 percent), Asian (15 percent), and White students(6 percent).Adequate Yearly Progress and SpecialSchoolsIn 2008–09, some 60 percent of public school studentsattended a school that met adequate yearly progress(AYP), an individual state’s measure toward achievingstate academic standards based on criteria contained inthe Elementary and Secondary Education Act (ESEA)Reauthorization. No measurable differences in schoolAYP status were found between males and females (overallor by race/ethnicity). However, racial/ethnic differenceswere observed. Higher percentages of Black (46 percent),Hispanic (48 percent), Asian/Pacific Islander (40 percent),and American Indian/Alaska Native students (40 percent)than White students (33 percent) attended schools thatdid not meet AYP. The percentage of students attendingschools that did not meet AYP was similar for malesand females (both overall and within each racial/ethnicgroup), although it did vary by race/ethnicity.In 2010–11, nearly all students (98 percent) in publicelementary and secondary schools in the United Statesattended regular public schools, 1 percent attendedalternative schools,1 and less than 1 percent each attendedspecial education schools and vocational educationschools. About 4 percent each of students attended charterAn alternative school is a public elementary/secondary school that (1) addressesneeds of students that typically cannot be met in a regular school, (2) providesnontraditional education, (3) serves as an adjunct to a regular school, or (4) fallsoutside the categories of regular, special education, or vocational education.1schools and magnet schools, most of which were alsoclassified as regular schools. At alternative schools endingin grade 12, males enrolled at higher rates than femalesdid both overall and within each racial/ethnic groupstudied.High School Guidance CounselingIn 2009, about 48 percent of 9th-graders had high schoolguidance counselors who reported that the counselingprogram’s primary goal was to help students plan andprepare for postsecondary education, and 35 percent hadcounselors who reported that the primary goal was tohelp students improve their achievement in high school.No measurable differences were found between male andfemale 9th-graders (overall or within racial/ethnic groups)for either of the primary counseling goals. However, ahigher percentage of Asian 9th-graders (60 percent) thanBlack (44 percent), Hispanic (41 percent), and AmericanIndian/Alaska Native 9th-graders (29 percent) hadcounselors who reported that the primary counselingprogram goal was helping students plan and preparefor postsecondary education. Among male 9th-graders,higher percentages of Asians (56 percent) and Whites(51 percent) than Hispanics (38 percent) attended schoolsin which the counseling program’s primary goal waspostsecondary planning and preparation.Student Behaviors and AfterschoolActivitiesRetention, Suspension, and ExpulsionAccording to parent reports, in 2009, some 13 percentof 9th-grade students had been retained in any of gradeskindergarten through 9. In 2009, a higher percentage ofmales than females had been retained in any grade. Also,Executive Summaryvii
Figure 3.(Figure 11-1) Percentage of 9th-grade students who had ever been retained in any of grades kindergartenthrough 9, by race/ethnicity and sex: l1WhiteBlackHispanicAsianTwo or more racesRace/ethnicityMaleFemale! Interpret data with caution. The coefficient of variation (CV) is 30 percent or greater.1Total includes other racial/ethnic groups not shown separately in the figure.NOTE: Data are based on parent responses. Reporting standards for Native Hawaiian/Pacific Islander males and females and American Indian/Alaska Nativefemales were not met; therefore, data for Native Hawaiian/Pacific Islander and American Indian/Alaska Native males and females are not shown in thefigure. Data weighted by W1PARENT. Race categories exclude persons of Hispanic ethnicity.SOURCE: U.S. Department of Education, National Center for Education Statistics, High School Longitudinal Study of 2009, Base-Year Restricted-Use File.compared with their female peers, higher percentagesof White, Black, and Hispanic male students had beensuspended or expelled. For example, there was a differenceof 18 percentage points between Black males and femaleson this percentage (42 vs. 24 percent).Student Safety at SchoolIn 2009, some 8 percent of students in grades 9 through12 reported that they had been threatened or injured witha weapon, 11 percent reported that they had engagedin a physical fight, and 23 percent reported that drugswere available to them on school property in the past 12months. Six percent of students reported having carrieda weapon to school on one or more of the past 30 days.Overall, males reported having each of these experiencesat higher rates than females did. Among male students,a lower percentage of Whites were threatened or injuredwith a weapon (8 percent) than were Blacks (11 percent),Hispanics (12 percent), and persons of two or more races(14 percent). No measurable differences in the percentagesof students carrying a weapon on school property werefound among males by race/ethnicity: between 6 and 8percent of males reported carrying a weapon on schoolproperty.Student Use of Alcohol and Other DrugsConcerning alcohol and other drugs, 19 percent ofstudents in grades 9 through 12 reported having smokeda cigarette, 42 percent reported having drank alcohol, and21 percent reported having smoked marijuana on one ormore of the past 30 days. Six percent of students reportedhaving ever used cocaine, 12 percent reported havingviii Higher Education: Gaps in Access and Persistence Studyever used inhalants, and 4 percent reported having everused methamphetamines. Overall, higher percentages ofmales than females reported having smoked marijuanain the past month, ever used cocaine, and ever usedmethamphetamines in 2009. In contrast, a higherpercentage of females than males reported having everused inhalants; there were no measurable differences inthe overall percentage of males and females reporting theuse of alcohol.HomeworkIn 2007, according to parent reports, 93 percent ofhigh school students in grades 9 through 12 did somehomework outside of school. In addition, the parentsof 65 percent of high school students checked to ensurethat their homework was completed. The percentageof high school students whose parents checked forhomework completion was higher for males than forfemales (68 vs. 61 percent). Checking for homeworkcompletion was more prevalent among the parents ofBlack males (86 percent) than among the parents ofWhite (61 percent), Hispanic (74 percent), and Asian(58 percent) males and the parents of males of two ormore races (66 percent).Part-Time EmploymentIn 2010, about 17 percent of high school students ages16 and older were employed. Several differences inemployment rates were found by race/ethnicity and sex.White students had the highest rate of employment at 22percent. Among White and Black students and studentsof two or more races, higher percentages of females thanmales were employed. The opposite pattern was observed
Academic Preparation andAchievementReading, Mathematics, and ScienceAchievementAt the 4th- and 8th-grade levels in 2011, higherpercentages of females than males scored at or aboveProficient on the National Assessment of EducationalProgress (NAEP) reading assessment. For example, at the8th-grade level, 38 percent of females scored at or aboveProficient, compared to 29 percent of males. This patternby sex was found for all racial/ethnic groups except forNative Hawaiians/Pacific Islanders in the 4th grade andNative Hawaiians/Pacific Islanders and American Indians/Alaska Natives in the 8th grade. In 2009, the most recentyear for which 12th-grade NAEP data were available, ahigher percentage of 12th-grade females than males scoredat or above Proficient in reading (43 vs. 32 percent). Thispattern was also found for White, Black, and Hispanic12th-graders.In 2011, some 40 percent of 4th-graders and 35 percentof 8th-graders scored at or above the Proficient level on theNAEP mathematics assessment. In 2009, the most recentyear for which 12th-grade NAEP data were available,some 26 percent of 12th-graders scored at or above theProficient level in mathematics. In both the 4th and 8thgrades, higher percentages of males than females scoredat or above Proficient on the mathematics portion ofNAEP in 2011. For example, at the 4th-grade level, 42percent of males scored at or above Proficient, comparedto 39 percent of females. This pattern was also foundfor White and Hispanic students in the 4th grade andfor White students in the 8th grade. In contrast, a lowerpercentage of 8th-grade Native Hawaiian/Pacific Islandermales (17 percent) than females (28 percent) scored at orabove Proficient in mathematics. Among the remainingracial/ethnic groups, the percentages of males and femalesscoring at or above Proficient did not measurably differ ateither grade level. Among 12th-graders in 2009, higherpercentages of males than females scored at or aboveProficient on the NAEP mathematics assessment. Thispattern was also found for White and Hispanic students.In 2009, at all three grade levels, a higher percentageof males than females scored at or above Proficient on theNAEP science assessment. This pattern by sex held amongWhite students in the 4th grade and among White,Hispanic, Asian/Pacific Islander, and American Indian/Alaska Native students in the 8th grade. It also heldamong White and Hispanic students in the 12th grade:32 percent of White males scored at or above Proficient,compared with 22 percent of White females; and11 percent of Hispanic males scored at or above Proficient,compared with 6 percent of Hispanic females.Eighth-Grade AlgebraThe Early Childhood Longitudinal Study, KindergartenClass of 1998–99 (ECLS-K) assessed students’mathematics achievement in elementary and middleschool and collected information from students’mathematics teachers on their mathematics coursetakingin 8th grade. Of the students who scored in the top halfof the ECLS-K 5th-grade mathematics assessment in thespring of 2004, 58 percent went on to enroll in algebraor a more advanced mathematics course in 8th grade inthe spring of 2007. A higher percentage of males thanfemales scored in the top half of the ECLS-K 5th-grademathematics assessment (54 vs. 46 percent); however, ofstudents that scored in the top half, a lower percentageof males than females went on to enroll in algebra or amore advanced course in 8th grade (51 vs. 66 percent).Among males who scored in the top half of the 5th-gradeassessment, the percentage of Black students enrolledin algebra or an advanced course other than algebra by8th grade (20 percent) was lower than the percentages ofAsian (92 percent), White (54 percent), and Hispanic(51 percent) students enrolled.Executive Summaryfor Asian students: 10 percent of Asian males worked,compared with 7 percent of Asian females.Advanced Placement Exams and CollegeEntrance ExamsIn May 2010, about 58 percent of students who took anAdvanced Placement (AP) exam received a score of 3 orhigher in at least one subject area. A higher percentage ofmales than females received a score of 3 or higher on anyAP exam (61 percent vs. 54 percent). This pattern heldacross all racial/ethnic groups. Among males, 69 percentof Asian/Pacific Islanders received a score of 3 or higher,compared with 67 percent of White students, 48 percentof American Indian/Alaska Native students, 44 percentof Hispanic students, and 29 percent of Black students.In 2011, some 25 percent of all students who took theACT met or exceeded the ACT college readiness scorein all four subject areas (English, mathematics, reading,and science). A higher percentage of males than females(28 vs. 22 percent) achieved all four ACT collegebenchmark scores. This pattern held across all racial/ethnic groups. Higher percentages of males than femalesachieved the four benchmark scores within the Asian(44 vs. 37 percent), White (35 vs. 28 percent), NativeHawaiian/Pacific Islander (18 vs. 12 percent), Hispanic(14 vs. 9 percent), American Indian/Alaska Native (14 vs.10 percent), and Black (5 vs. 4 percent) racial/ethnicgroups.Averaged Freshman Graduation RatesThe averaged freshman graduation rate (AFGR) estimatesthe proportion of public high school freshmen whograduate with a regular diploma 2 4 years after starting9th grade. The AFGR for the class of 2008–09 wasRegular diploma recipients are students who meet or exceed the coursework andperformance standards for high school completion established by a state or anotherrelevant authority. Other high school completers who were awarded alternatecredentials such as a certificate of completion or an equivalency credential are notincluded in the AFGR calculations because they are not considered regular graduates.2Executive Summaryix
Figure 4.(Figure 25-1) Averaged freshman graduation rate (AFGR) in public schools, by race/ethnicity and erAmerican Indian/Alaska Native2Race/ethnicityMaleFemaleTotal includes other racial/ethnic groups not shown separately in the figure. The United States total includes all 50 states and the District of Columbia.The rate for American Indians/Alaska Natives excludes students served in schools operated by the Bureau of Indian Education.NOTE: AFGR is an estimate of the percentage of an entering freshman class graduating in 4 years. For 2008–09, it equals the total number of diplomarecipients in 2008–09
Title: Higher Education: Gaps in Access and Persistence Study Author: T. Ross Subject: Higher Education: Gaps in Access and Persistence Study Keywords