Transcription
Stocks versus Bonds: Explaining theEquity Risk PremiumClifford S. AsnessFrom the 19th century through the mid-20th century, the dividend yield(dividends/price) and earnings yield (earnings/price) on stocks generallyexceeded the yield on long-term U.S. government bonds, usually by asubstantial margin. Since the mid-20th century, however, the situation hasradically changed. In addressing this situation, I argue that the differencebetween stock yields and bond yields is driven by the long-run differencein volatility between stocks and bonds. This model fits 1871–1998 dataextremely well. Moreover, it explains the currently low stock marketdividend and earnings yields. Many authors have found that although bothstock yields forecast stock returns, they generally have more forecastingpower for long horizons. I found, using data up to May 1998, that theportion of dividend and earnings yields explained by the model presentedhere has predictive power only over the long term whereas the portion notexplained by the model has power largely over the short term.The dividend yield on the S&P 500 Indexhas long been examined as a measure ofstock market value. For instance, the wellknown Gordon growth model expresses astock price (or a stock market’s price) as the discounted value of a perpetually growing dividendstream:DP -------------- .R–G(1)whereP D R G pricedividends in Year 0expected returnannual growth rate of dividends in perpetuityNow, solving this equation for the expected returnon stocks producesDR ---- G.P(2)Thus, if growth is constant, changes in dividends toprice, D/P, are exactly changes in expected (orrequired) return. Empirically, studies by Fama andFrench (1988, 1989), Campbell and Shiller (1998),and others, have found that the dividend yield onthe market portfolio of stocks has forecasting powerfor aggregate stock market returns and that thispower increases as forecasting horizon lengthens.Clifford S. Asness is president and managing principalat AQR Capital Management, LLC.96The market earnings yield or earnings to price,E/P (the inverse of the commonly tracked P/E),represents how much investors are willing to payfor a given dollar of earnings. E/P and D/P arelinked by the payout ratio, dividends to earnings,which represents how much of current earnings arebeing passed directly to shareholders through dividends. Studies by Sorenson and Arnott (1988), Cole,Helwege, and Laster (1996), Lander, Orphanides,and Douvogiannis (1997), Campbell and Shiller(1998), and others, have found that the market E/Phas power to forecast the aggregate market return.Under certain assumptions, a bond’s yield-tomaturity, Y, will equal the nominal holding-periodreturn on the bond.1 Like the equity yields examined here, the inverse of the bond yield can bethought of as a price paid for the bond’s cash flows(coupon payments and repayment of principal).When the yield is low (high), the price paid for thebond’s cash flow is high (low). Bernstein (1997),Ilmanen (1995), Bogle (1995), and others, haveshown that bond yield levels (unadjusted oradjusted for the level of inflation or short-term interest rates) have power to predict future bond returns.This article examines the relationship between stock and bond yields and, by extension, therelationship between stock and bond marketreturns (the difference between stock and bondexpected returns is commonly called the equityrisk premium). I hypothesize that the relativeyield stocks must provide versus bonds today is 2000, Association for Investment Management and Research
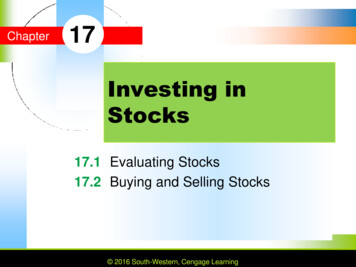
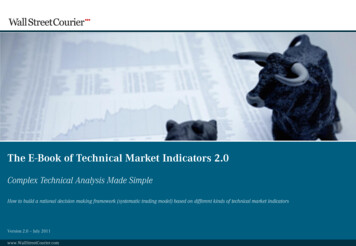
Stocks versus Bondsdriven by the experience of each generation ofinvestors with each asset class.The article also addresses the observation ofmany authors, economists, and market strategiststhat today’s dividend and earnings yields on stocksare, by historical standards, shockingly low. I findthey are not.Finally, I report the results of decomposingstock yields into a fitted portion (i.e., stock yieldsexplained by the model presented here) and aresidual portion (i.e., stock yields not explained bythe model).the late 1990s are not comparable to those of thepast. Although this assertion may have some merit,I will argue that it is largely unnecessary to explaintoday’s low D/P.As did dividend yields, the stock market’searnings yields systematically exceeded bondyields early in the sample period, but as Figure 2shows, since the late-1960s, earnings yields havebeen comparable to bond yields and clearlystrongly related (as are dividend yields, albeit froma lower level).3 Table 1 presents monthly correlation coefficients for various periods between thelevels of D/P and Y and E/P and Y. The numbersin Table 1 clearly bear out what is seen in Figures 1and 2. For the entire period, D/P and Y were negatively correlated because of their reversals; E/Pwas essentially uncorrelated with Y. For the laterperiod, however, stock and bond yields show thestrong positive relationship many economists andmarket strategists have noted.Thus, we are left with several puzzles: Why did the stock market strongly outyieldbonds for so long only to now consistentlyunderyield bonds? Why did stock and bond yields move relativelyindependently, or even perversely, in the overall 1927–98 period but move strongly togetherin the later 40 years of this period? Perhaps most important, why are today’s stockmarket yields so low and what does that factmean for the future?The rest of this article tries to answer these questions.Historical Yields on Stocks andBondsAs far as yields are concerned, 1927–1998 tells a taleof two periods—as Figure 1 clearly shows. Figure 1plots the dividend yield for the S&P 500 and theyield to maturity for a 10-year U.S. T-bond fromJanuary 1927 through May 1998.2 Prior to the mid1950s, the stock market’s yield was consistentlyabove the bond market’s yield. Anecdotally, investors of this era believed that stocks should yieldmore than bonds because stocks are riskier investments. Since 1958, the stock yield has been belowthe bond yield, usually substantially below. As ofthe latest data in Figure 1 (May 1998), the stockmarket yield was at an all-time low of 1.5 percentwhereas the bond market yield was at 5.5 percent,not at all a corresponding low point. This observation has led many analysts to assert that the role ofdividends has changed and that dividend yields inFigure 1. S&P 500 Dividend Yield and T-Bond Yield to Maturity, January 1927–May 1998Yield (%)181614S&P 500 D/P1210864210-Year T-Bond027March/April 20003441485562697683909897
Financial Analysts JournalFigure 2. S&P 500 Earnings Yield and T-Bond Yield to Maturity, January 1927–May 1998Yield (%)1816S&P 500 E/P141210864210-Year T-Bond02734414855626976839098Table 1. Monthly Correlation Coefficients, Various PeriodsPeriodFull (January 1927–May 1998)Early (January 1927–December 1959)Late (January 1960–May 1998)Model for Stock Market YieldsResearchers have shown a strong link betweenaggregate dividend and earnings yields andexpected stock market returns, especially for longhorizons. When stock market yields are high (low),expected future stock returns are high (low). Thispredictability has two possible explanations thatare at least partly consistent with efficient markets(there are many inefficient-market explanations).One, investors’ taste for risk varies. When investorsare relatively less risk averse, they demand less inthe way of an expected return premium to bearstock market risk. Fama and French (1988, 1989),among others, explored this hypothesis. Two, theperceived level of risk can change even if investors’taste for risk is constant.I explore the hypothesis that the perceivedlevel of risk can change (although the two hypotheses are not mutually exclusive). Note that investorperception of long-term risk need not be accuratefor this hypothesis to be true. If investor perceptionof risk is accurate, then the evidence presented heremay be consistent with an efficient market. If investor perception of risk is inaccurate but explains thepricing of stocks versus bonds, then the hypothesis98Correlation ofD/P and YCorrelation ofE/P and Y–0.28–0.23 0.71 0.08–0.49 0.69may be deemed accurate but still pose a dilemmafor fans of efficient markets.Consider a simple model in which therequired long-term returns on aggregate stocksand bonds vary through time. Expected stockreturns, E(Stocks), are assumed to be proportionalto dividend yields, whereas expected bondreturns, E(Bonds), are assumed to move one-forone with current bond yields; that is,E (Stocks)t a b (D/Pt ) εStocks,t ,(3)E (Bonds)t Yt εBonds ,(4)(where a is the intercept, b is the slope, D/Pt isdividend yield at time t, and ε is an error term). Thehypothesis is that b is positive, so expected stockreturns vary positively with current stock dividendyields, and that the ε terms are identically andindependently distributed error terms representing the portion of expected returns not captured bythe model.4Now, I assume that expected stock and bondreturns are linked through the long-run stock andbond volatility experienced by investors. So,E (Stocks)t – E (Bonds)t c dσ (Stocks)t eσ (Bonds)t . (5) 2000, Association for Investment Management and Research
Stocks versus BondsThe hypothesis is that d is positive whereas e isnegative. That is, I assume that the expected (orrequired) return differential between stocks andbonds is a positive linear function of a weighteddifference of their volatilities.5 Although Equations3, 4, and 5 do not represent a formal asset-pricingmodel, they do capture the spirit of allowingexpected returns to vary through time as a functionof volatility. Moreover, they yield empirically testable implications.6Rearranging these equations (and aggregatingcoefficients) produces the following model:D/P γ0 γ1Y γ2 σ (Stocks) γ3 σ (Bonds) εD/P,t . (6)Now, the hypothesis is that γ1 is positive, γ2 ispositive, and γ3 is negative. This model, and theprecisely corresponding model for E/P, is tested inthe following section.7 Other authors (e.g., Merton1980; French, Schwert, and Stambaugh 1987) havetested the link between expected stock returns andvolatility by examining the relationship betweenrealized stock returns and ex ante measures of volatility.8 However, as these authors noted, realizedstock returns are a noisy proxy for expected stockreturns. I believe that linking Equations 3, 4, and 5and focusing on the long term will reveal a clearerrelationship between stock market volatility andexpected stock market returns as represented bystock market yield (D/P or E/P).9Preliminary EvidenceTo investigate Equation 6, I defined a generation as20 years and used a simple rolling 20-year annualized monthly return volatility for σ (Stocks) andσ (Bonds).10 The underlying argument is that eachgeneration’s perception of the relative risk of stocksand bonds is shaped by the volatility it has experienced. For instance, Campbell and Shiller (1998)mentioned (but did not necessarily advocate) theargument that Baby Boomers are more risk tolerant“perhaps because they do not remember the extremeeconomic conditions of the 1930s.” Another exampleis Glassman and Hassett (1999), who argued in Dow36,000 that remembrances of the Great Depressionhave led investors to require too high an equity riskpremium.A 20-year period captures the long-term generational phenomenon that I hypothesized.11 Thehypothesis is inherently behavioral because itstates that the long-term, slowly changing relationship between stock and bond yields is driven by thelong-term volatility of stocks and bonds experienced by the bulk of current investors. Although Ibelieve a 20-year period is intuitively reasonable,given the hypothesis, I am encouraged by the factMarch/April 2000that the results that follow are robust to alternativespecifications of long-term volatility (i.e., from 10year to 30-year trailing volatility) and still showedup significantly when windows as short as 5 yearswere used.The regressions in this section are simple linearregressions that do not account for some significanteconometric problems; for example, the followingregressions have highly autocorrelated independentvariables, dependent variables, and residuals. Butthe goal of these regressions is to initially establishthe existence of an economically significant relationship. Because statistical inference is problematic, Ido not focus on (but do report) the t-statistics. Thefocus is on the economic significance of the estimated coefficients and R2 figures. (Subsequent sections explore the issue of statistical significance andreport robustness checks.)Because I required 20 years to estimate volatilityand the monthly data began in 1926, I estimatedEquation 6 by using monthly data from January 1946through May 1998. Before examining this equationin full, I first examine the regression of D/P on bondyields only and D/P on the rolling volatility of stockand bond markets only for the 1946–98 period (thefirst data points are dividend and bond yields inJanuary 1946 and stock and bond volatility estimated from January 1926 through December 1945;the t-statistics are in parentheses under the equations. The results are as follows:D/P 4.10% – 0.03Y(40.72) (–2.26)(7)(with an adjusted R2 of 0.7 percent) andD/P 2.02% 0.14σ (Stocks) – 0.07σ (Bonds)(11.87) (18.96)(–5.24)(8)(with an adjusted R2 of 43.0 percent).12Equation 7 shows that D/P and Y have a mildlynegative relationship for 1946–1998, similar to whatI found for the entire 1926–98 period (Table 1).Equation 8 shows that a significant amount of thevariance of D/P (note the adjusted R2) is explainedby stock and bond volatility, with D/P rising withstock market volatility and falling with bond market volatility. This relationship is economically significant. An increase in stock market volatility from15 percent to 20 percent, all else being equal, raisesthe required dividend yield on stocks by 70 basispoints (bps). Now, note the estimate for Equation 6:D/P 0.00% 0.35Y 0.23 σ(Stocks) – 0.31σ(Bonds) (9)(–0.05) (28.77) (39.51)(–25.69)(with an adjusted R2 of 75.4 percent).This result supports the hypothesis. The dividend yield is mildly negatively related to the bondyield when measured alone (Equation 7), but this99
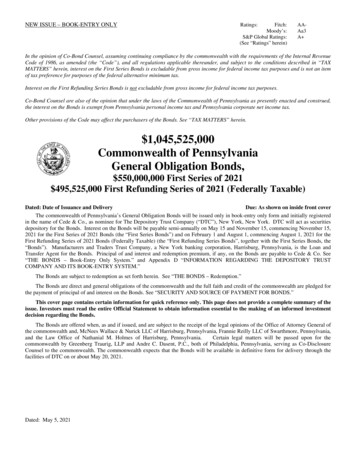
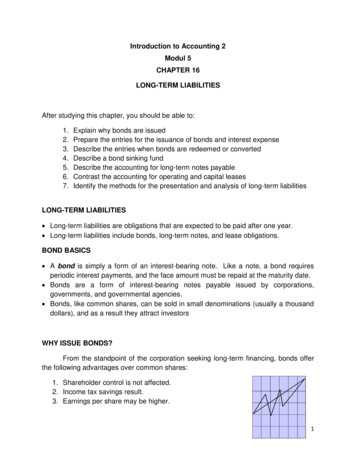
Financial Analysts Journalnegative relationship is a highly misleading indicator of how stock and bond yields covary. When Iadjusted for different levels of volatility, I foundstock and bond yields to be strongly positivelyrelated. My interpretation of this regression is thatstock and bond market yields are strongly positively related and the difference between stock andbond yields is a direct positive function of theweighted difference between stock and bond volatility. Intuitively, the more volatile stocks have beenversus bonds, the higher the yield premium (orsmaller a yield deficit) stocks must offer. In anycase, when volatility is held constant, stock yieldsdo rise and fall with bond yields.Again, these results are economically significant. For example, a 100 bp rise in bond yieldstranslates to a 35 bp rise in the required stockmarket dividend yield, whereas a rise in stock market volatility from 15 percent to 20 percent leads toa rise of 115 bps in the required stock market dividend yield.The fact that stock and bond yields are univariately unrelated (or even negatively related) overlong periods (Table 1) is a result of changes inrelative stock and bond volatility that obscure thestrong positive relationship between stock andbond yields. The reason stock and bond yields areunivariately positively related over shorter periods(e.g., 1960–1998) is because of the stable relation-ship between stock and bond volatility over shortperiods. In other words, a missing-variable problem is not much of a problem if the missing variablewas not changing greatly during the period beingexamined (such as in 1960–1998). The problem ispotentially destructive, however, if the missingvariable varied significantly during the period(such as in 1927–1998).Figure 3 presents the actual market D/P andthe in-sample D/P fitted from the regression inEquation 9. Figure 4 presents the residual from thisregression (actual D/P minus fitted D/P). Fortoday’s reader, perhaps the most interesting part ofFigures 3 and 4 is the latest results. The actual D/Pat the end of May 1998 (the last data point) is 1.5percent, a historic low. The forecasted D/P is alsoat a historic low, however—2.1 percent—which isa forecasting error of only 60 bps.Simply examining the D/P series leads to abelief that recent D/Ps are shockingly low. Theseregressions suggest a different interpretation: Giventhe recent low bond yields and a low realized differential in volatility between stocks and bonds, Iwould forecast an all-time historically low D/P forstocks as of May 1998. The fact that the model doesnot forecast the actual low in dividend yield is notstatistically anomalous (May’s forecast error isabout 1 standard deviation below zero) and may bea result of the stories other authors have cited toexplain today’s low D/P (e.g., stock buy-backsFigure 3. Actual S&P 500 Dividend Yield and In-Sample Dividend Yield,January 1946–May 1998Yield (%)8Actual D/P76543Fitted D/P210465156616671768186919698Note: In-sample D/P fitted from the regression in Equation 9.100 2000, Association for Investment Management and Research
Stocks versus BondsFigure 4. Regression Residual: Actual D/P minus Fitted D/P, January 1946–May 1998Yield (%)3210–1–2–34651566166replacing dividends). But these stories might not beat all necessary. For example, the story of stock buybacks replacing dividends has been around since atleast the late 1980s (Bagwell and Shoven 1989), yetthe average in-sample forecasting error of my modelfor D/P for 1990–1998 is only –9 bps. Apparently,nothing more than Equation 9 is needed to explainrecent low dividend yields.Running a similar regression for E/P, I obtainedthe following result:E/P –1.39% 0.96Y 0.49σ(Stocks) – 0.76σ(Bonds) (10)(–3.70) (27.33) (29.58)(–21.56)(with an adjusted R2 of 64.8 percent). The modelexplains about as much of the variance for earningsyield as dividend yield. As of the end of May 1998,the E/P for the S&P 500 was 3.6 percent, corresponding to a P/E of 27.8. The forecasted E/P fromthe Equation 10 regression is 3.4 percent, or a forecasted P/E ratio of 29.1. Unlike the case for D/P, Iam not (even to a small degree) failing to explainthe recent high P/Es on stocks; rather, one wouldhave to explain the opposite, because according tothe model, the May 1998 P/E of 27.8 is slightly lowerthan it should be.Again, these results are economically significant: The required earnings yield was moving virtually one-for-one with 10-year T-bond yields andincreasing 245 bps for each 5 percent rise in stockmarket volatility (all else being equal). ExaminingFigure 2 and Table 1 shows that E/P and Y werestrongly positively correlated only for the laterperiod of the sample (in the earlier period, theywere actually negatively correlated, and for theMarch/April 2000717681869198whole period, they were close to uncorrelated).When changing stock- and bond-market volatilityis accounted for in Equation 10, however, thestrong positive relationship between E/P and Y isextended to the full period.Critique and Further EvidenceThe regression results presented in the previoussection fit intuition and the hypothesis as formalized in Equation 6, but they are certainly open tocriticism. They are in-sample regression results andare thus particularly open to charges of data mining. They are level-on-level regressions, which renders the t-statistics invalid and makes the high R2figures potentially spurious.13 Worse, they arelevel-on-level regressions that
plots the dividend yield for the S&P 500 and the yield to maturity for a 10-year U.S. T-bond from January 1927 through May 1998. 2 Prior to the mid-1950s, the stock market's yield was consistently above the bond market's yield. Anecdotally, inves-tors of this era believed that stocks should yield more than bonds because stocks are riskier .