Transcription
Research ArticleAssessment of groundwater contamination risk by BTEX from residualfuel soil phaseVictoria Zanello1,2· Leonardo E. Scherger2,3· Claudio Lexow1,2Received: 5 October 2020 / Accepted: 2 February 2021 / Published online: 10 February 2021 The Author(s) 2021 OPENAbstractThe aim of this work is to assess the risk of groundwater contamination associated with BTEX dissolution from fuels as aresidual phase. Numerical simulations of sixty scenarios were carried out with the software HYDRUS 2D/3D. Groundwatercontamination risk was analyzed given the combination of different porous media textures (silt loam, sandy loam andclay), water fluxes (0.5%, 1% or 3% Rainfall), water table depths (1.5, 2.5, 5 or 8 m below ground surface) and biodegradation rate (active or null). Risk was calculated comparing leachate concentrations to the aquifer and limits establishedby an international guideline for human drinking water. In all cases, benzene and toluene had the highest mobility inthe dissolved phase. Contrary, xylene and ethylbenzene tended to concentrate close to the source zone. These twocompounds predominantly concentrated in the solid phase. Calculated risk was proportional to the water flux rate andinversely proportional to the unsaturated thickness. Without biodegradation, in fine-grained sediments risk was veryhigh for shallow aquifers ( 1.5 m depth) and moderate or low for deeper aquifers. However, in sandy loam sedimentsrisk was classified as very high for aquifers up to 8 m deep. When biodegradation was considered, leached concentrations were greatly reduced in the three textures. BTEX concentration in Bahía Blanca City s aquifer showed acceptableagreement with simulated scenarios. The most sensitive parameters to model results were biodegradation foc watertable depth Ks. This study is important for assessing the risks and developing management strategies for fuel contaminated sites.Keywords BTEX · Transport of contaminant · Risk factor · Residual phase · HYDRUS1 IntroductionOne of the most common hydrocarbons contaminationdetected over the years in urban environments is the leakage of gasoline from underground storage tanks, mainlylocated at gas stations [1]. Actions responsible for soil andgroundwater contamination in urban areas can be large.However, oil leaks from gas station are a common fact incities around the world [2]. Leaks produced over the yearsfrom underground hydrocarbon storage system (UHSS)and associated pipes generated a gradual accumulationof hydrocarbons in the unsaturated zone (UZ). Fuel canbe mobilized as a non-aqueous liquid phase (NALP) by theaction of gravity and capillary forces when the accumulated quantity is enough and the porous medium allowsit, until they reach the capillary fringe [3, 4]. However, asthe NALP progresses through the UZ, part of the hydrocarbon is retained in the soil media as a residual phase.NALP in the form of immobile residual contamination, orpools of mobile or potentially mobile NALP, can representcontinuing source of groundwater contamination [5]. Theimmobile hydrocarbon, trapped in the pores, keeps its* Victoria Zanello, victoria.zanello@uns.edu.ar 1Centro de Geología Aplicada, Agua y Medio Ambiente (CGAMA‑CIC‑UNS), Comisiónde Investigaciones Científicas, Bahía Blanca, Argentina. 2Dpto. de Geología, Universidad Nacional del Sur (UNS), Av. Alem 1253,8000 Bahía Blanca, Argentina. 3Consejo Nacional de Investigaciones Científicas y Técnicas (CONICET), CCT Bahía Blanca, Bahía Blanca,Argentina.SN Applied Sciences (2021) 3:307 23456789)
Research ArticleSN Applied Sciences (2021) 3:307 ion with soil water. Interaction of retained hydrocarbon with water generates the partial dissolution of itsconstituents, mainly a group of aromatic organic chemicalcompounds called BTEX (benzene, toluene, ethylbenzeneand xylene) [6]. The dissolved phase is highly mobile, andit is responsible for the transport of contaminant over longdistances from the source [7, 8].Dissolution mass transfer from NALP and immobilizedhydrocarbons is a very complex process and is controlledby many factors such as saturation and distribution offuel, heterogeneity and geochemical properties of porousmedia, soil water content and fluid flow [9, 10]. This manuscript studies the fate and transport of BTEX dissolvedfrom the residual phase and the role of several factors suchas sediment heterogeneity, water table depth, water fluxand biodegradation rate. The focus is to study the role ofUZ properties on the transport of BTEX that have beenretained in the site for the last five years. Numerical simulations of several field scenarios, given the combination ofthe factors described above, were used to assess the riskof groundwater contamination in each case. In addition,a sensitivity analysis was carried out to acknowledge theinfluence of input parameters over model results and riskas proposed by Saltelli [11]. The input parameters considered were: fraction of organic content of carbon in the soil,permeability, water table depth and biodegradation rate.Risk analysis was carried out considering theoreticaldata from three lithologies that can be extrapolated tosites around the world. Lithologies chosen were silt loam,loamy sand and clay. It is well known that contaminantsadsorption is largely regulated by the particle size distribution of the soil. As proposed by Capri et al. [12], the finestparticle sizes have the largest surface area and, therefore, ahigh capacity to retain organic and inorganic compounds.Otherwise, sandy sediments have lower retention capacities. Under this conditions, chemical compounds can travelfurther in the UZ. The model also considers different watertable depths (1.5, 2.5, 5 and 8 m below ground surface).These depths were chosen to represent phreatic aquiferconditions in sites contaminated by hydrocarbons. Manyworks evidenced the importance of considering the fluctuations of the water table [13–18]. When the upward movement of the water level occurs, part of the NALP followsthe rise of the water table, and another part is trappedbelow it, due to a capillary hysteresis that reduces itsmobility. In the opposite direction, when the water leveldrops, the water drains from the porous medium and theNALP agglutinate, increasing their saturation and mobility [19–23]. However, NALP presence as an independentphase was not fixed in the model, so groundwater levelwas considered steady.The scenarios resulting from the combination of subsoil textures and water table depths were doubled, toVol:.(1234567890)analyse maximum and null biodegradation in transport.The real value of biodegradation rate of BTEX compoundsis difficult to obtain so two extreme cases were considered. Aerobic and anaerobic hydrocarbon biodegradationrates have been determined in many studies using laboratory microcosms, in situ field microcosms, and observedhydrocarbon concentration distributions at sites undergoing natural attenuation [24]. The rate of dissolution from anon-aqueous phase has been studied in laboratory experiments [25] and in numerical studies at the pore scale [26,27] and field scale [28–30].Petrol is composed of various hydrocarbons, the groupof monoaromatics BTEX makes up 18% of these fuelsapproximately. These compounds are found in gasoline,constituting a large part of its soluble fraction. BTEX arethe most soluble part of gasoline, thus environmentalproblems associated with gasoline directly involves thestudy of these substances [31]. BTEX percentages found ingasolines may vary depending on the country and refiningmethods. Generally, is considered that a 2nd grade gasoline is composed of 1.2% benzene, 1–5% ethylbenzene,5–10% toluene and total xylene. Leusch and Bartkow [32]informed the volume of each BTEX in the gasoline as 1%benzene, 5% toluene, 1% ethylbenzene and 7% xylenes.The novelty of this study is the assessment of BTEXtransport from the residual phase in the UZ. As mentioned above, hydrocarbon leaks from UHSS are common,but NALP need time to move as an individual phase andbe detected. If the contamination is already present andremediation is carried out, the residual phase is the mostdifficult to remove from the soil, as it represents a continuous source of contaminant. If the hydrocarbons are notyet detected, the model can be used as a method to predict the behavior of different organic compounds in thesoil over time. In recent decades, many transport modelshave been developed to simulate specific environmentalprocesses under certain environmental conditions, on alaboratory and field scale. This includes modeling vertical transport of contaminants in the UZ [33–37], assessment of migration risks to aquifers [38, 39] and transport inaquifers [37, 40]. Valsala and Govindarajan [41] carried outa numerical investigation into the interaction of variousBTEX transport processes in groundwater. Farahani andMahmoudi [42] used HYDRUS software to solve environmental problems associated with hydrocarbons contamination. Most of the existing works on the subject simulateBTEX transport through the direct and total dissolutionfrom the pollutant source or NALP. However, a numericalmodel for BTEX transport derived from residual fuel inunsaturated conditions have not been applied yet.The aim of this work is to assess the risk of groundwatercontamination associated with BTEX dissolution from fuelsas a residual phase. The application of the methodology
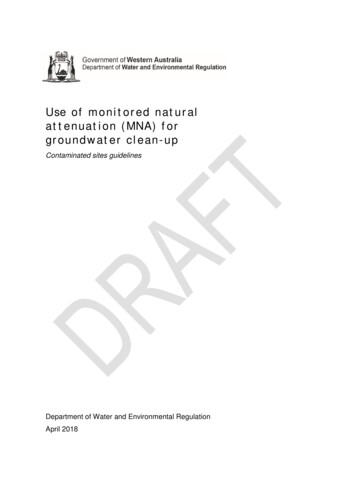
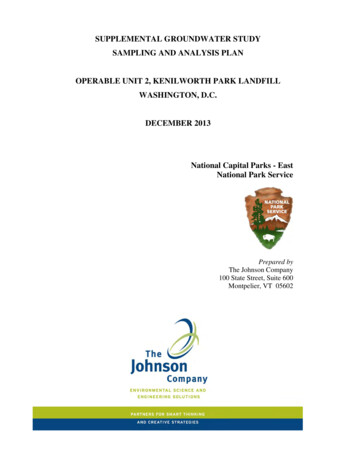
SN Applied Sciences (2021) 3:307 https://doi.org/10.1007/s42452-021-04325-wwill allows to verify the use of the HYDRUS 2D/3D software in the simulation of BTEX dissolved from the residualphase.1.1 Study areaThe city of Bahía Blanca is located in the southwesternarea of Buenos Aires, Argentina, approximately at 38 43′′South Latitude and 62 16′′ West Longitude. The generallandscape of the city is comprising three main geomorphological units: plateau, colluvium-alluvium and tidalplain [43]. Figure 1 shows geomorphological units andthe location of monitoring wells. These wells are locatedin gas stations that have reported leaks from their UHSSin the past. Behalf, remediation task have been applied toremove the NALP, groundwater still shows concentrationsof BTEX. Thus, these gas stations are a good example toevaluate the mobility of BTEX dissolved from residual fuelphase.The plateau is composed of silt loam sedimentsenriched in calcium carbonate corresponding to thePampeano Formation. The alluvial cones originated byfluvial action have great extension, and their coalescencemakes them look topographically as alluvial plains. Thecolluvium-alluvium complex is made up of fine sandwith an abundant clayey matrix. On top of this, mediumResearch Articlesized sands with calcareous cement were deposited andtogether they form the Bahía Blanca Formation. Below the20 m level, the alluvial plain of the Napostá stream is present and continues toward the southeast with an old tidalplain, now emerged mainly composed of clayey materialfrom the Maldonado Formation [43].In the plateau area, residential land use predominates,while the greatest urban settlement is on the alluvial plain.The port, industrial and residential activities of IngenieroWhite are located on tidal plain [44].The phreatic aquifer of the city is characterized by different hydrogeological conditions due to the importantformational variations of the subsoil. In general, it is composed by medium to fine calcareous sands, friable andwithout stratification that alternate with coarse sandsand gravels, corresponding to the Bahía Blanca Formation.Hydrologically, this unit behaves like a shallow aquifer withgood permeability and specific variable flows between 0.5and 5 m3/h per meter of depression. From the hydrochemical point of view, the water from the phreatic aquifer isclassified as sodium chloride to sodium chloride sulfate[45]. Soluble salts are freely mobilized in the unsaturatedprofile, mostly linked to upward vertical water flows, wherethe position of the water table exerts an effective controlon the hydrodynamics of the unsaturated system [46].Depth of the water table in Bahía Blanca is between 3 andFig.1 Ubication map withgeomorphological zones andlocation of monitoring wellsVol.:(0123456789)
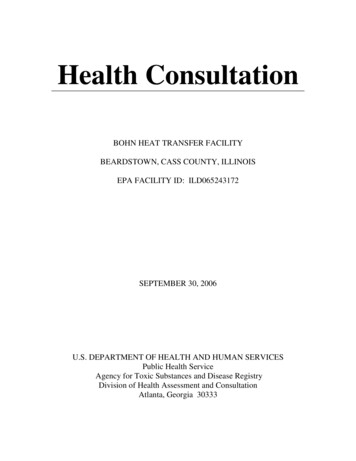
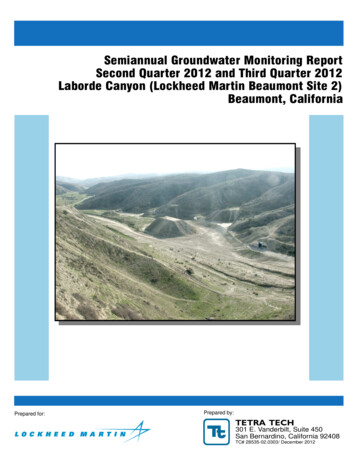
Research ArticleSN Applied Sciences (2021) 3:307 https://doi.org/10.1007/s42452-021-04325-w5 m according to the season and the annual alternation ofrainfall cycles [47].2 Model descriptionTheoretical model was divided into three steps (Fig. 2). Initially, according to real data from fuel leaks, widely knownformulas were applied to calculate BTEX concentrationsin the dissolve, volatile and solid phase. Next, the HYDRUS2D/3D [48] software was used to execute sixty simulationsand model BTEX transport in each of these scenarios.Finally, the maximum concentrations leached to the aquifer in each scenario were highlighted and compared withan international guide to calculate the risk factor.2.1 Step 1: theoretical frameworkThe spatial arrangement of BTEX in the subsoil, can beexpressed by the places that they can occupy. If we consider the presence of hydrocarbons in the soil volume, thetotal porosity (n) can be expressed as:n nw na nH(1)where nw is volumetric water content (-), na is volumetricair content (-), and nH is residual hydrocarbons in the soil(-).The capacity of soil to contain hydrocarbons in thedissolve, volatile and solid phases is finite. The maximumcapacity can be estimated by the soil saturation concentration (Csat):) ()() (()nanwmg S H Kd S (2)Csat S 𝜌𝜌kgwhere S is water effective solubility for each compound(mg/L), ρ is soil bulk density (kg/L), H’ is Henry’s Law constant (-), and Kd is partitioning coefficient for soil–watersolution (L/kg).When the hydrocarbon content is kept below Csat, theywill distribute between the dissolve, volatile and solidphases. Thereby, mobile NALP will be absent. Otherwise,if the saturation content is exceeded, mobile NALP will bepresent within the three described phases above. Thus, ifhydrocarbons are present as a residual phase without thepresence of a mobile NALP, maximum concentration ofcompounds in each soil phase can be expressed as:Cw S nw(3)Ca S H na(4)Vol:.(1234567890)Fig. 2 Theoretical model of work development
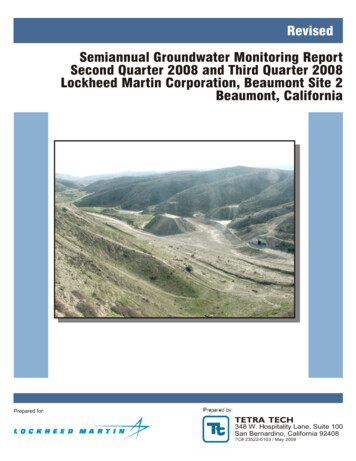
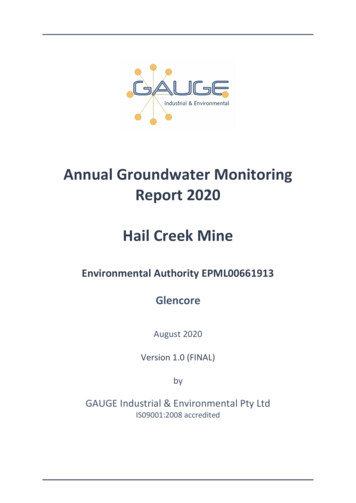
SN Applied Sciences (2021) 3:307 https://doi.org/10.1007/s42452-021-04325-wCS S Kd(5)where Cw is soil water concentration (mg/L), Ca is soil airconcentration (mg/L), and Cs is adsorbed concentration insoil media (mg/kg).Effective solubility (S) of an organic substance in a mixturecan be calculated using Raoult’s law [49]. Estimation consistsof multiplying molar fraction (MF) of the compound in themixture by solubility of pure substance (S0).S SO MF(6)Henry’s Law explained volatilization process [50].Water–air partitioning coefficient (Kh) is represented by:Kh Kh R T(7)where Kh′ is Henry’s Law constant for each compound (atm.m3/mol), R is the universal constant of gases (atm.m3/mol.K 1), and T is temperature ( K).Soil–water partitioning coefficient (Kd) can be estimatedfrom partition coefficient in organic carbon (Koc) (ml/g)and fraction of organic content of the soil (foc). If adsorption effect of pollutant on the finest fraction of the soil isdiscarded [51], Kd is normally expressed by the relationship:Kd Koc Foc(8)Research ArticleKoc is related to the octanol partition coefficient (Kow),which can be estimated experimentally in laboratory foreach contaminant [52].In aerobic environments, fuel biodegradation cangenerate large decreases in concentrations. Biodegradation processes can be explained mathematically according to a first-order decay model as:C2 C1 e tk(9)where C1 is initial concentration in soil (mg/kg), C2 is actualconcentration in soil (mg/kg), k is biodegradation firstorder decay constant (1/d), and t is time (d).The conceptual transport model for BTEX dissolvedfrom a residual phase is illustrated in Fig. 3. Simulationof BTEX can be carried out under the following premises:(1) Hydrocarbons as a residual phase is constant in timeand space. This condition is feasible at gas stations,where leaks of small proportions tend to be generated over long continuous periods.(2) Maximum BTEX concentration in soil water wouldcorrespond to the maximum soil water retentioncapacity. This volumetric water content is equal tofield capacity. Hydrocarbons will occupy the largestpores while water will occupy the smaller ones.Fig. 3 Conceptual model ofBTEX transport in the UZ fromthe dissolution of residual fuelphaseVol.:(0123456789)
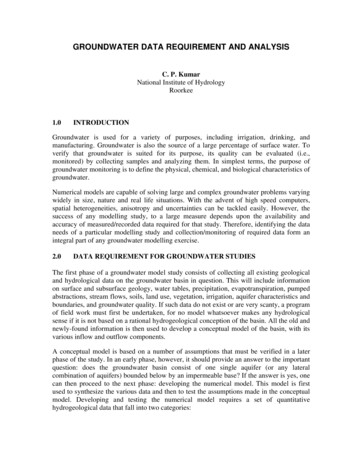
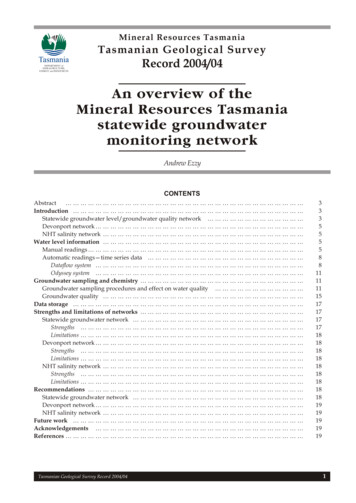
Research ArticleSN Applied Sciences (2021) 3:307 https://doi.org/10.1007/s42452-021-04325-w(3) Dissolved BTEX concentration in soil water is at equilibrium with the residual phase, being equal to thesaturation concentration (Csat).(4) BTEX are transported by water flow that moves downwards the damping depth.(5) Soil media is vertically and laterally homogeneous.2.2 Step 2: Numerical simulationTransport simulation was performed by HYDRUS 2D/3Dsoftware [48]. Mathematical code is an executable software in Windows domain; widely use in water flow andsolute transport simulation in saturated and unsaturatedsoil media. The software allows resolution of modifiedRichards Eq. (10) for water flow and convection–dispersionEq. (11) for solute transport. Similarly, the procedure couldbe applied in the freeware 1D software version.[ ()] 𝜃 h KizAK KijA (10) t xi xjwhere θ is volumetric water content (-), h is pressure head(cm), xi (i 1,2,.,n) are spatial coordinates, t is time (d), KizAare components of a dimensionless anisotropy tensor y Kis unsaturated hydraulic conductivity (cm/d).())( 𝜃c 𝜌S na g c g gna Dij 𝜃Dijw t t t xi x xi x qC kw 𝜃C kg na ks 𝜌S x(11)Fig. 4 Spatial dimensions andboundary condition used insimulationsVol:.(1234567890)where c, S and g are solute concentrations in liquid (mg/L),solid (mg/kg) and gaseous (mg/L) phases, respectively. Qis the volumetric flux density (cm/d), kw, kg y ks are firstorder rate constants for solutes in liquid, solid and gasphases (1/d). ρ is bulk density (kg/L), na is volumetric airgcontent (-), θ is volumetric water content (-), and Dijw y Dijare dispersion coefficient tensor ( cm2/d) for the liquidphase and diffusion coefficient tensor (cm2/d) for the gasphase, respectively.To solve Richard’s equation, the following constitutiverelationships are required. Van Genuchten [53] proposedsuch relations as given in Eqs. (12) and (13):Se [] m𝜃 𝜃r 1 (𝛼h)n𝜃s 𝜃r[()m ]21K (Se) KsSel 1 1 Se m(12)(13)where Se is effective water saturation (-), θr is residualwater content (-), θs is saturated water content (-). α ha 1is related to the inverse of the air-entry suction (cm 1), his tension head (cm), n and m are empirical parametersm 1–1/n (-). Ks is saturated hydraulic conductivity (cm/d),and l is pore connectivity parameter in the hydraulic conductivity function (-), estimated to be about 0.5 as an average for many soils [54].A 2D numerical domain was created to simulate waterflow and BTEX transport in the UZ. Vertical length wasconsidered as the distance between the lower limit ofsoil affected by leaks and the position of the water table.The upper boundary was defined as a time-variable flux
Research ArticleSN Applied Sciences (2021) 3:307 n, and the lower boundary was considered asa constant pressure head condition (h 0 cm). Lateralboundaries were considered as no flux condition (Fig. 4).The initial water content was estimated as field capacityfor each lithology.To evaluate diverse scenarios, sixty (60) simulationswere performed. Different combinations of water fluxes,sedimentary materials, water table depths and the occurrence of biodegradation during transport were evaluated.The time considered in the simulation was five years sinceit is an appropriate period between the occurrence of fuelleak in UHSS and the consequent detection of BTEX ingroundwater. BTEX dissolve phase source was set at onemeter depth from the surface in all scenarios. Affected areawas considered as 1m2. Water flow was considered as theflux that moves downwards from the damping depth.Rainfall values considered are from Bahía Blanca (Argentina) for the period January 2013 to December 2018. Dailyprecipitation was obtained from a meteorological stationof the Argentine National Meteorological Service. Theaverage rainfall value was 580 mm/year during the period1908–2008 [55]. Carrica and Lexow [56] determined thatthe average recharge in the basin varies between 7.5%and 11% of rainfall (R). Since gas stations commonly havewaterproofed surfaces, it is difficult to estimate the actualrecharge rate. Thus, three potential recharge rates weretaken as an approximation: 0.5% R, 1% R and 3% R.Three types of sediments from Bahía Blanca subsoilwere evaluated: silt loam, loamy sand and clay (Table 1).Samples were collected in field by a helical drill fortextural analyses and by core method [57] for bulk density determinations. Sediments correspond to threesubsoils that differ in textural and physicochemical characteristics. The textural analysis was done with the pipetting technique [58]. Hydraulic parameters of each material were obtained from Rosseta pedotransfer function[59], based on soil texture and bulk density. Rosseta wasobtained from a large number of soil hydraulic data andsoil properties from three worldwide databases. Totalorganic content of sediments was determined using adry combustion technique [60].Groundwater contamination by BTEX is expected tobe greater in areas where the water table is closed tothe surface and minor in basins where aquifers are deep.To verify the effects of vadose zone thickness over BTEXtransport, four position of the water table were considered (1.5, 2.5, 5 and 8 m below ground surface).Longitudinal dispersivity (DL) was calculated according to the following equation [61]:DL 0.83L2.414(14)where L is the vertical distance in the flow domain.Transverse dispersivity (D t) was considered as 10% ofDL. The increase of dispersivity with increasing travel distance in soils agrees with reported dispersivities measurements in groundwater tracer studies [62]. The solutetransport parameters used in the model for each BTEXare present in Table 2:Table 1 Hydraulic and physicochemical characteristics of the sedimentary materials evaluatedTextural ClassificationSilt loamLoamy sandClayTexture (%)SandSiltClay3083953163317158ρ 00690.0470.0171.582.041.2911.2121.613.93Ks (cm/d)afρ: bulk density, bTOC: total organic carbon, cθr: residual water content, dθcc: field capacity volumetric content, eθs: saturated water content,α ha 1 is related to the inverse of the air-entry suction, gn: porosity distribution index, hKs: saturated hydraulic conductivityTable 2 Solute transportparameters used in neWater diffusion c oefficientaGas diffusion c oefficientaOctanol–water partitioning c oefficientbEffective solubilityHenry’s constantcFirst-order biodegradation for water, airand solid 31ga[63]. bModified from [64].cModified from [65]. d[66] f [67]. g[68]Vol.:(0123456789)
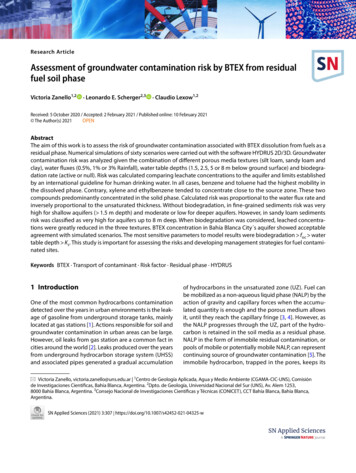
Research ArticleSN Applied Sciences (2021) 3:307 https://doi.org/10.1007/s42452-021-04325-w2.3 Step 3: groundwater contamination riskassessment2.5 Sensitivity analysisTo assess the risk of groundwater contamination, maximumconcentration leached to the aquifer for each BTEX werecompared with the limits established by the EnvironmentalProtection Agency–United States [69] for drinking water. Thepotential risk factor (Rf) of groundwater contamination canbe defined as:Rf CmaxClimit(15)where Cmax is the maximum concentration of each BTEXleached into the aquifer during simulations, and Climit is theconcentration established by the international guideline[69]. Cmax value was established according to solute flux atthe bottom boundary in HYDRUS 2D/3D software. Accordingly, groundwater contamination risk is calculated for themaximum solute mass leached into the aquifer, equal to:BTEXmass Cmax Recharge rate(16)Guideline has a limit value of 0.005 mg/L, 1 mg/L,0.7 mg/L and 10 mg/L for benzene, toluene, ethylbenzeneand xylene, respectively. Risk categories were defined as:very high when Rf exceeds 1, high when it is between 1 and0.67, moderate if value is from 0.66 to 0.34 and low between0.33 and 0.01 of limit concentration. When Rf value was lessthan 0.01, risk was considered null. Risk categories wereestablished by dividing the EPA drinking water limit for eachcontaminant into thirds [39].2.4 Model validationTo validate the model, comparisons were made betweensimulated and observed concentrations of BTEX in groundwater. Recorded data were obtained from environmentalreports from Bahía Blanca Government. BTEX concentrationwas monitored in wells from gas stations in the year 2013.Wells were chosen according to the lithology and the depthof the water table. The Mean Absolute Error (MAE) was usedto assess model validation, according to the formula proposed by Stauffer and Seaman [70]:MAE n Xi Xisim ni 1where Xi corresponds to real values, Xi sim corresponds tosimulated values, and n is the number of dates.Vol:.(1234567890)A systematic sensitivity analysis (SA) was carried out toevaluate the parameters contribution to modeled results[11]. The SA was based on several simulation run over thesame temporal period by increasing and decreasing individual parameters while fixing other input parametersconstant. The magnitude of change of maximum concentration of BTEX leached into the aquifer was used todetermine the sensibility of output to variations in eachparameter. The input parameters analyzed were biodegradation rate, soil organic carbon fraction, saturated hydraulic conductivity, and water table depth.3 Results3.1 Dissolved phase behaviorDistribution of BTEX in the dissolved phase varies depending on lithology as well as the UZ thickness considered.Figures 5 and 6 show the behavior in depth of dissolvedcontaminants for two types of sediments: silt loam andloamy sand. Results are shown for vertical transport distances of 0.50, 1.50 and 3.50 m, respectively (t 1278 days).Silt loam has low saturated hydraulic conductivity(0.1 m/d) and medium to high organic content (0.76%TOC). Saturation concentrations, calculated accordingto step 1, are 33.5 mg/L benzene, 33.4 mg/L toluene,95.9 mg/L ethylbenzene and 167.9 mg/L xylene. Theseconcentrations represent the maximum capacity that soilwater could dissolve, without generation of NALP as anindependent phase. Figure 5 shows concentration profilesfor dissolved phase in silt loam sediment. Compoundsmigrate to greater depths when biodegradation was notconsidered, increasing the risk of groundwater pollution.The most mobile substances are benzene and toluene.Ethylbenzene and xylene are mainly concentrated nearthe source zone. These compounds have Kd values up to10 times greater than benzene and toluene. When biodegradation process was considered, dissolved concentrationsare notably reduced. After three years simulation, BTEX didnot reach phreatic aquifer.In contrast, loamy sand sediments have high hydraulic conductivity (1.21 m/d) and very low organic content(0.072% TOC). Saturation concentrations are 6.8 mg/Lbenzene, 10.5 mg/L toluene, 10.9 mg/L ethylbenzeneand 19 mg/L xylene. Since water retention capacity ofloamy sand is low, capacity of BTEX to dissolve from fueldecrease. Figure 6 shows concentration profiles for thedissolved phase in the loamy sand sediment. When biodegradation was not considered, all compounds reachedthe aquifer regardless of the UZ thickness. The maximum
SN Applied Sciences (2021) 3:307 https://doi.org/10.1007/s42452-021-04325-wResearch ArticleFig. 5 Concentration profilesfor BTEX dissolved phase insilt loam sediment. Simulations are shown with activebiodegradation and non-activebiodegradation for three vertical transport distances: a 0.50,b 1.50 and c 3.50 m below thepolluting sourceconcentrations leached were generated in shallow aquifers, decreasing with an unsaturated thickness increase.When biodegradation was considered, dissolved concentrations were reduced. Anyway, toluene continued leaching into the aquifer in considerable quantities.The last sediment analyzed corresponds to a clayey soil,which has low hydraulic conductivity (0.14 m/d) and highorganic content (1% TOC). Like silt loam, BTEX mobility waspoor. Figure 7 shows the variation of BTEX concentrationover time for different depths from the source zone. Theanalysis carried out in this lithology was different due tothe low mobility of the compounds. Observation nodeswere placed at 0.30 m below the source (Fig. 7a), 0.90 mbelow the source, depth that correspond to the upperlimit of the capillary fringe (Fig. 7b) and 1.50 m below thesource, corresponding to the water table (Fig. 7c). Sediment saturation concentrations are: 42 mg/L benzene,45 mg/L toluene, 110 mg/L ethylbenzene and 193 mg/Lxylene.Only toluene reached the water table, when maximumbiodegradation was considered. However, concentrationsleached are very low. When biodegradation was not considered, ethylbenzene and xylene did not reach the watertable, being adsorbed close to the source. Benzene andVol.:(0123456789)
Research ArticleSN Applied Sciences (2021) 3:307 https://doi.org/10.1007/s42452-021-04325-wthe influence of unsaturated thickness, two water tablepositions were considered, 1.5 m (Fig. 8a) and 4 m (Fig. 8b)below ground surface. Results corresponded to scenarioswhen water flux was equal to 3% Rainfall. BTEX adsorptionis sim
by many factors such as saturation and distribution of fuel, heterogeneity and geochemical properties of porous media, soil water content and uid ow [9 , 10]. This man-uscript studies the fate and transport of BTEX dissolved from the residual phase and the role of several factors such as sediment heterogeneity, water table depth, water ux