Transcription
Annual Groundwater MonitoringReport 2020Hail Creek MineEnvironmental Authority EPML00661913GlencoreAugust 2020Version 1.0 (FINAL)byGAUGE Industrial & Environmental Pty LtdIS09001:2008 accredited
DOCUMENT CONTROLDOCUMENT HISTORY AND STATUSDocument Name:GAUGE (2020) Annual Groundwater Report 2020 for Hail Creek Mine. Glencore. Gauge Industrial &Environmental Pty Ltd. August 2020.Document Location:D:\\ \Glencore\Hail CreekProject manager:Mike Ferguson (Gauge Industrial & Environmental Pty Ltd)Client:Hail Creek Mine, GlencoreClient contact(s):Dakota BrownDistribution:Dakota BrownREVISION RECORDRevReason for issueDateIssuerChecked0.1Draft (internal review)18th Aug 2020M FergusonS Lewer0.2Draft (client review)24th Aug 2020M FergusonD BrownC WilsonT Sheppard1.0Final (after approval)16th Sep 2020M Ferguson-LIMITATIONSThis report has been prepared solely for the benefit of 'the client'. Gauge Industrial & EnvironmentalPty Ltd (GAUGE) accepts no liability for the use or interpretation of any information within this reportfor any purpose other than the intended use, or for its use by any party other than the client. Inpreparing this report, GAUGE has relied upon and presumed accurate data provided by the client orassociated entities. No guarantee, whether express or implied, is made with respect to the datareported or the findings or conclusions expressed in this report. Copying this report, in whole or inpart, without the permission of the client or GAUGE, is not permitted.iGlencore Hail Creek Mine – Annual Groundwater Report 2020
EXECUTIVE SUMMARYGroundwater levels and quality at Hail Creek Mine in 2019/2020 were reviewed in comparison withthe proposed trigger values in the mine’s Environmental Authority (EA), the ANZECC (2000) stockwatering guidelines for beef cattle, and historical data dating back to October 2013.Groundwater levels in the alluvium bores have declined since 2013, correlating with a decline in thearea’s residual rainfall that recharges the alluvium aquifer. Between 2016 and 2019, the average 12month drawdown ranged between 0.42 m and 1.69 m. In the 2019/2020 reporting year, the maximum6-month drawdown was 1.1 m in GWMB32, which was within the proposed EA trigger of 2 metresdrawdown per six-month period.Water quality was generally within acceptable concentrations and proposed EA trigger values,although some analytes, namely salinity (EC and TDS) in GWMB14A and dissolved iron in GWMB13A,were above proposed EA triggers.Salinity in bore GWMB14A has gradually increased since 2014 and is now similar to the ANZECC stockwatering guideline.Iron in GWMB13A shows high variability which appears more related to sampling variability ratherthan a change in the aquifer.Total Petroleum Hydrocarbons in the C10 – C36 fraction were detected in Bore GWMB32 in January2020; however, the bore was near dry and not able to be sampled subsequently to confirm theresult.Continued monitoring of groundwater levels and quality, as per the EA conditions, is recommended.iGlencore Hail Creek Mine – Annual Groundwater Report 2020
Table of ContentsEXECUTIVE SUMMARY . I1.OBJECTIVE & SCOPE. 42.INTRODUCTION . 42.12.22.32.1Background. 4Environmental Values . 4Groundwater Hydrology. 4Groundwater Monitoring Network . 73.GROUNDWATER LEVELS . 94.WATER QUALITY AND COMPARISON TO PROPOSED EA TRIGGERS . 134.1Monitoring and Analysis . 134.2Analytes Monitored and Trigger Values . 134.3Results . 144.3.1pH . 144.3.2Salinity and Major Ions . 144.3.3Nutrients. 144.3.4Metals . 144.3.5Petroleum Hydrocarbons . 155.CONCLUSIONS AND RECOMMENDATIONS . 156.REFERENCES . 16APPENDIX A – WATER QUALITY PLOTS . 17APPENDIX B – GROUNDWATER MONITORING DATA . 41LIST OF TABLESTable 1 – Groundwater Level (mBGL) . 9Table 2 – Proposed Groundwater Contaminant Trigger Levels . 13Table 3 – Water Quality – Laboratory Analysis . 42Table 4 – Water Quality – Field Measurements. 44LIST OF FIGURESFigure 1 – Hail Creek Syncline Cross-section . 5Figure 2 – Hail Creek Syncline Stratigraphic Column . 6Figure 3 – Hail Creek Mine site plan with location of Alluvial Groundwater bores . 8Figure 4 – Groundwater levels (mbgl) in comparison to Cumulative Mass Residual Rainfall. 11Figure 5 – Long term Monthly and Cumulative Mass Residual Rainfall at Nebo and Moranbah BOMStations . 12Figure 6 – pH (Laboratory) . 18Figure 7 – pH (Field) . 19Figure 8 – Electrical Conductivity (Laboratory) . 20Figure 9 – Electrical Conductivity (Field) . 21Figure 10 – Total Dissolved Solids . 22iiGlencore Hail Creek Mine – Annual Groundwater Report 2020
Figure 11 – Carbonate Alkalinity . 23Figure 12 – Bicarbonate Alkalinity. 24Figure 13 – Sulfate . 25Figure 14 – Calcium . 26Figure 15 – Magnesium . 27Figure 16 – Chloride . 28Figure 17 – Sodium . 29Figure 18 – Potassium . 30Figure 19 – Phosphate . 31Figure 20 – Nitrate. 32Figure 21 – Aluminium (dissolved) . 33Figure 22 – Antimony (dissolved) . 34Figure 23 – Arsenic (dissolved) . 35Figure 24 – Iron (dissolved) . 36Figure 25 – Mercury (dissolved) . 37Figure 26 – Total Petroleum Hydrocarbons (C6 – C9) . 38Figure 27 – Total Petroleum Hydrocarbons (C10 – C36) . 39iiiGlencore Hail Creek Mine – Annual Groundwater Report 2020
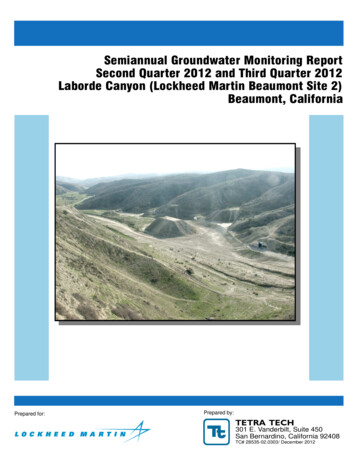
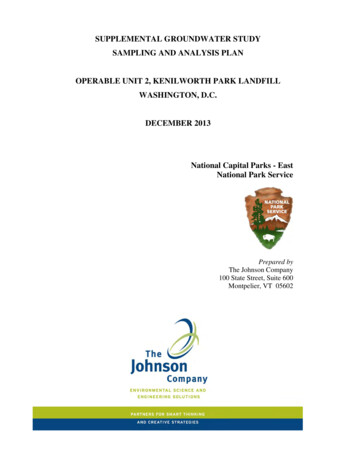
1. OBJECTIVE & SCOPEThis annual alluvial groundwater monitoring report has been completed to determine Hail CreekMine’s compliance against the site’s Environmental Authority (EA) (EPML00661913) groundwaterconditions (see Attachment).This report reviews groundwater quality data obtained in the 12 months between Aug 2019 and July2020, and makes comparison with data dating back to 2013.2. INTRODUCTION2.1BACKGROUNDHail Creek Mine (HCM) is an open cut coal mine located on the Hail Creek Mining Lease (ML4738) inthe Bowen Basin approximately 100km west of Mackay, Queensland. Construction of HCMcommenced in December 2001 with production of coal first occurring in August 2003.Coal is mined by conventional open-cut strip-mining methods prior to crushing and washing in theCoal Handling and Preparation Plant (CHPP). Mining activity is progressing from west to east towardsHail Creek in two strips simultaneously with mining of the upper Elphinstone Seam, preceding miningof the underlying Hynds Seam. Interburden and overburden are used to infill mined areas ordeposited in spoil piles and out-of-pit dumps. CHPP rejects are disposed of within the spoil dumpsand fines within an emplacement facility. HCM has commenced mining operations east of Hail Creekin an area known as ‘The Eastern Margin’. Mining in the Eastern Margin consists of two pits: Exevaleand Carrinyah pits (north to south). The Eastern Margin will be mined using conventional truck andshovel methods.2.2ENVIRONMENTAL VALUESThe Environmental Protection (Water) Policy 2009 for the Fitzroy River Sub-basin outlines waterquality objectives to enhance or protect environmental values, and applies to all surface andgroundwaters draining to the sub-basin of the Fitzroy River (DEHP, 2013a).HCM lies within the Central Tributaries sub-catchment of the Isaac River sub-basin (DEHP, 2013b). Asper the Fitzroy Basin Groundwater Zones Plan (WQ1310), there is insufficient information to derivegroundwater chemistry zone profiles for the area in which HCM is located (DEHP, 2013c).2.3GROUNDWATER HYDROLOGYThe HCM operations are located on the eastern and western margin of the Hail Creek Syncline whichcontains sedimentary strata of Permian and Triassic age, with a thin cover of Quaternary alluvialstrata. The syncline trends south-southeast with an axis coincident with the alignment of Hail Creek(Hail Creek, 2017).The stratigraphic sequence in the Hail Creek Syncline is shown in Figure 1 and Figure 2, and isdescribed in Hail Creek (2017) as:4Glencore Hail Creek Mine – Annual Groundwater Report 2020
Quaternary alluvium consisting of clay, sandy clay and palaeochannels of sand and gravel.The extent of the alluvium is limited to narrow corridors along watercourses within the HailCreek Syncline. The alluvium is not considered to be a significant aquifer, as it is depleted inseveral locations during the dry season. The Rewan Group of Early Triassic age which consists of lithic sandstone, pebbly lithicsandstone, green to reddish brown mudstone and minor volcanilithic pebble conglomerate(at base). Rewan Group sediments were deposited in a fluvial-lacustrine environment. The Blackwater Group of Late Permian age, the component formations which are: oThe Rangal Coal Measures characterised by calcareous sandstone, calcareous shale,mudstone, coal, concretionary limestone. The Rangal Coal Measures hosts theeconomic seams mined at HCM;oThe Fort Cooper Coal Measures which consist of lithic sandstone, conglomerate,mudstone, carbonaceous shale, coal, tuff and tuffaceous (cherty) mudstone;overlying;oThe Moranbah Coal Measures which include labile sandstone, siltstone, mudstone,coal and conglomerate.The Early to Late Permian Back Creek Group, a sedimentary sequence of siliciclastic rocksincluding quartzose to lithic sandstone, siltstone, carbonaceous shale, minor coal and sandycoquinite.Figure 1 – Hail Creek Syncline Cross-section5Glencore Hail Creek Mine – Annual Groundwater Report 2020
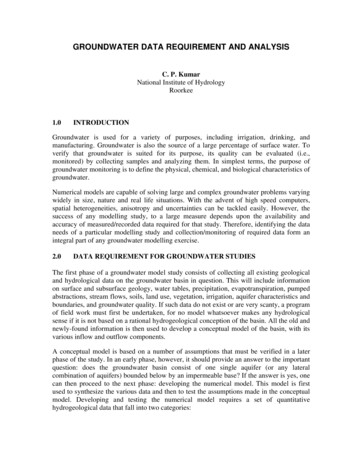
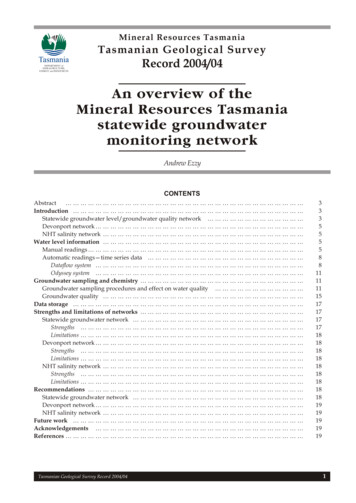
Figure 2 – Hail Creek Syncline Stratigraphic ColumnThe conceptual hydrogeological model developed by Douglas Partners (2015) recognises twogroundwater systems at the HCM operations: deep aquifers within coal seams underlying Permian to Triassic Strata; anda shallow aquifer within pockets of the saturated Quaternary alluvium.6Glencore Hail Creek Mine – Annual Groundwater Report 2020
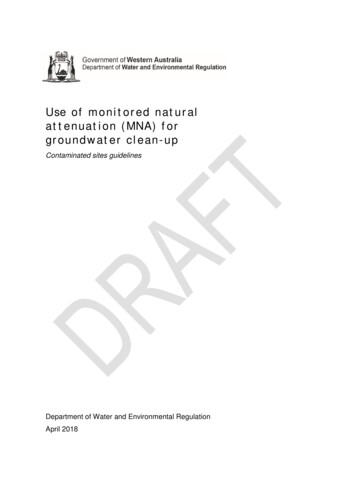
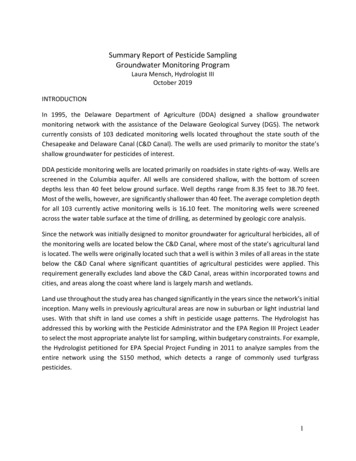
Strata of the underlying Permian to Triassic strata host groundwater resources, primarily within coalseams.The Permian aquifers: are characterised by low permeability and storage where water is predominantly stored andtransmitted via secondary porosity features such as fractures, faults, discontinuities of therock mass, and though coal cleat; are confined by the lower permeability host rock matrix; contain poor quality (brackish) groundwater; and are poorly recharged due to low permeability confining strata.Groundwater can potentially be found within the alluvium associated with surface water featuressuch as Hail and Brumby creeks and their tributaries. These sediments within the alluviums aregenerally quite thin and poorly developed across the mining lease. Typically, the alluvial aquifer ischaracterised by: pockets of reasonable quality groundwater with low yields;discontinuous extent and shallow thickness; andmoderate permeability and storage.Given the above, the alluvial aquifer areas associated with the HCM lease are not considered to be aviable groundwater resource.Regionally, the groundwater flow direction is towards the southeast, in line with existing surfacedrainage and heavily influenced by topographical features. The bulk of groundwater recharge occursover the topographical highs of Carborough Range, Mt Gotthardt and the mountain ranges to thenorth and northeast past Homevale National Park.Brumby Waterhole is a system consisting of a series of three pools on a tributary of Hail Creekbelieved to be maintained to some extent by groundwater seepage. Douglas Partners (2015)concluded the waterhole is 1.3m to 1.8m above the regional groundwater table, suggesting there isno regional hydraulic conductivity.2.1GROUNDWATER MONITORING NETWORKThe alluvium groundwater is monitored at five (5) bores (Figure 3). Bore GWMB 32 was constructedin 2017 to replace the collapsed bore GWMB31 listed in the mine’s EA. Bore GWMB 12A was dryduring the 2018/2019 monitoring period so laboratory samples were not taken, and GWMB 22A wasdry in April 2020.7Glencore Hail Creek Mine – Annual Groundwater Report 2020
Figure 3 – Hail Creek Mine site plan with location of Alluvial Groundwater bores8Glencore Hail Creek Mine – Annual Groundwater Report 2020
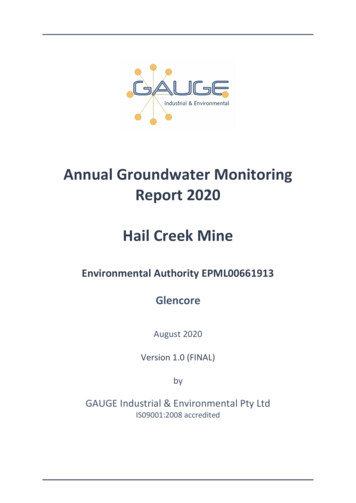
3. GROUNDWATER LEVELSGroundwater levels measured between 2016 and July 2020 recorded an average twelve-monthdrawdown between 0.42 m and 1.69m (Table 1).In the 2019/2020 reporting year, the maximum six-month drawdown was 1.1m in GWMB32 betweenJanuary and July 2020, within the proposed EA trigger of 2 metres drawdown per six-month period.Bore GWMB12A remained dry and not recovered since April 2018.GWMB14A and GWMB32 were dry in April 2020, and GWMB14A contained a small amount of waterin July 2020.Table 1 – Groundwater Level 9/07/199.449.7810.5710.80 (dry)10.80 (dry)10.80 (dry)10.80 (dry)10.80 (dry)10.80 (dry)10.80 7.9211.7012.00DRY12.5712.1013.1DRYDRY 7/20Drawdown (m) since2016/201710.80 (dry) 1.36(bore dry)16.316.616.5916.88Time period (months)3939515133*Average Drawdown (m) per Jan19-Jul19)(Apr18-Oct18)Recovered to1.84 within 12month period2.26Historical maximum drawdown(m) in any 6-month periodMax. drawdown in 2019/2020in any 6-month an20-Jul20)* newly constructed bore (in 2017)Figure 4 shows groundwater levels in alluvium bores generally declining since 2016, following a similartrend to Cumulative Mass Residual Rainfall (CMRR) curve for the area (Nebo and Moranbah Bureau ofMeteorology (BOM) Weather Stations).The CMRR curve is the cumulative deviation from mean monthly rainfall over time. Positive slopes onthe rainfall residual curve indicate periods of above average rainfall, whereas negative slopes indicateperiods of below average rainfall. The rainfall residual often closely correlates with rainfall recharge ofgroundwater and is useful for assessing longer-term climatic influence on groundwater levels.9Glencore Hail Creek Mine – Annual Groundwater Report 2020
Departures in groundwater levels from the curve can indicate changes in groundwater levelsassociated with influences outside of rainfall, such as pumping.Monthly rainfall data dating back to 1909 shows that the area has been in a period of negativerainfall since 2013/2014 (Figure 5). The data indicates the decline in groundwater levels in theseshallow alluvium bores is likely related to a decline in recharge from rainfall and related surfacewaters.10Glencore Hail Creek Mine – Annual Groundwater Report 2020
Figure 4 – Groundwater levels (mbgl) in comparison to Cumulative Mass Residual Rainfall11Glencore Hail Creek Mine – Annual Groundwater Report 2020
Figure 5 – Long term Monthly and Cumulative Mass Residual Rainfall at Nebo and Moranbah BOM Stations*Nebo (33054) until Jan 2020, then Moranbah (34035) afterwards.12Glencore Hail Creek Mine – Annual Groundwater Report 2020
4. WATER QUALITY AND COMPARISON TO PROPOSED EA TRIGGERS4.1MONITORING AND ANALYSISGroundwater monitoring data was provided by Glencore Hail Creek Mine. Monitoring and samplecollection were undertaken by site personnel until late 2018, and now conducted by AustralianLaboratory Services (ALS). Laboratory analysis was performed by laboratories carrying NATAregistration for the analytes tested. Raw data is provided in Appendix B, with test results below theLimit of Reporting (LOR) converted to the LOR value for the purposes of statistical analysis andgraphing.4.2ANALYTES MONITORED AND TRIGGER VALUESTable E2 of the mine’s EA sets out the analytes and contaminant trigger levels to be monitored on a6-monthly basis. HCM provided recommended trigger levels (Table 2) as required under Condition E7for inclusion in site to the Department of Environment and Science (DES) on 30 June 2017. At thisdate, no confirmation has been received from the DES in regard to the acceptance of the proposedtrigger values. For the purpose of this work, it has been assumed there are no objections to theproposed trigger values HCM submitted.Table 2 – Proposed Groundwater Contaminant Trigger LevelsParameterUnitsTrigger Levels*Limit TypeGroundwater Levelm 2.0MaximumpHpH Units6.5 – 9.0RangeElectrical ConductivityµS/cm4200MaximumTotal Dissolved Solids (TDS)mg/L2472MaximumCalcium (Ca)mg/LNo LimitInterpretative purposes only#Magnesium (Mg)mg/LNo LimitInterpretative purposes only#Sodium (Na)mg/LNo LimitInterpretative purposes only#Potassium (K)mg/LNo LimitInterpretative purposes only#Chloride (Cl)mg/LNo LimitInterpretative purposes only#Sulfate (SO4)mg/LNo LimitInterpretative purposes only#Carbonate (CO3)mg/LNo LimitInterpretative purposes only#Bicarbonate (HCO3)mg/LNo LimitInterpretative purposes only#Phosphate (PO4)mg/L1.96Maximummg/L0.46MaximumNitrate (NO3)Dissolved Metals and MetalloidsIron (Fe)µg/L120MaximumAluminium (Al)µg/L55MaximumArsenic (As)µg/L13MaximumMercury (Hg)µg/LTBA&MaximumAntimony (Sb)µg/LTBA&TBATotal Petroleum Hydrocarbons (TPH)TPH C6 – C9µg/LTBA&MaximumTPH C10 – C36µg/LTBA&Maximum* Interim trigger levels, final to be provided as per EA Condition E7# The measurement of cations and anions are used to interpret the groundwater chemistry and identify the groundwatersource e.g. by using piper diagrams& These analytes have been proposed to be excluded – all dissolved data to date has been below the laboratory level ofdetection13Glencore Hail Creek Mine – Annual Groundwater Report 2020
4.3RESULTSGroundwater quality data dating back to 2014 was plotted against proposed EA trigger values todetermine if the quality remains within those limits (Appendix A, Figure 6 to Figure 27). BoreGWMB12A remained dry (since April 2018), and GWMB14A was dry in April 2020, and containedinsufficient water to sample in July 2020.4.3.1 pHThe pH of all bores was neutral and remained within the EA trigger range of pH 6.5 – 9.0 and the2019/2020 data remained within the historical range since 2014 (Figure 6).4.3.2 Salinity and Major IonsSalinity, measured as Electrical Conductivity (EC) and Total Dissolved Solids (TDS), mostly remainedbelow the proposed EA triggers of 4,200 μS/cm and 2,472 mg/L respectively (Figure 8 and Figure 10).The exception was GWMB14A which has gradually increased in salinity since 2014 fromapproximately 4,000 μS/cm to 6,000 μS/cm in 2020; above the proposed EC trigger (4,200 μS/cm)and similar to the ANZECC stock watering guideline (approximately 5,970 μS/cm). TDS followed asimilar trend, increasing from approximately 2,500 mg/L in 2014 to a maximum of 3,980 mg/L inJanuary 2020; above the proposed EC trigger (2,472 mg/L) and nearing the ANZECC stock wateringguideline (4,000 mg/L). All other bores remained below the EC and TDS ANZECC stock wateringguideline for beef cattle.Cations and anions contributing to salinity generally remained steady or slightly increased betweenAugust 2019 and July 2020 (Figure 11 and Figure 18). Magnesium, chloride, calcium and sulfateswere the main ions contributing to the increase in salinity in GWMB14A, whilst sodium, potassiumand bicarbonate concentrations decreased. As water levels in GWMB14A had declined since 2014, incorrelation with the declining residual rainfall, some concentration of salts may have occurred. Theincrease in concentration is expected to occur across all ions, however, in this case some ionsdecreased in concentration, signifying a more complex process within the change in salinity.4.3.3 NutrientsPhosphate, calculated from the filterable reactive phosphate results using molecular mass ratios,were well below the proposed trigger value (1.96 mg/L) in all bores, ranging between 0 and 1 mg/L(Figure 19).Nitrates have been below the proposed trigger (0.46 mg/L) since 2015, except for the occasionaloutlier which did not persist into subsequent testing (Figure 20).Nutrients generally do not appear to be enriched above proposed trigger values in the alluviumbores.4.3.4 MetalsAluminium remains below the proposed trigger value of 55 μg/L, with no increase over time (Figure21).14Glencore Hail Creek Mine – Annual Groundwater Report 2020
Antimony was added to the monitoring suite when the EA was amended in October 2016, and hasremained below detection limits in 2019/2020 (Figure 22). There is no proposed trigger value orANZECC (2000) guideline for this analyte.Arsenic has remained relatively steady in all alluvium bores over the monitoring period, ranging from 1 to 3 μg/L, and well below the proposed trigger value (13 μg/L) (Figure 23).Iron was below the proposed trigger (120 μg/L) in all bores except a single reading of 720 μg/L forGWMB22 in January 2020 and bore GWMB13A which recorded 25 – 940 μg/L (Figure 24). InGWMB13A this was lower than the previous peak of 1,930 μg/L recorded in July 2019. There hasrecently been high variability in this bore, with levels below detection ( 50 μg/L) in January, April andOctober 2019, similar to historical concentrations. Similar variability was seen in bore GWMB14Aback in 2016 which has since settled to below detection limits. The results suggest sampling oranalysis variability related to iron.Mercury was below the laboratory detection limit for all samples in 2019/2020 (Figure 25). There isno proposed trigger value or ANZECC (2000) guidelines for this analyte.Metals were below the proposed trigger values, with iron detected above the proposed trigger foriron, likely attributed to sampling or analysis variability.4.3.5 Petroleum HydrocarbonsTotal Petroleum Hydrocarbons (TPH) in C6 – C9 fraction were below detection for all samples (Figure26). TPH analysis of the C10-C36 fraction included Silica Gel Clean-up which removes naturalhydrocarbons, so that only petroleum derived hydrocarbons are recorded. All results were belowdetection ( 50 µg/L) except a single detection in bore GWMB32 in January 2020, when 1,800 µg/Lwas recorded (Figure 27). The sample was taken when water available in the bore was very low andnoted on the sampling field sheet as cloudy and thick brown in colour/texture, and required bailingto obtain a sample. There was insufficient water to confirm the result during subsequent samplingevents in April and July. This was the first detection of C10-C36 TPHs in bore GWMB32, and ispossibly a result of sampling a near dry bore. Continued monitoring is recommended to determine ifdetection persists when water returns to the bore.5. CONCLUSIONS AND RECOMMENDATIONSGroundwater levels in the alluvium bores have declined since 2013, correlating with the decline inresidual rainfall that recharges the alluvium aquifer in the area. Between 2016 and 2020 the average12-month drawdown ranged between 0.42 m and 1.69 m. In the 2019/2020 reporting year, themaximum 6-month drawdown was 1.1 m in GWMB32, which is within the proposed EA trigger of 2metres drawdown per six-month period.Water quality was generally within acceptable concentrations and proposed EA trigger values. Someanalytes, namely salinity (EC and TDS) in GWMB14A and dissolved iron in GWMB13A, were aboveproposed triggers.Salinity in bore GWMB14A has gradually increased since 2014 and is now similar to the ANZECC stockwatering guideline. Iron in GWMB13A shows high variability which appears more related to samplingvariability rather than a change in the aquifer, as October 2019 results were below the limit of15Glencore Hail Creek Mine – Annual Groundwater Report 2020
detection (similar to historical concentrations), and the 2020 results were below the peakconcentration recorded in July 2019.Total Petroleum Hydrocarbons were detected in Bore GWMB32 in January 2020; however, the borewas near dry and not able to be sampled subsequently to confirm the result.It is recommended that monitoring continues for levels and water quality according to the mine’s EAconditions.6. REFERENCESDEHP (2013a) Environmental Protection (Water) Policy 2009. Isaac River Sub-basin EnvironmentalValues and Water Quality Objectives. Basin No.130 (part), including all waters of the Connors RiverSub-basin. September 2011. Department of Environment and Heritage Protection, Republished July2013. fitzroy groundwater plan 300811.pdfDEHP (2013b) WQ1303 – Isaac River Sub-basin. Part of basin 130. EPP(Water) 2009. CentralQueensland Map Series. Department of Environment and Heritage Protection. QueenslandGovernment. July 2013. saacriverower nogoa plan 300811.pdfDEHP (2013c) WQ1310 – Fitzroy Basin Groundwater Zones. Part of Basin 130. EPP (Water) 2009.Central Queensland Map Series. Department of Environment and Heritage Protection. QueenslandGovernment. July lans/fitzroy groundwater plan 300811.pdfDouglas Partners (2015) Report on Groundwater Impact Assessment Hail Creek Transition Project.Hail Creek Coa
This annual alluvial groundwater monitoring report has been completed to determine Hail Creek Mines compliance against the sites Environmental Authority (EA) (EPML00661913) groundwater conditions (see Attachment). This report reviews groundwater quality data obtained in the 12 months between Aug 2019 and July