Transcription
Mineral Resources TasmaniaTasmanian Geological SurveyTasmaniaRecord 2004/04DEPARTMENT ofINFRASTRUCTURE,ENERGY and RESOURCESAn overview of theMineral Resources Tasmaniastatewide groundwatermonitoring networkAndrew EzzyCONTENTSAbstract Introduction Statewide groundwater level/groundwater quality network Devonport network NHT salinity network Water level information Manual readings Automatic readings—time series data Dataflow system Odyssey system Groundwater sampling and chemistry Groundwater sampling procedures and effect on water quality Groundwater quality Data storage Strengths and limitations of networks Statewide groundwater network Strengths Limitations Devonport network Strengths Limitations NHT salinity network Strengths Limitations Recommendations Statewide groundwater network Devonport network NHT salinity network Future work Acknowledgements References Tasmanian Geological Survey Record 19191919191
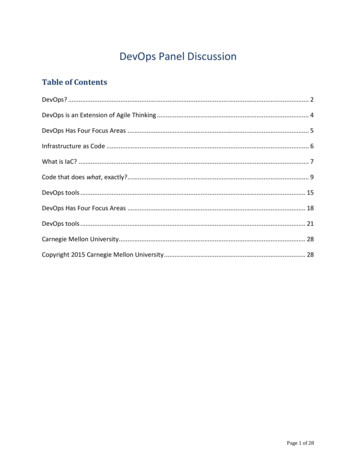
Figures1.2.3.4.5.6.7.Location of currently monitored bores, statewide groundwater network Location of the Devonport and NHT salinity network boreholes Comparison of the Odyssey and Dataflow hydrographs, Chudleigh borehole Classification of boreholes based on the ten-year average TDS values Combined graph of all long-term TDS results for all boreholes in the statewide network Chemical trends between 1991 and 2001 for the Cressy and Bothwell boreholes Graphical presentation of TDS, Na and Cl average and standard deviation values between1990 and 2001 for each statewide groundwater network borehole 8. Water level data between 1984 and 2001 for the Devonport network 47121415161724Tables1.2.3.4.5.6.7.8.Currently monitored original network boreholes with respect to groundwater flow systems Actions required for ongoing management of bores of the statewide groundwater network Linear regression equations calculated in Microsoft Excel 2000 from 1990 to 2003 SWL data Current distribution of data systems and history of the progressive decommissioning ofthe Dataflow system Representative elementary volumes for groundwater samples collected post February 2003from the original network Comparison of analytical results for TDS between groundwater quality sampling methods Groundwater chemistry types, SAR and Na in individual boreholes Average and standard deviation values for laboratory results between 1990 and 2001 6891013132021Appendices1. General description and location map for each statewide groundwater network borehole 2. Drilling records for the Devonport and statewide groundwater network boreholes andengineering logs for the twelve NHT salinity network boreholes 3. Example field procedure sheet for the Chudleigh borehole 4. Field readings and related graphs for manual water levels 5. Calibration values provided by Dataflow Systems Pty Ltd 6. MRT field operational procedure manual for the Dataflow system 7. Dataflow hydrographs and manual standing water level graphs 8. Combined hydrographs of 1995 to 2004 Dataflow data and stream flow data 9. MRT field operational procedure manual for the Odyssey system 10. Piper plots comparing the ‘cleaning up’ and REV groundwater quality sampling methods 11. Piper plots of boreholes grouped by groundwater flow system 12. Graphs of TDS for each borehole of the statewide groundwater network 13. Short and long-term management options for each statewide groundwater network borehole 253350526871748497100113117134While every care has been taken in the preparation of this report, no warranty is given as to the correctness of theinformation and no liability is accepted for any statement or opinion or for any error or omission. No reader should act or failto act on the basis of any material contained herein. Readers should consult professional advisers. As a result the Crown inRight of the State of Tasmania and its employees, contractors and agents expressly disclaim all and any liability (includingall liability from or attributable to any negligent or wrongful act or omission) to any persons whatsoever in respect ofanything done or omitted to be done by any such person in reliance whether in whole or in part upon any of the material inthis report.Tasmanian Geological Survey Record 2004/042
AbstractMineral Resources Tasmania (MRT) collects water chemistry and water level data from boreholes installed invarious Tasmanian groundwater aquifers. Data from the boreholes have been used in salinity and groundwatermapping projects and for the publication of two groundwater catchment maps. This report documents the historyof the boreholes and provides processed and checked water level and water quality data. New procedures areoutlined and recommendations provided for the future management of the network.Pressure and temperature data loggers indicate that the water level in most boreholes varies considerably withrainfall events. Of the monitored boreholes, 75% showed a net decline while 25% indicated a rise in the water levelover the period of record (based on the linear regression technique). The linear regression of the total dissolvedsolids (TDS) data indicates that the TDS in the water from 60% of the boreholes is decreasing, while it is increasing in40% of the boreholes. Such trends should be quoted in terms of past quality assurance issues and the lack ofdocumented procedures.Combined hydrographs of MRT groundwater level data and surface water stream-flow data (provided by DPIWEfor the closest weirs) indicate a direct hydraulic link between surface and groundwater systems. A more detailedstudy of the existing hydrological datasets is required in order to provide some guidance about the value oflong-term monitoring of surface and groundwater (as a single interactive resource).The current statewide network requires on-going maintenance and is not sufficient for the sustainablemanagement of Tasmania’s water resources. Essential components of the water level monitoring program includea large array of observation wells, aquifer defined frequency water level measurements, quality assurance data,and data reporting.Seven boreholes where data quality is questionable should be decommissioned and five others repaired. Seventeenboreholes require re-drilling and three cleaning out, or blockages removed.IntroductionMonitoring of water level and groundwater qualitybegan in the Devonport area in 1985 by the thenDepartment of Mines. The Devonport network wasinstalled to monitor the impact of groundwaterextraction f or irri gation pu rposes fr om thelocal/regional basalt aquifer.In the period from 1990 to 1991 monitoring wasexpanded statewide by drilling new or using existingboreholes. This network has been slightly expanded inrecent years.A third network of boreholes was established in 2000as part of a National Heritage Trust (NHT) fundedsalinity investigation. The NHT salinity network wasintensively monitored between 2000 and 2002 forwater quality and water level.MRT has also been involved in the establishment ofthree other groundwater networks in recent years(Dell, 2000; Ezzy, 2002; Taylor, 2000). Because theseboreholes are currently not monitored, only theDevonport, statewide and NHT salinity networks arediscussed in this report.The aim of this report is to provide an overview of pastobjectives of groundwater monitoring, types of datacollected, data storage locations, identified strengthsand limitations of the monitoring program, andprovide recommendations for the future managementof the borehole network.As the term standing water level (SWL) is mainlyapplied to short-term trends (e.g. barometric pressurechanges) and this report mainly refers to long-termstatic water levels, the term water level (WL) has beenused instead of SWL.Tasmanian Geological Survey Record 2004/04The current monitored network of water level andgroundwater quality boreholes in Tasmania consistsof the remaining operational statewide and Devonportnetwork boreholes (34 and 18 holes respectively) and asmaller subset of boreholes (9) from the NationalHeritage Trust salinity network.Statewide groundwater level/groundwater quality networkThe statewide groundwater network initiallyconsisted of 37 groundwater monitoring sites and onesurface water monitoring site. At the time of drilling noformal agreement was made with the propertyowners. Consequently, no legal mandate exists forMRT to enter the properties and obtain water levelmeasurements and collect water quality samples forchemical analysis.In recent years, the network was expanded by usingadditional boreholes from the Devonport and NHTsalinity networks. This expansion was brought aboutby the recognition of thirteen groundwater flowsystems in Tasmania (Latinovic et al., 2003). Theobjective of adding these boreholes to the network wasto gain an understanding of the behaviour of theselocal, intermediate and regional groundwater flowsystems. The expansion of the network included themonitoring of salt pans connected to near-surfacesaline water tables within agricultural areas (NHTsalinity network), plus artificially-induced excessivedrawdown as a result of high-density intensiveextraction of groundwater for irrigation (Devonportnetwork). The current expanded network provides apreliminary data source that supports/allows asustainable approach to the management of thelocalised resources.3
5040600000 mE605050MontaguTogariSouth ForestCalderTrowuttaMooreville RoadWaterhousePipers River JetsonvilleWinnaleahBurnie Tip 2 & 4HampshireSpreytonLilydaleBarringtonHagleyBeulah (after 2000)40Branxholm40ChudleighSt MarysOsmastonCressyBichenoRossBothwell30Melton MowbrayLittle Swanport30TunnackBucklandRisingSorellDodges FerryFallingFalling 0.5 m/yHuonvilleArtestianSnugPort Arthur5200000mN5200000mN50DEPARTMENT ofINFRASTRUCTURE,ENERGY and RESOURCES4030Tasmania600000 mEMINERAL RESOURCESTASMANIAFigure 1Location of currently monitored bores, statewide monitoring networkTasmanian Geological Survey Record 2004/044
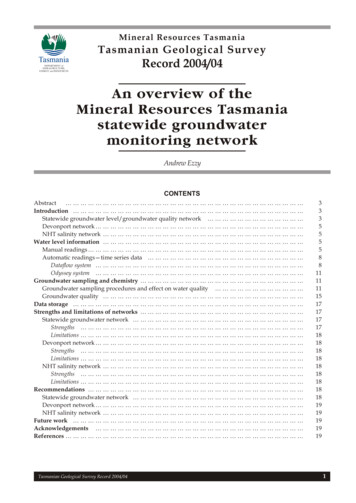
The reason for the siting of each of the boreholes hasnot always been well documented. Based on the depthand distribution of the boreholes, the sites appear tohave been selected to assess natural temporal changesin the storage volumes and water quality of theparticular aquifers. Monitoring data include timeinterval water quality parameters, manual waterlevels, and automatic pressure and temperaturerecords.The monitoring boreholes range in depth from 24 to135 metres. Complete engineering logs do not exist forthe boreholes. Many of the boreholes were notproperly installed and this has resulted in silting andcollapse of the borehole walls. As a result of the poordocumentation of procedures and unsatisfactorystorage and quality control of the data, the scientificintegrity of some of the historical data is questionable.A surface water monitoring site and three boreholesare located adjacent to the Burnie landfill. Thismonitoring was to detect any pollution that may resultfrom a hydraulic connection of the groundwater withthe fill material.Figure 1 shows the location of the currently monitoredboreholes. A general description and location map foreach borehole in the statewide groundwater networkis provided in Appendix 1. Appendix 2 containsdrilling records from the MRT groundwater databasefor the statewide groundwater network boreholes.To standardise the scientific integrity of the data, fieldprocedure sheets were trialled in 2003. Appendix 3contains a sample field procedure sheet for theChudleigh monitoring borehole. Table 1 listsstatewide groundwater network monitoringboreholes with respect to the groundwater flowsystems (Latinovic et al., 2003).Water level readings and water quality samples havebeen collected during autumn and spring since 1990.Automatic pressure data have been recorded since1995 from the statewide groundwater network. Basicmaintenance on borehole collars was undertaken in2002.Two overview reports on the network wereundertaken by the Hydro-Electric Commission (HEC)Water Resources Department, the first in 1994(Buckland, 1994) and the second in 1995 (Buckland andKrohn, 1995). Buckland (1994) provided a detailed listof recommendations and Buckland and Krohn (1995)noted that none of the recommendations made byBuckland (1994) had been implemented. Theser e c o m m e n d a t i o n s h a v e pr o g r e s s i v e l y b e e nimplemented since 2002.Table 2 indicates what actions are currently requiredfor the on-going management of individual boreholesin the statewide groundwater network. The cost ofre-drilling, decommissioning and other requiredmaintenance for the boreholes is estimated to beapproximately 300,000.Tasmanian Geological Survey Record 2004/04Devonport networkThis network consists of two groups of boreholes. Thefirst group was drilled close to existing irrigationboreholes and for some years the irrigation boreholeswere monitored to record extraction volumes. Thesecond group of boreholes was drilled away fromexisting private boreholes to monitor natural aquiferconditions and potential over extraction/induceddrawdown on a regional scale. Results of the waterlevel and quality monitoring for the period between1984 and 1989 are available in Cromer (1993). OneDataflow data logger was installed to monitor naturalaquifer conditions in 2001. This logger wa sdecommissioned in March 2004 due to hardwarefailure.The locations of the Devonport network boreholes areshown in Figure 2 and Appendix 1. The drillingrecords from the MRT groundwater database for theDevonport network boreholes are included inAppendix 2.NHT salinity networkBetween 2000 and 2003, MRT was involved in a jointState/Australian Government project to investigatehydrogeological and salinity processes in theWaterhouse, Tunbridge and Coal River areas (CoffeyGeosciences, 2002). As part of this project MRTinstalled four Dataflow data loggers in each of the threefield areas. Of the original twelve installed, only ninedata loggers remain operational (three in each fieldarea).The locations of the NHT salinity network boreholesare shown in Figure 2. Engineering logs for the drillingand installation of the twelve currently monitoredboreholes from the NHT salinity network are includedin Appendix 2.Water level informationManual readingsThe purpose of collecting manual water level readingsis to calibrate data logger information and identify anytimes of aquifer stress during annual recharge anddischarge.Manual readings of water level for the statewidegroundwater network have been compiled from twiceyearly readings and are summarised in Appendix 4. Aground level datum was not initially set and readingsmay have been affected by activity around theborehole collars. From this information, linearregression equations have been calculated for eachborehole to determine the rate of change of water level,based on 13 years of measurement. The linearregression technique can only be regarded as anapproximation of groundwater storage trends, as it isbased on a small number of chance observations. Dataloggers indicate that water level varies considerablywith rainfall events for most boreholes, but 75% of allboreholes show a net decline and 25% indicate a rise in5
Table 1Currently monitored original network boreholes with respect to groundwater flow systemsTasmanian groundwater flow system asdefined by Latinovic et al. (2003)MRT statewide groundwaternetwork monitoring boresGeology in which bore is located1. Regional and local flow systems inTertiary sedimentary rocksCressyTertiary sedimentary rocks2. Intermediate flow systems in Tertiarysedimentary rocksJetsonvilleTertiary sedimentary rocks3. Intermediate flow systems in low reliefPermian and Triassic sedimentary rocksCalderRossSt MarysBothwellTunnackMelton MowbrayHuonvilleBucklandPermian mudstoneTriassic sandstoneTriassic sandstonePermian mudstonePermian mudstoneTriassic sandstonePermian mudstoneTriassic sandstone4. Intermediate flow systems in low relieffolded and fractured Proterozoic andPalaeozoic rocksTogariTrowuttaMontaguSouth ForestBeulahChudleighPipers RiverBranxholmPrecambrian dolomiteRocky Cape Group Precambrian slatePrecambrian slatePrecambrian slateCambrian mudstoneOrdovician limestoneMathinna Beds slateMathinna Beds slate5. Intermediate to local flow systems inTertiary basaltHampshireBarringtonHagleyWinnaleahPawleena RoadBurnie Tip 1Burnie Tip 4Tertiary basaltTertiary basaltTertiary basaltTertiary basaltTertiary basaltTertiary basaltTertiary basalt6. Intermediate to local flow systems inJurassic doleriteNilN/A7. Local flow systems in Quaternarysedimentary rocks (talus & till)NilN/A8. Local flow systems in high reliefJurassic doleriteLittle SwanportPort ArthurJurassic doleriteJurassic dolerite9. Local flow systems in high relief Permianand Triassic sedimentary rocksSpreytonOsmastonLilydaleBichenoSnugDodges FerryPermian mudstonePermian slatePermian slateTriassic sandstoneTriassic sandstoneTriassic sandstone/mudstone10. Local flow systems in high reliefgranitic rocksNilN/A11. Local flow systems in high relief foldedand fractured Proterozoic and PalaeozoicrocksMooreville RoadPrecambrian Burnie Formation slate12. Local to Intermediate flow systems inQuaternary sedimentary rocks (aeolian,coastal plains and alluvium)NilN/A13. Local to Intermediate flow systems inQuaternary to Tertiary sedimentary rocks(aeolian, coastal plains and alluvium)WaterhouseQuaternary sedimentary rocksTasmanian Geological Survey Record 2004/046
5040600000 mE605050Study Area 2Waterhouse4040Study Area 1Tunbridge3030Study Area 3Coal RiverNHT study areaDevonport network5200000mN5200000mN50DEPARTMENT ofINFRASTRUCTURE,ENERGY and RESOURCES4030Tasmania600000 mEMINERAL RESOURCESTASMANIAFigure 2Location of the NHT salinity and Devonport network boresTasmanian Geological Survey Record 2004/047
Table 2Actions required for the ongoing management of individual bores of the statewide groundwater networkBore eighCressyDodges FerryHampshireHuonvilleJetsonvilleLilydaleMelton MowbrayMontaguMooreville RoadOsmastonPipers RiverPort ArthurSnugSt ommissioningxxCleaningof xxwater level. These trends should be quoted withcaution due to past quality assurance issues and thelack of documented procedures.Table 3 lists the common names of the boreholes,calculated linear regression equations, and relatedgradients of daily and annual movement based onNovember 2003 data. Because of the effect of drillingirrigation boreholes near the Montagu and Togarimonitoring boreholes, data collected post 1999 hasbeen ignored. Two of the four artesian boreholes(Spreyton and Huonville) stopped flowing from late2001 to early 2003, and flow rates from the remainingtwo (Burnie Tip 1 and Bothwell) decreasedsignificantly.Automatic readings — time series dataTwo types of digital time series pressure andtemperature data collection devices have beeninstalled in various boreholes in the network. Theolder Dataflow system has been in operation since 1995for the statewide groundwater network and is beingprogressively decommissioned as individual devicesbecome unserviceable. Large data gaps exist for manyof the Dataflow monitored boreholes. Twenty-eight outof the 43 Dataflow devices installed across the threenetworks remain operational. As a result of thesefailures, the new Odyssey system was installed in 28boreholes in December 2003. The co-installation ofboth types of hardware allows for cross checking ofdata integrity between the two systems. Table 4 is asummary of the current distribution of the two systemsand the history of the progressive decommissioning ofthe Dataflow system.Tasmanian Geological Survey Record 2004/04xDataflow systemThis system consists of a data logger which is installeddown the borehole above the maximum expectedwater table height. Two types of sensors can beattached to the logger. The older type of sensor consistsof a 3.2 metre long PVC pipe with an external sensorwire which is lowered into the water table. The secondtype of sensor may be connected to the logger by a fiveor ten metre cable. The three probes have a respectiverange of measuring water table oscillations of three,five and ten metres. If a change in the water levelexceeds the sensitivity of the installed sensor (i.e. 3, 5 or10 metres), the recorded data cannot be calibrated.The data loggers are programmed using MS-DOSsoftware to record pressure and temperature readingsevery three hours. Based on hardware calibrationsprovided by Dataflow Systems Pty Ltd and in-fieldcalibration equations generated at the time ofdownload, the pressure readings can then beconverted to water level values. Appendix 5 lists thecalibration values provided by Dataflow Systems PtyLtd and details of the status of each installation.Even with the calibrations provided, field testing of theDataflow devices has shown that data collected fromthis system must be field calibrated during eachinspection. If the devices are not regularly fieldcalibrated, any temporal drift in the data renders themuseless.Appendix 6 contains an internal MRT field operationalprocedure manual for the Dataflow system. Themanual was developed to assist with data collectionand processing, although site-specific conditions may8
Table 3Linear regression equations calculated in Microsoft Excel 2000 from 1990 to 2003 SWL data,statewide groundwater network monitoring boreholes. Negative values imply a declining water table.Feature ID(MRT 6528177781778017773LocationTOGARISOUTH FORESTMONTAGUTROWUTTACALDERHAMPSHIREMOOREVILLE ROADJETSONVILLEPIPERS RIVERWATERHOUSEWINNALEAHBRANXHOLMST ONCRESSYBICHENOROSSTUNNACKMELTON MOWBRAYLITTLE SWANPORTBUCKLANDDODGES FERRYPAWLEENA ROADPORT ARTHURBURNIE TIP 2BURNIE TIP 4SNUGTasmanian Geological Survey Record 2004/04Linear res/year)y -0.0002 3.0124y 0.0003 -6.0238y 0.00046 -2.185y 0.0003 -0.8614y —0.0012 64.293y 0.0002 1.5954y 0.0005 -2.9986y 0.0009 -23.146y -0.0009 49.451y 0.000006 3.2827y 0.0002 43.845y 0.009 -7.6506y -0.00005 9.1411y 0.0024 11.705y 0.0004 -9.7605y 0.0004 -7.3675y 0.0002 -0.1587y 0.00008 -0.9297y -0.0002 17.709y 0.0037 9.3335y 0.0005 -10.116y 0.00003 0.3393y -0.003 13.946y -0.0015 2.991y -0.0001 7.7528y 0.0001 2.243y 0.0012 10.582y 0.0009 -21.89y 0.00005 1.4679y 0.0058 -0.4225y 0.0029 0.5817y 0.00004 38-0.3285-0.01825-2.117-1.0585-0.01469
Table 4Current distribution of the two data systems and history of the progressive decommissioning of the Dataflow systemFeature ID(MRT database)BoreholenameStatus of Dataflow systeminstalled wellOperationalDecommissioned 26/03/2003OperationalNo sensor ever installed165461655117776BranxholmBucklandBurnie Tip 1OperationalDecommissioned 02/04/2003No sensor ever 23Burnie Tip 4CalderChudleighCressyDodges FerryFree’s BoreHagleyHampshireHuonvilleNo sensor ever installedDecommissioned 24/03/2003OperationalOperationalDecommissioned 1996No sensor ever installedOperationalDecommissioned 28/11/2003No sensor ever ttle SwanportMelton MowbrayMontaguMooreville RoadOsmastonPawleena RoadPipers RiverPort ArthurRossSnugSouth ForestSpreytonOperationalDecommissioned 18/03/2003OperationalOperationalDecommissioned 27/11/2003OperationalDecommissioned 02/12/2003OperationalDecommissioned ssioned 25/2003/2003No sensor ever installed1652616531165301655016544165471497Not enteredNot enteredNot enteredNot enteredNot enteredNot enteredNot enteredNot enteredNot enteredNot enteredNot enteredNot enteredSt issioned 25/03/2003Decommissioned onalOperationalOperationalDecommissioned 09/12/2003OperationalOperationalDecommissioned December 2002OperationalOperationalDecommissioned December 2002OperationalOperationalTasmanian Geological Survey Record 2004/04Status ofOdyssey systemInstalled 16/12/2003Installed 16/12/2003Installed 15/12/2003Installation not possibledue to artesian flowInstalled 15/12/2003Installed 15/12/2003Installation not possibledue to artesian flowNo installation requiredInstalled 17/12/2003Installed 16/12/2003Installed 11/12/2003No installation requiredNo installation requiredInstalled 11/12/2003Installed 17/12/2003Installation not possibledue to artesian flowInstalled 16/12/2003Installed 16/12/2003Installed 15/12/2003Installed 11/12/2003Installed 17/12/2003Installed 17/12/2003Installed 16/12/2003Installed 12/12/2003Installed 16/12/2003Installed 12/12/2003Installed 11/12/2003Installed 12/12/2003Installed 17/12/2003Installation not possibledue to artesian flowInstalled 15/12/2003Installed 17/12/2003Installed 17/12/2003Installed 15/12/2003Installed 16/12/2003Not installedNot installedNot installedNot installedNot installedNot installedNot installedNot installedNot installedNot installedNot installedNot installedNot installedNot installed10
still require additional procedures to produce reliablehydrographs. Raw data exported from the Dataflowsoftware can be processed in Microsoft Excel.Two distinct groups of processed data exist for theDataflow system. Data collected between 1995 and 1999were compiled into a continuous data stream ofcalibrated values held as a single text file. Calibrationfiles and the method for processing the raw data werenot documented and no record of the raw data isknown to exist. The continuous data stream wasbroken into chronological data blocks for each uniquekey identifier. Based on water level values and datasequencing, borehole identities were assigned to theunique key identifiers.The second group of Dataflow data was collectedbetween 1999 and 2004. Field calibrated and raw dataexists with additional important metadata (e.g.changes in probe depths). The nature of the seconddataset indicates that the older Dataflow data was‘smoothed’ (to some degree) at the time of processing.Microsoft Excel files containing all combined existingraw and processed Dataflow calibrated data from 1995to 2004 are held by MRT. Hydrographs based on theDataflow data of this duration are included inAppendix 7. The hydrographs demonstrate drift in thedata (e.g. Snug statewide monitoring borehole),hardware failure (e.g. Mooreville Road statewidemonitoring borehole) and the sensitivity of the data tothe calibration equations used for processing the rawdata (e.g. Osmaston statewide monitoring borehole,where no field calibration existed; the Jetsonvilleequation was used to convert pressure data to waterlevel).To investigate surface and subsurface interactiveprocesses, surface water flow data were provided bythe Department of Primary Industries, Water andEnvironment (DPIWE) for the closest weirs to themonitoring boreholes. Combined hydrographs areincluded in Appendix 8. So
network boreholes (34 and 1 8 holes respectively) a nd a smaller subset of boreholes (9) from the National Heritage Trust salinity network. Statewide groundwater level/ groundwater quality network The statewide groundwater network initially consisted of 37 groundwater moni toring si tes and one surface water monitoring site. At the t ime of .