Transcription
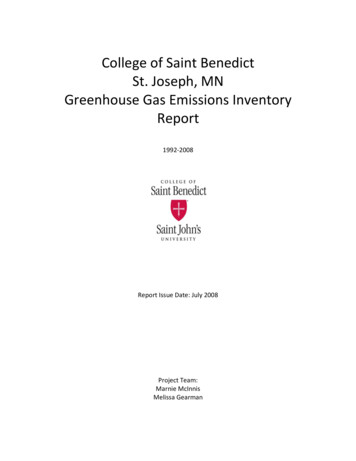
2020 UK greenhouse gas emissions, provisional figures25 March 2021National StatisticsIn 2020 the coronavirus (COVID-19) pandemic and the resulting restrictions brought in acrossthe UK had a major impact on various aspects of society and the economy and this has had asignificant impact on greenhouse gas emissions in the UK over this period. Carbon dioxide (CO2) emissions in the UK are provisionally estimated to have fallen by10.7% in 2020 from 2019, to 326.1 million tonnes (Mt), and total greenhouse gas emissionsby 8.9% to 414.1 million tonnes carbon dioxide equivalent (MtCO2e). Total greenhouse gasemissions were 48.8% lower than they were in 1990. This large fall in 2020 is primarily due to the large reduction in the use of road transportduring the nationwide lockdowns and the reduction in business activity. CO2 emissions fromtransport fell 19.6% in 2020, accounting for over half of the overall fall from 2019, and in thebusiness sector they fell by 8.7%. Conversely, CO2 emissions from the residential sectorincreased by 1.8% as more people stayed at home. CO2 emissions from the energy supplysector fell by 11.9% following lower demand during the pandemic and the continuedreduction in fossil fuel use in power stations.UK territorial greenhouse gas emissions, 1990-2020What you need to know about these statistics:This publication provides provisional estimates of 2020 UK territorial greenhouse gasemissions, meaning emissions that occur within the UK’s borders. Emissions arepresented in carbon dioxide equivalent units (CO2e) throughout this statistical release.These estimates give an early indication of emissions in 2020 and are subject to revisionwhen final estimates are published in February 2022. They also include estimates ofquarterly emissions and the impact on emissions of external temperature changes.Responsible statistician: Georgina SmalldridgeEmail: climatechange.statistics@beis.gov.ukMedia enquiries: 020 7215 1000 Public enquiries: 020 7215 0206Next publication: March 2022
2020 UK greenhouse gas emissions, Provisional figuresContentsIntroduction 32020 UK provisional emissions results 6Energy Supply 8Residential and Public sectors 10Transport sector 11Business sector 12Other sectors 12Carbon dioxide emissions by fuel type 132020 temperature adjusted provisional emissions results by sector 15Accompanying tables 17Technical information 17Basis of the provisional emissions estimates 17Quarterly totals 17Temperature adjustment 18Further information 18Future updates to these statistics 18Related publications 18Revisions policy 19Uses of these statistics 20User engagement 20National Statistics designation 20Pre-release access to statistics 20Contact 212
2020 UK greenhouse gas emissions, Provisional figuresIntroductionThis publication provides provisional annual and quarterly estimates of UK territorialgreenhouse gas emissions by source sector for 2020. It also provides an estimate oftemperature adjusted emissions, which give an idea of overall trends in emissions withoutfluctuations due to changes in external temperature. More information about the underlyingmethodology for the provisional emissions statistics can be found in the accompanyingmethodology summary.Data for 1990-2019 are consistent with the annual emissions presented in the NationalStatistics publication 2019 final UK greenhouse gas emissions statistics. Data for 2020emissions are provisional and do not follow the full methodology used for 1990-2019. Theestimates of carbon dioxide (CO2) emissions that are related to energy use are based onprovisional inland energy consumption statistics, which are being published at the same timeby BEIS in the quarterly Energy Trends publication. These are the large majority of emissionsin the UK.CO2 emissions that are not related to energy use are assumed to remain the same as in 2019as we do not yet have data from which to produce estimates for them, while estimates of nonCO2 gases are based on a simple approach which assumes that the change in emissions ofnon-CO2 gases between 2019 and 2020 will be in line with the percentage change in non-CO2emissions from 2019 to 2020 in the 2019 Energy and Emissions Projections published byBEIS. These emissions are assumed to be spread evenly over the year.There are uncertainties associated with all estimates of greenhouse gas emissions. Althoughfor any given year considerable uncertainties may surround the emissions estimates for apollutant, trends over time are likely to be much more reliable. The provisional 2020 estimatesare subject to a greater range of uncertainty than the final figures for earlier years and theCovid-19 pandemic means that this year they are more uncertain than usual. For non-CO2emissions and emissions not related to energy use in particular, the simple assumptions willnot capture any impact of the pandemic, although we can expect these emissions to be lessaffected by it than emissions related to energy use. For more information on uncertainties inemissions estimates see the annex published alongside the 2019 final UK greenhouse gasemissions statistics.The estimates present emissions on a “territorial” basis, so only include emissions which occurwithin the UK’s borders. They therefore exclude emissions from UK businesses and residentsthat occur abroad, including from international aviation and shipping, and any emissionsembedded within the supply chain of manufactured goods and services imported into the UK(while including emissions that occur in the UK resulting from exported goods and services).When emissions are measured on this basis, UK emissions account for around 1% of theglobal total, based on a range of estimates produced by the UN, the International EnergyAgency and the World Resources Institute amongst others.Two additional approaches to estimating UK emissions are also published and the Office forNational Statistics (ONS) has published an article that compares these different measures ofthe UK’s greenhouse gas emissions in more detail. The alternative measures are: ONS publishes emissions on a “residency” basis in the UK Environmental Accounts. Thefigures represent emissions caused by UK residents and businesses whether in the UK or3
2020 UK greenhouse gas emissions, Provisional figuresabroad, but exclude emissions within the UK which can be attributed to overseas residentsand businesses. The Department for Environment, Food and Rural Affairs (Defra) publishes the UK’s carbonfootprint. This estimates emissions on a “consumption” basis, meaning it covers emissionsassociated with the consumption of goods and services by households in the UK. Itincludes estimates of emissions associated with each stage of the supply chain for thosegoods and services, regardless of where they occur, while excluding emissions occurring inthe UK that are associated with the consumption of goods and services by householdsoutside the UK.For the purposes of reporting, greenhouse gas emissions are allocated into sectors as follows:Energy SupplyEmissions from electricity generation and other energy production activitiessuch as mining, refining and manufacturing fuels.BusinessEmissions from fuel combustion and product use in industrial and commercialsectors, and F gas emissions from refrigeration and air conditioning in allsectors. Includes industrial off-road machinery but not business-relatedtransport emissions, which are included in the Transport sector.TransportEmissions from road transport, domestic aviation, railways and domesticshipping. Only includes emissions from vehicles and not from transportrelated infrastructure or from air conditioning. International aviation andshipping emissions are not included in national totals.PublicEmissions from the combustion of fuel in public sector buildings, e.g.,hospitals and schools. Emissions from public transport are included in theTransport sector.ResidentialEmissions from residential properties, including from consumer product use.Primarily consists of fuel combustion for heating/cooking, garden machinery,and fluorinated gases released from aerosols and metered dose inhalers.AgricultureEmissions of greenhouse gases from livestock, agricultural soils (excludingcarbon stock changes which are included in the LULUCF sector) andagricultural machinery.Industrial processesEmissions resulting from industrial processes, except for those associatedwith fuel combustion which are included in the Business sector.Land use, land usechange and forestry(LULUCF)Emissions/removals of CO2 from changes in the carbon stock in forestland,cropland, grassland, wetlands, settlements and harvested wood products, andof other greenhouse gases from drainage (excl. croplands and intensivegrasslands) and rewetting of soils, nitrogen mineralisation associated withloss and gain of soil organic matter, and fires. Because the impact of biomassharvest on carbon stocks in ecosystems is included in this sector, anyemissions of CO2 from burning biomass (regardless of the country of origin)are excluded from other sectors to avoid double counting them.Waste managementEmissions resulting from the treatment and disposal of solid and liquid waste,for example from landfill, incineration and composting. Emissions fromincineration with energy recovery are instead reported in the Energy Supplysector and emissions from residential composting are included in theResidential sector.4
2020 UK greenhouse gas emissions, Provisional figuresThese high-level sectors are made up of several more detailed sectors, which follow thedefinitions set out by the Intergovernmental Panel on Climate Change (IPCC) 1 and which areused in international reporting tables which are submitted to the United Nations FrameworkConvention on Climate Change (UNFCCC) 2 every year. It is important to note that thesefigures are based on provisional energy data and are subject to change. The sectoralbreakdown is given mainly for information, and is included in the publication for completeness,but sectoral estimates are more uncertain than the overall total.These estimates cover the Kyoto “basket” of seven gases: carbon dioxide (CO2), methane(CH4), nitrous oxide (N2O), hydrofluorocarbons (HFC), perfluorocarbons (PFC), sulphurhexafluoride (SF6) and nitrogen trifluoride (NF3). The last four gases are collectively referred toas fluorinated gases or F gases. In accordance with international reporting and carbon tradingprotocols, emissions from each of the gases is weighted by its global warming potential(GWP) 3, so that total greenhouse gas emissions can be reported on a consistent basis. TheGWP for each gas is defined as its warming influence relation to that of carbon dioxide over a100-year period. Greenhouse gas emissions are then presented in carbon dioxide equivalentunits (CO2e).Carbon dioxide is reported in terms of net emissions, which means total emissions minus totalremovals of carbon dioxide from the atmosphere by carbon sinks. Carbon sinks are defined bythe UNFCCC as “any process, activity or mechanism which removes a greenhouse gas, anaerosol or a precursor of a greenhouse gas from the atmosphere”.The provisional estimates are not used for any formal reporting of how the UK is performingagainst its emissions reduction targets, as this requires final estimates based on the UK’sgreenhouse gas inventory. However, these statistics give policy makers and other users aninitial steer as to the trend in emissions between 2019 and 2020, which helps them to form aninitial assessment of the extent to which the UK is on track to meet targets. For information onUK emissions targets and progress towards them, see the 2019 final UK greenhouse gasemissions ://unfccc.int/3 The global warming potentials (GWPs) used are from Working Group 1 of the IPCC Fourth Assessment Report:Climate Change 2007 and summarised in a table published on the following -greenhouse-gas-emissions-explanatory-notes125
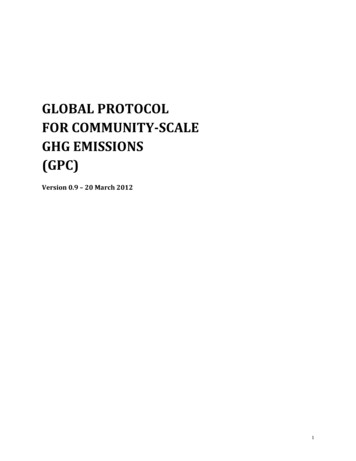
2020 UK greenhouse gas emissions, Provisional figures2020 UK provisional emissions resultsIn the data tables accompanying this publication, table 1 shows UK annual territorialgreenhouse gas emissions, including a breakdown by source sector for carbon dioxideemissions. Table 3 shows quarterly moving annual totals for these emissions and table 5the totals for individual quarters, with tables 4 and 6 respectively showing the equivalenttemperature adjusted estimates.In 2020, the coronavirus (COVID-19) pandemic and the resulting restrictions brought inacross the UK had a major impact on various aspects of UK society and the economy. Thereare a range of statistics available from across the UK government and the devolvedadministrations showing the impact it has had, including profound changes to travel andeconomic activity 4,5. As a result, COVID-19 will have had a significant impact on greenhousegas emissions in the UK in 2020, in particular from transport and from businesses, although itis not possible to identify the exact size of this effect as other factors will have also played apart in the changes seen during 2020.Territorial carbon dioxide emissions are provisionally estimated to have fallen by 10.7% (39.0Mt) in 2020 from 2019, and total greenhouse gas emissions by 8.9% (40.7 MtCO2e). This isthe largest proportional fall in UK greenhouse gas emissions in a single year since the start ofthe data series in 1990, slightly larger than the 8.6% fall seen in 2009 during the recession,although in absolute terms there were larger emission reductions in 2009 (of 56.1 MtCO2e)and 2011 (of 45.5 MtCO2e). At 414.1 MtCO2e, greenhouse gas emissions in the UK in 2020were 48.8% lower than in 1990. Because these provisional estimates are based on energydata it is only possible to make estimates of carbon dioxide emissions from different sourcesectors and not estimates of other gases, so the rest of this section presents the trends incarbon dioxide emissions.Emissions were particularly reduced during the second quarter of 2020, from April to June,when carbon dioxide emissions fell by 24.6% from the same period the year before. Thisfollowed the nationwide lockdown that began on 23 March 2020, when many businesseswere closed and people were instructed to stay at home as much as possible. Transport wasparticularly affected, with emissions falling by 43.9% compared to the same quarter theprevious year, largely as a result of the large fall in the use of road transport 6. During thesecond half of the year when there were fewer restrictions in place emissions did not fall tothe same extent, with carbon dioxide emissions 8.0% lower than in the second half of 2019.Coronavirus (COVID-19): 2020 in charts, Office for National Statistics 5 Coronavirus (COVID-19) roundup, Office for National 6 Transport use during the coronavirus (COVID-19) pandemic, Department for Transport c46
2020 UK greenhouse gas emissions, Provisional figuresFigure 1: Percentage change in quarterly UK carbon dioxide emissions from yearbefore, Q1 2009 - Q4 2020Source:Table 5, Provisional UK territorial greenhouse gas emissions national statistics 1990-2020 Excel data tablesNote:(p) 2020 estimates are provisional.Overall, across 2020, carbon dioxide emissions in the transport sector fell by an estimated19.6% (23.7 Mt), but it remained the largest emitting sector in the UK, accounting for 29.8%of carbon dioxide emissions in 2020. A further 24.2% of carbon dioxide emissions were fromenergy supply, 20.8% from the residential sector and 18.2% from business.Carbon dioxide emissions in the energy supply sector decreased by 11.9% (10.6 Mt),between 2019 and 2020. This will have been affected by the pandemic, with lower demandfor electricity and fuels, and by the continued change in the fuel mix for electricity generationthat has been seen in recent years, with lower use of coal and increased use of renewablesin 2020 compared to 2019.Business sector territorial carbon dioxide emissions decreased by 8.7% (5.7 Mt) and publicsector emissions by 2.0% (0.2 Mt) between 2019 and 2020. Both will have been affected bythe restrictions during the pandemic, the business sector in particular as large numbers ofbusinesses either closed or reduced their activities for periods of 2020. Both will also haveseen slightly reduced emissions due to the warmer temperatures in 2020 compared to 2019,which will have reduced the use of heating in buildings.The residential sector was the one sector to see an increase in carbon dioxide emissions in2020, of 1.8% (1.2 Mt) compared to 2019. These emissions are predominantly from the useof fuels for heating and cooking, but do not include emissions associated with electricity useas these are included in the energy supply sector. This increase was despite the warmerweather conditions and follows the instruction for people to stay at home for periods of theyear, including many more people either working from home or unable to go to work due tothe coronavirus restrictions.Between 1990 and 2020, UK territorial carbon dioxide emissions decreased by 46.4%. Whilethe pandemic led to a notable fall in emissions in 2020, the largest factor behind this longterm decrease was the change in the mix of fuels being used for electricity generation, with a7
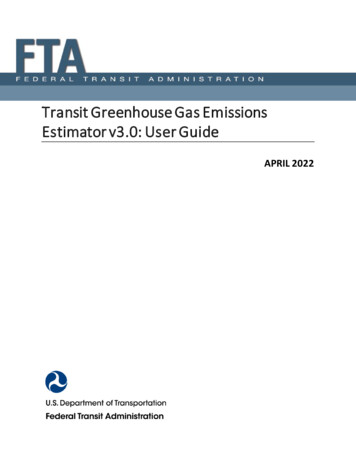
2020 UK greenhouse gas emissions, Provisional figuresshift away from coal first to gas in the 1990s, and more recently to renewable energy sources.This was combined with lower electricity demand, owing to greater efficiency resulting fromimprovements in technology and a decline in the relative importance of energy intensiveindustries. Overall inland energy consumption is provisionally estimated to have decreasedby 23.0% since 1990, and if this figure is adjusted to allow for the effect of temperature, therewas a 23.6% decrease over this period.Figure 2: Actual and temperature adjusted territorial greenhouse gas emissions, UK,Year to Q1 2009 - Year to Q4 2020 (MtCO2)Source: Tables 3 & 4, Provisional UK territorial greenhouse gas emissions national statistics 1990-2020 Excel data tablesNote:1. Figures are annual totals including the preceding 4 quarters.2. From year ending Q1 2020 onwards, figures include provisional data.As shown in Figure 2 above, temperature adjusted territorial greenhouse gas emissions showa similar overall trend to non-temperature adjusted emissions. Over the most recent ten-yearperiod, temperature adjusted UK territorial greenhouse gas emissions decreased by 27.3%,similar to the fall in actual emissions over this period (32.2%).Energy SupplyCarbon dioxide emissions from this sector are provisionally estimated to be 79.0 Mt in 2020, adecrease of 11.9% (10.6 Mt) compared to 2019.This fall was mainly as a result of a 13.3% (7.7 Mt) fall in carbon dioxide emissions from powerstations. In 2020, carbon dioxide emissions from power stations, at 50.1 Mt, accounted for15.4% of all carbon dioxide emissions. Carbon dioxide emissions from power stations were75.3% lower in 2020 than in 1990. This is despite consumption of electricity being provisionallyestimated to be around 1.1% higher in 2020 than in 1990 (although it peaked in 2005 and hasdecreased since then).This long-term decrease has mainly resulted from changes in the mix of fuels being used forelectricity generation with a switch from coal to natural gas and growth in the use of renewableenergy sources, combined with greater efficiency resulting from improvements in technologyand a decline in the relative importance of energy intensive industries. In 2020 coal made up2.6% of fuel used for electricity generation, compared to 65.3% in 1990. Nuclear and8
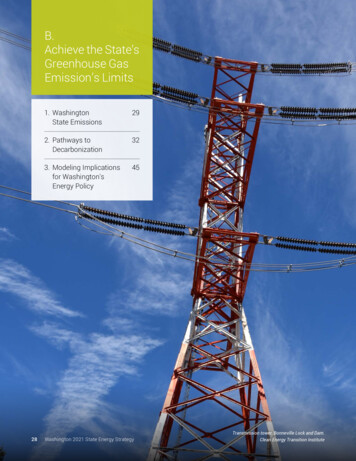
2020 UK greenhouse gas emissions, Provisional figuresrenewables, which are low carbon energy sources, accounted for 56.3% of fuel used forelectricity generation in 2020, up from 22.2% in 1990.Figure 3: Fuel mix for UK electricity generation, 1990-2020 (Million tonnes of oilequivalent)Source:Table 5.1.1, Digest of UK Energy Statistics (DUKES) 1970-2020 and Table 5.1 Energy Trends: March 2021 Excel data tablesNote:(p) 2020 estimates are provisional.Figure 4: Territorial carbon dioxide emissions from power stations, UK, 1990-2020(MtCO2)Source:Tables 1 & 2, Provisional UK territorial greenhouse gas emissions national statistics 1990-2020 Excel data tablesNote:(p) 2020 estimates are provisional.9
2020 UK greenhouse gas emissions, Provisional figuresFigure 5: Territorial carbon dioxide emissions from power stations compared to carbondioxide emissions from other sectors, UK, 1990-2020 (MtCO2)Source:Note:Table 1, Provisional UK territorial greenhouse gas emissions national statistics 1990-2020 Excel data tables(p) 2020 estimates are provisional.Residential and Public sectorsThe main source of emissions in these sectors is the use of natural gas for heating (and forcooking in the case of the residential sector). It should be noted that emissions from thesesectors do not include emissions from the generation of electricity consumed, as theseemissions are included in the energy supply sector.In 2020, the residential sector emitted 67.7 MtCO2, accounting for 20.8% of all carbon dioxideemissions. Emissions from the public sector were 7.7 MtCO2, accounting for 2.4% of allterritorial carbon dioxide emissions. Between 1990 and 2020 territorial carbon dioxideemissions from the residential sector have fallen by 13.5% and from the public sector 42.2%over the same time period.Between 2019 and 2020:-There was a 1.8% (1.2 Mt) increase in residential carbon dioxide emissions-There was a 2.0% (0.2 Mt) decrease in emissions from the public sector.These changes were affected by warmer weather in 2020 than the previous year. On atemperature adjusted basis between 2019 and 2020:-There was a 6.7% (4.8 Mt) increase in residential emissions-There was a 1.3% (0.1 Mt) increase in emissions from the public sector.10
2020 UK greenhouse gas emissions, Provisional figuresTransport sectorTransport was significantly impacted by COVID-19, as people were instructed to stay at homeas much as possible. In 2020, territorial carbon dioxide emissions from the transport sectorwere 97.2 Mt, 19.6% (23.7 Mt) lower than in 2019, and 22.5% lower than in 1990. In 2020transport accounted for 29.8% of all territorial carbon dioxide emissions, compared to 33.1% in2019. The large majority of emissions from transport are from road transport.Primarily as a result of a continual growth in vehicle kilometres travelled on roads 7, transportcarbon dioxide grew to a peak in 2007, 8.5% higher than in 1990. Since then, emissions fromthis sector had fallen back to around 1990 levels up until 2019, driven mainly by improvementsin new car fuel efficiency 8, as well lower traffic growth than in previous years as a result of adip following the 2008/2009 recession.It should be noted that these estimates do not include emissions from international aviationand shipping. Domestic aviation (i.e., flights taking off and landing within the UK) and shipping,however, are included.Figure 6: Territorial carbon dioxide quarterly emissions from Transport, UK, 2008-2020(MtCO2)Source:Table 5, Provisional UK territorial greenhouse gas emissions national statistics 1990-2020 Excel data tablesNote:(p) 2020 estimates are provisional.Transport Statistics Great Britain, Roads and traffic (TSGB07), Table TSGB0702 (TRA0201) Road traffic (vehicle kilometres) by vehicle typein Great Britain, annual from 1949 s/tsgb078Transport Statistics Great Britain, Energy and environment (TSGB03), Table TSGB0303 (ENV0103) Average new car fuel consumption:Great Britain from 1997 s/tsgb03711
2020 UK greenhouse gas emissions, Provisional figuresBusiness sectorTerritorial carbon dioxide emissions from the business sector were estimated to be 59.4 Mt in2020 and accounted for around 18.2% of all carbon dioxide emissions. There has been a46.8% decrease in business sector emissions since 1990. Most of this decrease camebetween 2001 and 2009, with a significant drop in 2009 likely to have been driven by economicfactors.Between 2019 and 2020 carbon dioxide emissions from this sector decreased by 8.7% (5.7Mt). This decrease in 2020 follows the nationwide lockdown and restrictions due to the COVID19 pandemic, including the closure of non-essential shops, pubs, restaurants and venuesduring the national lockdowns. Trading volumes decreased, there was an increase in businessclosures and a decrease in the overall UK economy was reported over the time period 9.Other sectorsFor the agriculture, waste management, and land use, land use change and forestry (LULUCF)sectors provisional territorial carbon dioxide emissions cannot be derived based on energystatistics, so the carbon dioxide emissions from these sectors are assumed to be the same asthey were in 2019. This is also the case for most of the emissions from the industrial processessector.Coronavirus (COVID-19) roundup, Office for National 912
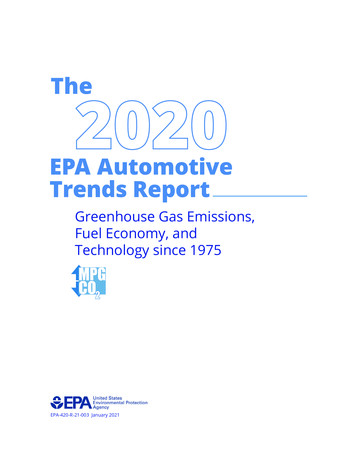
2020 UK greenhouse gas emissions, Provisional figuresCarbon dioxide emissions by fuel typeIn the data tables accompanying this publication, table 2 shows UK territorial carbondioxide emissions by fuel type.The combustion of fuel releases both energy and carbon dioxide. The amount of carbondioxide released by the production of one unit of power depends on the type of fuel that isburned. For example, since coal has a higher carbon content than gas, more carbon dioxideemissions result from burning one tonne of coal to generate a unit of power than from onetonne of gas.Emissions per unit of electricity supplied from fossil fuels are estimated to have been around400 tonnes of carbon dioxide per gigawatt hour (GWh) overall in 2020 in the UK. Within this,emissions from electricity generated from coal (1,010 tonnes of carbon dioxide per GWhelectricity supplied) were over twice as high as for electricity supplied by gas (370 tonnes ofcarbon dioxide per GWh). For all sources of electricity (including nuclear, renewables andautogeneration), the average amount of carbon dioxide emitted in 2020 amounted to 180tonnes per GWh of electricity supplied.In 2020, total territorial carbon dioxide emissions from the use of fossil fuels, including fuelused for generating electricity, were estimated at 301.5 Mt. This was 11.3% lower than the2019 figure of 339.8 Mt. The biggest change in emissions was from the use of petroleum,down 25.3 Mt (17.2%) from 146.7 Mt in 2019 to 121.4 Mt in 2020. This largely resulted fromthe reduction in road transport in the UK during the nationwide lockdown periods. Coal usealso decreased, down 1.8 Mt (15.0%) in 2020, mostly due to the reduced use of coal forelectricity generation.Over the period 1990 to 2020, carbon dioxide emissions from fossil fuels decreased by 46.4%.Over the same period, primary consumption of fossil fuels dropped by 36.2%. This relativelylarge decrease in emissions can be attributed to a large decrease in the use of coalaccompanied by an increase in the use of gas.Territorial carbon dioxide emissions from gas as a proportion of all carbon dioxide emissionsfrom fossil fuels has increased from 26.0% in 1990 to 56.4% in 2020, whilst emissions fromcoal as a proportion of all fossil fuel carbon dioxide emissions has decreased from 38.9% to3.3% over the same period. Oil was responsible for 35.2% of carbon dioxide emissions fromfossil fuels in 1990 and this has increased to 40.3% in 2020.13
2020 UK greenhouse gas emissions, Provisional figuresFigure 7: UK Territorial carbon dioxide emissions by fuel type, 1990-2020 (MtCO2)Source:Table 2, Provisional UK territorial greenhouse gas emissions national statistics 1990-2020 Excel data tablesNote:(p) 2020 estimates are provisional.14
2020 UK greenhouse gas emissions, Provisional figures2020 temperature adjusted provisionalemissions results by sectorIn the data tables accompanying this publication, table 3 shows quarterly moving annualtotals for UK emissions and table 5 the totals for individual quarters, with tables 4 and 6respectively showing the equivalent temperature adjusted estimates.A temperature adjustment has been applied t
greenhouse gas inventory. However, these statistics give policy makers and other users an initial steer as to the trend in emissions between 201 9 and 2020, which helps them to form an initial assessment of the extent to which the UK is on track to meet targets. For information on UK emissions targets and progress towards them, see the