Transcription
Greenhouse Gas EmissionsInventoryUniversity of Texas at ArlingtonThis report summarizes the findings of the GreenhouseGas Emissions Inventory for the University of Texas atArlington. The purpose of conducting the analysis andcreating this document is to clarify the sources ofemissions and to develop short and long term reductionpolicies.
Table of ContentsTopicSection I: IntroductionPage ---Section II: Data Sources and ional perational se ---------6Building ---------------7Purchased Electricity-----------------------------8Steam and Chilled Water-----------------------------8Student Commute-----------------------------8Solid -----------------------9Data Collection by CategoryBudgetPopulation- Students and FacultyRefrigerants and ChemicalsFertilizersOffsetsSection III: -----Section IV: Conclusions and Future 02
Section I: IntroductionThe University of Texas at Arlington is committed to sustainability and stewardship of theenvironment. Sustainability represents societal efforts to meet the needs of the presentwithout compromising the ability of future generations to meet their own needs. A growingnumber of institutions of higher education – along with federal, state, and local governments aswell as corporations – are directing attention to sustainability, as concerned citizens recognizethat the earth’s resources are finite. Because our economy and society are dependent on ahealthy environment, sustainability requires balancing economic success with environmentalconservation, and social equity, also known as the triple bottom line.The University of Texas at Arlington is committed to this triple bottom line and is striving tobecome a leader in campus sustainability through the efforts of administration, faculty, staff,and students. The University is actively engaged in greening facility operations, ngstudentinitiatives,implementingenvironmentally and sustainability focused curriculum, and sponsoring public service initiatives.The Office of Sustainability was established in 2010 to develop a university wide program thatpromotes the principles and mission of the University’s Sustainability Committee (USC). Theoffice of sustainability integrates sustainability practices into all facets of UT Arlington’s missionand master plan, including teaching, research, campus operations, outreach, and communityengagement. All initiatives involve collaboration with faculty, staff, and students as well as localand regional partners like Environmental Protection Agency (EPA), North Central Texas Councilof Governments (NCTCOG).The Carbon footprint analysis is a campus wide initiative coordinated by the Office ofSustainability and guided by a university wide working group (USC) that initiates andcoordinates teaching, research, campus policy, and engagement projects to advance the goalsof UT Arlington. The purpose of conducting this analysis and creating the emissions inventory isto identify the sources of emissions and to develop short and long term reduction targets orgoals. A similar analysis was conducted by UT ARLINGTON in 2008 using ICLEI’s CACP software.It was however acknowledged during the analysis that CACP is tailored for use by government3
entities rather than universities, and the Clean Air Cool Planet calculator was recommended asan alternative.A greenhouse gas emissions inventory is an accounting of the amounts and sources ofemissions of greenhouse gases attributed to the existence and operations of an institution. Thecompletion of such an inventory provides an essential foundation for focused, effectiveoutreach on the issue of sustainability at a university, and the basis for institutional action toaddress it. It is a crucial first step toward comprehensive campus climate action efforts.Section II: Data Sources and MethodologyThe Clean Air-Cool Planet calculator was used for UT Arlington’s inventory. We selected thecalculator because it was designed specifically for higher education campuses, measures the sixgreenhouse gases identified in the Kyoto Protocol (CO2, CH4, N2O, HFC and PFC, and SF6), andassists with future projected trends.Clean Air-Cool Planet offers a Campus Greenhouse Gas Emissions Inventory Calculator, an MSExcel-based spreadsheet tool, for use in completing these activities. The Calculator incorporatesthree steps, providing procedural protocols and a framework for investigation. Thespreadsheets, based on workbooks by the Intergovernmental Panel on Climate Change (IPCC)for national inventories, have been adapted for institutional use.The major emission source categories are on-campus energy production, purchased electricity,transportation, waste, agriculture and refrigerants. Looking at the emissions levels in each ofthese categories provides a good idea of the best opportunities for emissions reduction. TheCampus Carbon Calculator uses standard methodologies codified by the Greenhouse GasProtocol (GHG) Initiative, and employed by corporations, the state of California, The ClimateRegistry, and other entities to account for greenhouse gas emissions. The GHG Protocolpresents a useful accounting concept, called scopes, that can help entities understand andstructure decisions about operational boundaries, and can simultaneously help address thepotential for “double counting”. This approach defines three levels of responsibility for4
emissions, and basically posits that an entity’s responsibility for emissions is directly related toits control over, or ownership of, the sources of those emissions. In order to make future datacollection easier, all data is recorded in the fiscal years September 1 through August 31- andentered by the year in the which the fiscal year starts (i.e., FY 2007-08 appears in CA-CP as year2007).Institutional BoundariesInstitutional boundaries were set to include all operations over which the university hascontrol-UT Arlington owned or leased buildings, number of students (full time equivalent),faculty and staff, the university vehicle fleet, waste stream (including food waste).Operational BoundariesInventoried emissions were categorized into three types:Category 1 – Direct GHG Emissions-Sources include natural gas, University fleet fuel, and fertilizersCategory 2 – GHG Emissions from Imports of Electricity-Sources include all electricity consumptionCategory 3 – Other Indirect GHG Emissions-Sources include student and faculty daily commutes, waste sent to landfillsExclusionsSeveral sources of University emissions are outside the scope of this inventory. In most cases,these emissions are excluded because of a lack of sufficient data. The omitted activities include:University related ground travel for which the University fleet was not used; and Universityrelated air travel. Obtaining University-related travel data from individuals was deemedinfeasible at this time. Emissions from excluded activities, as well as those from satellitecampuses, will be considered at a later time.5
Base YearFiscal year 2005-06 was selected as the base year. For some indicators, we have data going backto 1990. But this historic data was not available for all the indicators. 2005-06 was the mostrecent year for which complete information was available for all the indicators. Reduction goalsin the Action Plan will use 2005-06 as the benchmark year.Data Collection by CategoryThis section contains detailed information of data collection and entry into CA-CPBudgetThe Operating budget consists of all sources of funding UT Arlington has financial control of andis plainly considered as the cost to operate the institution. Research dollars includes all sourcesof financial funding that UT Arlington receives for its cumulative research endeavors. Energybudget is total spent providing the energy needs of all operations. Operational budget data forall fiscal years (1990-91 to 2009-10) was received from the Office of Finance andAdministration. Energy Budget data for all fiscal years (1990-91 to 2009-10) was received by theOffice of Facilities Management. The combined budget includes budget for electricity, steamand chilled water, and on-campus stationary sources (heating, etc). Research budget data wasavailable for the years 2005-09.Population- Students and FacultyThe fall semester was chosen as a reasonable representation of the university population whichincludes full time and part time students, and each category includes both graduate andundergraduate students. We choose to exclude summer students as suggested by the CA-CPtool. Faculty data also includes full time and part time. The information was provided by theInstitutional Research, Planning and Effectiveness office. Staff data has not been included.6
Building SpaceTotal building size data was provided by the Office of Facilities Management for the fiscal years1990-91 to 2008-09. Research building data was also provided by the Office of FacilitiesManagement for the fiscal years 2005-06 to 2008-09.TransportationThis category includes the emissions from any vehicles that are owned by the university. Theinformation was provided by the Office of Facilities Management. The data includes gallons ofgasoline and diesel used by the university fleet for the years 1990-01 through 2009-10 andalternative fuel (compressed natural gas) for the years 1990-91through 2006-07. The decreasein the usage of the natural gas was due to the reduced usage of the CNG vehicles. Due to thelack of fueling stations within reasonable distance from the campus, it was not feasible toconvert the fleets from gasoline to CNG.Table 1: Consumption of diesel and gasoline by the University FleetYearDieselGasolineNatural gasNatural gasin gallonsin gallonsin gallonsin 9-20103976.6825517.42--*MMBtu (0.00014MMBtu/1gallons of natural gas) (x gallons of natural gas)7
Refrigerants and ChemicalsR-22 and CFC-22 is employed in space conditionally applications at the Thermal Energy Plant onCampus. Chlorodifluoromethane or difluoromonochloromethane is a hydrochlorofluorocarbon(HCFC). This colorless gas is better known as HCFC-22, R-22. The losses of R-22 were obtainedfor the years 2000, 2001, 2005-2009 by the HVAC shop and entered for HCFC-22 in thecalculator.FertilizersThis section includes fertilizer application on grounds and fields as part of the university’slandscaping operations. Synthetic fertilizers are used for grounds keeping and de-icing by thehousing department. Synthetic fertilizers are labeled with their chemical makeup to representthe percentages of nitrogen (N), phosphorus (P), and potassium (K). 10,000 lbs of 25-3-5 ( 2500 lbs of nitrogen) and 500 lbs of 46-0-0 fertilizer ( 230 lbs of nitrogen) is used annuallyby UT Arlington. This equals 2720 lbs or 27.3% of nitrogen. According to the Office of FacilitiesManagement, the fertilizer usage has remained constant through the timeline considered forthis inventory.Purchased ElectricityScope 2 emissions from purchased electricity are likely to be a significant emissions source. Thee-grid sub region was chosen as “ERCT” under the region “ERCOT ALL” for pre and post 2006 eGRID sub region choices. An e-grid sub-region represents a portion of the US power grid that iscontained within a single North America Electric Reliability Council (NERC) region, and generallyrepresents sections of the power grid which have similar emissions and resource mixcharacteristics, and may be partially isolated by transmission constraints. E-grid’s emissionsrepresent emissions from fuel only used for generating electricity.8
KWh of electricity used per year for the fiscal years 1990-91 through 2009-10 was obtained by the Office ofFacilities Management.Steam and Chilled WaterSteam is being generated using natural gas as fuel. The natural gas consumption data for thefiscal years 1990-91 through 2009-10 were provided by the Office of Facilities Management.Chilled water is generated using electricity and has already been accounted for in the“Purchased Electricity” and therefore no data has been entered for this section.Student CommuteThis category includes the number of annual miles traveled by faculty, staff, and student. Thereason this is an integral part of the inventory is because the university can influence this travelin future by offering alternatives like bus, shuttle or a car sharing program. In this analysis weincluded the data for only student commute, assumed 100% personal vehicle travel, 4 times aweek. The total number of weeks per year is based on the university calendar for spring andfall; 16 weeks in spring and fall. The numbers of summer students have been excluded. Werestricted our radius to 60 miles around campus for calculating the total miles traveled.9
Solid WasteA fairly representative data for the tonnage of waste from the UT Arlington to the City ofArlington’s landfill was obtained for the fiscal year 2007 and 2008 by Republic Services. There isno methane recovery.OffsetsOffsets are operations or activities that the organization undertakes to compensate for thedamage to the environment. These activities can include recycling or investing in cleantechnologies or sustainable activities whose positive impacts are measureable. UT Arlington hasan onsite compost program since 2001, and hence this program qualifies as an Offset withAdditionality. The weights of the composted material have been obtained from the RecyclingCoordinator for offsets.10
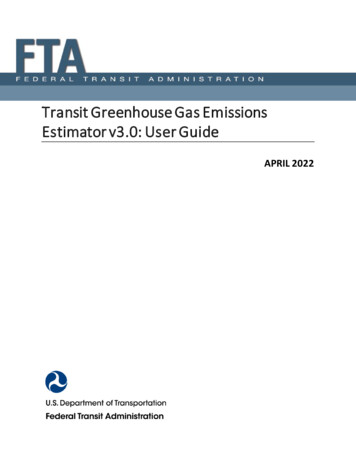
Section III: FindingsThe total emissions for Scope 1, 2, and 3 are shown in Table 1Emissions in2005%2010%2015%2020%Fertilizer 855.53.731216.61.251468.11.451719.51.65Scope 2 T&D6678.16.476368.76.536569.36,516769.86.49Solid sity .410097430.4100100842.9100104290.3100Metric TonsCommutingPurchasedElectricityNatural GasusagelossesScope Wise EmissionsScope 1: 10097395.0100100842.7100104290.3100Fuel useScope 2:ElectricityConsumptionScope 3: WasteGeneratedTOTAL711
12
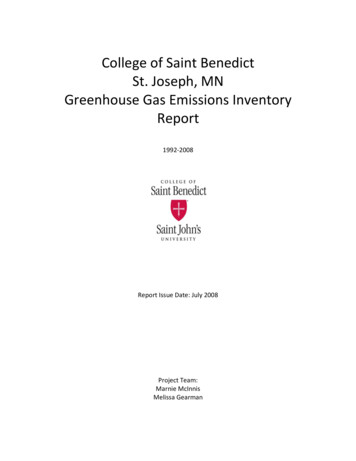
Emissions due to purchased electricity make up for the largest portion of the inventory. UTArlington electricity use has decreased from 78% in 1990 to 56% in 2005-06, despite asignificant increase in the campus population and building space as shown in the figure below.This decrease is due to energy efficiency efforts by the Office of Facilities Management,including performance contracting and various energy efficiency initiatives. The energy budget13
(total spent providing the energy needs for all operations on UT Arlington) has been increasingsince 1990. UT Arlington’s energy Utilization index is 2.42/Sf/year. EUI (Energy UtilizationIndex) is the amount of energy consumed per year (measured in Thousands of British ThermalUnits {MBTU's}), divided by the gross conditioned area in square feet.Table 3: Energy Utilization IndexUT InstitutionEnergy UtilizationIndex (cost/Sf/year)UT Arlington 2.42UT Austin 3.73UT Dallas 3.23UT Pan Am 2.49UT San Antonio 2.9414
Note: The Energy Budget currently includes about 2.1 million for re-payment on the EnergyPerformance Contract with Siemens, which will be paid off in another 6-7 years15
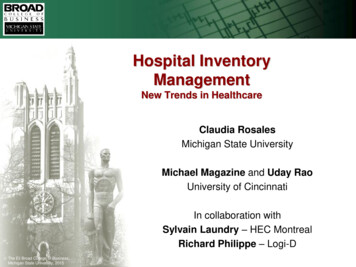
As seen from these three pie and line graphs, Scope 2 Emissions which includes purchasedelectricity, steam and chilled water is projected to be 74.4 % for 2020 as compared to 76.29%for 2007-08. As emphasized earlier, this is because of conservations and energy efficiencymeasures despite growing population and building space.The Scope 1 Emissions are the direct emissions from On-Campus Stationary sources, directtransportation sources, refrigeration and chemicals, and agriculture. Fertilizer applicationmakes up for such a small percentage of the total emissions, that it could be classified as de16
minimus source and not tracked for future inventories. Direct transportation sources, whichinclude the emissions from the University fleet decreased from 4.53 % in 2005-06 to 0.94% in2007-08. It is projected to increase in 2020 to 2.55% as the University grows and the buildingspace and campus population increases. Having more electric/hybrid, CNG vehicles on campuswill help reduce these emissions.Scope 3 Emissions includes solid waste, faculty air travel, commuting, transportation anddistribution losses from purchased electricity, etc. It shows a progressive increase in emissionsfrom 2005-06 to 2007-08 and 2020. Transportation data collection was the most difficult task ofthe entire inventory. Historic data was sparse at best, and several assumptions were necessary.Based on campus population numbers and information from the Institutional Research,Planning and Effectiveness office, we can assume a steady increase in commuter emissions.Promoting and offering car sharing, car pooling, and bike and hike program in the coming yearscan help reduce these emissions. We will revisit these findings in the future after we haveaccess to more data on air travel by faculty and faculty/staff commute.Solid waste is also an integral part of Scope 3 Emissions. The data for solid waste reductions hasnot been collected or tracked. No historic data is available for this indicator. The data wasavailable for 2006-07 and 2007-08. We will revisit these findings in future if we get informationon historic data. Going forward it will be beneficial to track the numbers more efficiently andcorrectly.17
Section IV: Conclusion and future stepsAs seen in the graph above, the CO2 emissions for UT Arlington show a slight upward trend for2020. The purpose of this report is to provide an accurate snapshot of UT Arlington’s currentGHG emissions, utilize historic emissions data to project trends for 2020, and to be transparentand thorough about the methodologies, data collection, and interpretation. This report will be auseful tool for the Office of Sustainability and the University’s Sustainability Committee as itmoves forward drafting a Sustainability/Climate Action Plan. With a CAP, UT Arlington will set atarget date and interim milestones for reducing the CO2 emissions. The CAP is a vital piece ofthe University’s commitment to Sustainability and provides a tool for planning futureoperations and management strategies.The UT Arlington has not signed the American College and University Presidents ClimateCommitment (ACUPCC). Like many institutions, considering the growth and increase in campuspopulation, UT Arlington’s GHG emissions have increased over the past few years. However,the decreases in electricity and natural gas usage appear to be positive sign. Clearly, we mustchannel our focus on energy conservation, reducing natural gas and electricity usage, andharboring a behavior change to focus on a more sustainable campus18
Considering UT Arlington’s commitment to sustainability and energy conservation efforts, it isin UT Arlington’s best interest to identify measures and strategies to reduce the carbonfootprint over the coming years as seen by the increasing trend in the graph. Kyoto mandates7% reductions below 1990 levels by 2012. Using the emissions inventory as a guideline, theUniversity’s Sustainability Committee will work to prepare a comprehensive plan for campussustainability, including interim objectives and targets19
AcknowledgementsThis report required cooperation from many people, most of whom are very busy with theirregular duties and responsibilities. Thank you to everyone for taking the time to help preparean accurate and thorough measurement of our campus greenhouse gas emissions, and toPresident James Spaniolo and Vice President John Hall for their support and insight to committhe university to addressing long term planning and implementation of sustainability initiativeson campus.Our Sincere thanks to:Office of the PresidentOffice of Facilities ManagementArlington Regional Data CenterOffice of Human ResourcesProcurement ServicesUT ARLINGTON LibrarySchool of Urban Planning and AffairsDepartment of Finance and AdministrationVinodh Valluri- MS in Environmental & Earth Sciences, UT ArlingtonJeff Howard - Asst. Professor, School of Urban & Public AffairsMegan Topham - Director of Operations, UT Arlington Fort Worth CenterNicholas Stefkovich- Republic Services20
Clean Air-Cool Planet offers a Campus Greenhouse Gas Emissions Inventory Calculator, an MS - Excel-based spreadsheet tool, for use in completing these activities. The Calculator incorporates three steps, providing procedural protocols and a framework for investigation. The