Transcription
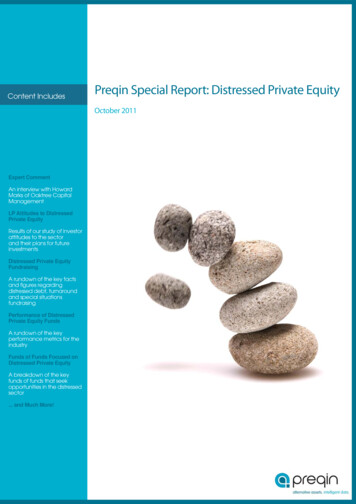
Preqin Investor Outlook:Alternative AssetsH2 2015Private EquityHedge FundsReal EstateInfrastructurePrivate Debtalternative assets. intelligent data.
1. Alternative AssetsContentsForeword .2Section One: Alternative AssetsParticipation in Alternative Assets .3Views on Alternatives and Future Plans .Targeted Returns and Main Reasons for Investing inAlternatives .Views on the Alternative Investment Fund ManagersDirective (AIFMD) .Fund Terms and Alignment of Interests .4Investor Activity on Preqin Investor Network .9567Section Two: Private EquitySection Four: Real EstateIntroduction .27Satisfaction with Returns .Investor Activity in the Next 12 Months and the LongerTerm .Alternative Methods of Accessing the Asset Class .28Investor Objectives for Real Estate .293132Fees and Alignment of Interests .33How Investors Source and Select Real Estate Funds .34Section Five: InfrastructureIntroduction .Satisfaction with Returns and Allocations toInfrastructure .Investor Activity in the Next 12 Months and the LongerTerm .Alternative Methods of Accessing the Asset Class .35Introduction .11Satisfaction with Returns .12Investor Activity in H1 2015 .Investor Activity in the Next 12 Months and the LongerTerm .Strategies and Geographies Targeted .131415Alternative Methods of Accessing the Asset Class .16Key Issues and Regulation .17Section Six: Private DebtFees and Alignment of Interests .18Introduction .43General Perception of the Private Debt Market .4445Section Three: Hedge FundsIntroduction .19Satisfaction with Returns .20Investor Activity in the Next 12 Months .21Key Issues and Regulation .22Fees and Alignment of Interests .23How Investors Source and Select Hedge Funds .243638Investor Objectives for Infrastructure .4041Fees and Alignment of Interests .42Satisfaction with Returns .Investor Activity in the Next 12 Months and the LongerTerm .Strategies and Geographies Targeted .Fees and Alignment of Interests .464748Data Pack for Preqin Investor Outlook: Alternative Assets, H2 2015The data behind all of the charts featured in the report is available for free in an easily accessible datapack. It also includes ready-made charts that can be used for presentations, marketing materialsand company reports.To download the data pack from Preqin’s Research Center Premium, please visit:www.preqin.com/investoroutlookAll rights reserved. The entire contents of Preqin Investor Outlook: Alternative Assets, H2 2015 are the Copyright of Preqin Ltd. No part of this publication or any information contained in it may be copied, transmitted by any electronicmeans, or stored in any electronic or other data storage medium, or printed or published in any document, report or publication, without the express prior written approval of Preqin Ltd. The information presented in Preqin InvestorOutlook: Alternative Assets, H2 2015 is for information purposes only and does not constitute and should not be construed as a solicitation or other offer, or recommendation to acquire or dispose of any investment or to engage in anyother transaction, or as advice of any nature whatsoever. If the reader seeks advice rather than information then he should seek an independent financial advisor and hereby agrees that he will not hold Preqin Ltd. responsible in lawor equity for any decisions of whatever nature the reader makes or refrains from making following its use of Preqin Investor Outlook: Alternative Assets, H2 2015While reasonable efforts have been made to obtain information from sources that are believed to be accurate, and to confirm the accuracy of such information wherever possible, Preqin Ltd. does not make any representation or warranty that the information or opinions contained in Preqin Investor Outlook: Alternative Assets, H2 2015 are accurate, reliable, up-to-date or complete.Although every reasonable effort has been made to ensure the accuracy of this publication Preqin Ltd. does not accept any responsibility for any errors or omissions within Preqin Investor Outlook: Alternative Assets, H2 2015 or forany expense or other loss alleged to have arisen in any way with a reader’s use of this publication. 2015 Preqin Ltd. / www.preqin.com1
Preqin Investor Outlook: Alternative Assets, H2 2015ForewordWelcome to Preqin Investor Outlook: Alternative Assets, H2 2015, a unique and in-depth look at the appetite, plans, expectationsand concerns of institutional investors in private equity, hedge funds, real estate, infrastructure and private debt. This reportpresents the views of more than 460 surveyed institutions alongside the in-depth data for more than 12,500 investors available tousers of Preqin’s industry-leading online services. We hope you find this report informative and valuable, and would welcome anysuggestions for future editions.Institutional investors allocate capital to alternative assets to diversify their portfolios and to achieve a broad range of otherobjectives. The high absolute returns generated by private equity, hedge funds’ ability to reduce volatility, the reliable incomegenerated by private debt and the inflation-hedging characteristics of real assets are just some of the attractions for sophisticatedinvestors.It is clear that the institutional community remains confident in the ability of alternatives to help them meet their return objectives.The majority feel returns are meeting or exceeding expectations and, as a result, a much larger proportion of investors plan toincrease their exposure to alternatives than plan to reduce it.There remains huge scope for the alternative assets industry to grow in future years, both as investors build up existing allocations,and as they also further diversify their portfolios to include a wider range of asset classes. Less than one in five institutions hasexposure to four or more alternative asset classes, but with sectors such as private debt and infrastructure becoming ever moreestablished, we are likely to see more and more investors with broadly diversified portfolios comprising of different alternativeasset classes.Preqin’s online services are indispensable fundraising and investor relations tools for any firm managing or looking to manageinstitutional capital. Thousands of professionals use Preqin every day to source new investors, access exclusive information onnew RFPs and fund searches, monitor the market and track competing firms.To find out how Preqin’s services can help your business in the coming months, please do not hesitate to contact at us atinfo@preqin.com or at our New York, London, Singapore or San Francisco offices.Breakdown of RespondentsBreakdown of Respondents by Investor LocationBreakdown of Respondents by Investor TypePrivate Sector Pension FundNorth AmericaEurope43%31%Public Pension FundAsiaPacific22%Rest of World4%16%18%FoundationEndowment Plan6%13%Insurance Company8%Asset Manager10%9%10%10%Family OfficeBank & Investment BankOtherSource: Preqin2Source: Preqin 2015 Preqin Ltd. / www.preqin.com
Participation inAlternative AssetsInstitutional Investors by Number of Alternative Asset Classes Invested InNo Alternatives21%One AlternativeAsset ClassTwo AlternativeAsset ClassesThree AlternativeAsset ClassesFive AlternativeAsset Classes6%13%19%21%Four AlternativeAsset Classes20%Proportion of Institutional Investors Allocating to Each Alternative Asset ClassPrivate EquityHedge Funds52%Real Estate51%Infrastructure59%Private Debt43%36%Breakdown of Institutional Investors in Alternative Assets by Target Allocation to Each Asset Class (As a % of AUM)Private EquityLess than 5%Hedge Funds5-9.9%Real Estate10-14.9%Infrastructure15-19.9%20% or MorePrivate Debt0%10%20%30%40%50%60%70%80%90%100%Institutional Investors’ Plans for Allocations in the Longer TermReduce AllocationIncrease Allocation5%22%Hedge Funds11%Real Estate11%Infrastructure14% 2015 Preqin Ltd. / www.preqin.com51%Private EquityPrivate Debt28%34%44%38%3Section One: Alternative Assets1. Alternative Assets
Preqin Investor Outlook: Alternative Assets, H2 2015Views on Alternativesand Future PlansInstitutional Investors’ General Perception of AlternativeAsset ClassesInstitutional Investors’ Perception of Performance ofAlternative Asset ClassesPrivate EquityPrivate EquityHedge FundsHedge FundsReal EstateReal EstateInfrastructureInfrastructurePrivate DebtPrivate ctations inPast 12 MonthsPerformance MetExpectations inPast 12 MonthsPerformanceFell Short ofExpectations inPast 12 MonthsPlans for the Coming YearInvest Less Capital than in Past12 Months11%33%Invest More Capital than in Past12 MonthsPrivate EquityHedge Funds22%42%19%26%Real Estate14%23%36%Infrastructure38%Private DebtData Source:Preqin’s Research Center Premium is a free online service providing access to up-to-date charts and league tables,research reports and newsletters, fund performance benchmarking tools and slide decks from recent Preqin presentations atconferences. Use Research Center Premium to: Browse industry reports and newsletters Keep track of the latest industry stats with charts and league tables powered by Preqin’s award-winning online services. Access fund performance benchmarking tools and the PrEQIn Private Equity Quarterly Index. Download charts and presentation slide decks to use in upcoming presentations, reports or marketing documents.For more information, or to sign-up for free access, please visit:www.preqin.com/rcp4 2015 Preqin Ltd. / www.preqin.com
1. Alternative AssetsTargeted Returns and Main Reasonsfor Investing in AlternativesInvestors’ targeted absolute returns by asset class are shown below, alongside the top three reasons why investors allocate tothat asset class. Investors target high returns from their private equity portfolios, while primarily using hedge funds for portfoliodiversification, low correlation with other asset classes and reduced volatility. Meanwhile, real assets are targeted for their inflationhedging characteristics and because they generate reliable income, while investors also expect private debt to deliver both steadycash flows and strong risk-adjusted returns.Proportion of InvestorsPrivate Equity vs. Hedge Funds: Targeted Annualized Returns and Main Reasons for InvestingHedge FundsPrivate Equity35%DiversificationHigh Absolute Returns30%Low Correlation to OtherAsset ClassesDiversificationReduce Portfolio VolatilityHigh Risk-Adjusted Returns25%20%15%10%5%22% 4-5%2-3%Lessthan 2%0%Targeted Annualized Returns from PortfolioReal Estate, Infrastructure and Private Debt: Targeted Annualized Returns and Main Reasons For InvestingReal EstateInfrastructurePrivate DebtDiversificationDiversificationReliable Income StreamInflation HedgeReliable Income StreamDiversificationReliable Income StreamInflation HedgeHigh Risk-Adjusted Returns40%Proportion of Investors35%30%25%20%15%10%5%22% 4-5%2-3%Lessthan 2%0%Targeted Annualized Returns from Portfolio 2015 Preqin Ltd. / www.preqin.com5
Preqin Investor Outlook: Alternative Assets, H2 2015Views on the Alternative InvestmentFund Managers Directive (AIFMD)The Alternative Investment Fund Managers Directive (AIFMD), the European Union (EU) regulation introduced to harmonizeregulatory standards across all alternative investment managers across the economic region, has been the topic of much debatesince it was first approved in 2011.Investors are split over whether the directive is having a beneficial or negative impact. Some believe that it provides greatertransparency and more protection, while others believe that there is no need to protect sophisticated investors and that there willbe reduced choice as a result of some firms choosing not to register to market in the EU.Investor Views on the AIFMDGood for the AlternativeAssets IndustryBad for the AlternativeAssets IndustryUnsure?28%49%Reasons Investors See the AIFMD asPositiveProvides Greater Transparencyon the Fund6Reasons Investors See the AIFMD asNegative50%Regulations ProvideAdditional Levels of Protectionfor the Investor35%Will Lead to a Better Quality ofAlternatives Fund12%Will Lead to Greater Choice asan Investor23%Unnecessary Regulation toProtect Qualified Investors50%Will Lead to Reduced Choiceas an Investor35%Will Lead to Higher Fees12%4% 2015 Preqin Ltd. / www.preqin.com
1. Alternative AssetsFund Terms and Alignmentof InterestsInvestors largely feel that their interests are aligned with those of fund managers in most asset classes. The exception is hedgefunds however, with almost half stating that investor interests are not appropriately aligned with those of fund managers. Theredoes seem to be movement towards more investor-friendly terms by hedge fund managers in response to these concerns, with47% of respondents seeing fund terms becoming more investor friendly. It is clear that managers must ensure the fees theycharge are appropriate and aligned with the market, with more than 80% of investors rejecting funds across alternative assetclasses based on fund terms.Proportion of Investors that Feel Fund Manager and Investor Interests Are Properly AlignedPrivate EquityHedge FundsReal EstateInfrastructurePrivate Debt7051807783%%%%%Investor Views on Changes in Prevailing Fund Terms over the Last YearChange in Favour of Fund Manager19%Change in Favour of Investor44%47%Private Equity7%9%11%9%Hedge Funds35%27%37%Real EstateInfrastructurePrivate DebtFrequency with Which Investors Have Decided Not to Invest in a Fund Due to the Proposed Terms and ConditionsPrivate EquityHedge FundsReal EstateInfrastructurePrivate Debt0%10%20%30%Frequently 2015 Preqin Ltd. / ver7
Dynamic, up-to-dateand industry-leadingalternative assets data.For free. Conduct market researchand track industry trends Benchmark fundperformance Access slide decks fromPreqin presentations atconferencesGaining access to Preqin’s Research Center Premium is easy – to register for free,please visit:www.preqin.com/RCPalternative assets. intelligent data.
1. Alternative AssetsInvestor Activity onPreqin Investor NetworkPreqin Investor Network provides asset allocators with free access to key information on all2,200 private equity, private real estate and private infrastructure funds and 15,000 hedge fundscurrently open to investment. This section takes a look at the types of funds in market that investorshave paid particular attention to over the past year.88%97%94%95%88%77%71%100%Funds Screenedin Past Month64%57%55%31%Funds Screenedin Past ThreeMonthsFund of Funds& SecondariesGrowthFunds Screenedin Past YearDistressedPrivate EquityFig. 1.2: Proportion of Private Equity Funds Screenedby Investors on Preqin Investor Network by PrimaryGeographic Focus97%94%Funds Screenedin Past 0%NorthAmericaEuropeAsiaFig. 1.3: Proportion of Real Estate Funds Screened byInvestors on Preqin Investor Network by Primary FundStrategySource: Preqin Investor NetworkFig. 1.4: Proportion of Real Estate Funds Screenedby Investors on Preqin Investor Network by PrimaryGeographic Focus98%100%Funds Screenedin Past ThreeMonthsFunds Screenedin Past YearPrimary Fund Strategy90%Proportion of Funds ScreenedFunds Screenedin Past MonthFund of Funds& SecondariesValue 5%93%94% 94%90%83%82%81%76%80%72%69%70%64% 61% 61%56%60%52%50%40%40%30%30%20%10%0%Core-PlusRest ofWorldPrimary Geographic FocusSource: Preqin Investor NetworkCoreFunds Screenedin Past ThreeMonthsFunds Screenedin Past Year20%Fund TypeProportion of Funds Screened94%90%90%Proportion of Funds Screened100%100%97% BuyoutProportion of Funds ScreenedFig. 1.1: Proportion of Private Equity Funds Screened byInvestors on Preqin Investor Network by Fund Type80%97%93%92%85%80%Funds Screenedin Past Month70%60%57%58%56%Funds Screenedin Past ThreeMonths48%50%40%30%26%21%20%Funds Screenedin Past Year10%0%NorthAmericaEuropeAsiaRest ofWorldPrimary Geographic FocusSource: Preqin Investor NetworkSource: Preqin Investor NetworkPreqin Investor NetworkOver 7,100 investment professionals looking to make new commitments use Preqin Investor Network to access freedetailed information on alternative funds open for investment. Share data with Preqin to ensure these investors have the mostup-to-date information on your funds.For more information, or to update your firm and fund profiles, please visit: www.preqin.com/sharedata 2015 Preqin Ltd. / www.preqin.com9
Preqin Investor Outlook: Alternative Assets, H2 2015Fig. 1.5: Proportion of Infrastructure Funds Screened byInvestors on Preqin Investor Network by Target SizeProportion of Funds Screened80%94% 94%89%90%78%97% 100%100%90%90%Funds Screenedin Past Month76%70%61%60%Funds Screenedin Past ThreeMonths50%40%Funds Screenedin Past Year30%20%Proportion of Funds Screened100%Fig. 1.6: Proportion of Infrastructure Funds Screenedby Investors on Preqin Investor Network by PrimaryGeographic Focus97%89%89%83%94%88%92%81%80%79%72%70%Funds Screenedin Past Month63%60%50%50%Funds Screenedin Past ThreeMonths40%30%Funds Screenedin Past Year20%10%10%0%0%Less than 500mn 500-999mnNorthAmerica 1bn or MoreTarget SizeEuropeAsiaRest ofWorldPrimary Geographic FocusSource: Preqin Investor NetworkSource: Preqin Investor NetworkFig. 1.7: Proportion of Hedge Funds Screened by Investorson Preqin Investor Network by Fund SizeFig. 1.8: Proportion of Hedge Funds Screened by Investorson Preqin Investor Network by Core Strategy90%84%80%64%58%60%48%50%40%Funds Screenedin Past ThreeMonths34%30%21%20% 15%10%90%96%25%Funds Screenedin Past Year85%84%84%80%78%80%69%70%Funds Screenedin Past 26%18%Funds Screenedin Past ThreeMonthsFunds Screenedin Past Year10%OtherRelativeValueMultiStrategyMacro 10bnor More 5-9.9bn 1-4.9bn 500999mn 150499mnLess than 150mnFund SizeLong/Short0%0%EventDriven70%100%92% 94%88%Funds Screened76%in Past Month70% 72%63%92%Proportion of Funds ScreenedProportion of Funds Screened100%Core StrategySource: Preqin Investor NetworkSource: Preqin Investor NetworkIdentify and evaluate alternative investmentopportunities on Preqin Investor Network. View all alternative investment fundscurrently raising capital Track fund-level past performance formanagers with a fund in market Easily request marketing materials frommanagers Access valuable market analysis andbenchmarking toolsSigning up to Preqin Investor Network is easy – to register for free,please visit: www.preqin.com/pin
Positive Outlook Despite Slowing InvestorActivityThe first half of 2015 has seen a furtherincrease in the levels of private equitydry powder available for fund managersto invest, with 965bn* in uncalled capitalat the start of July 2015. With such largelevels of unspent capital, fundraisingand investor activity seems to haveslowed slightly in H1 2015. LPs may beputting off investments while they wait forpreviously committed capital to be putto work. Despite this, attitudes towardsthe asset class remain positive, with thevast majority (87%) of investors reportingthat their private equity investments haveeither met or exceeded expectationsin the past year. In fact, only 11% ofinvestors surveyed indicated they arelooking to invest less capital in privateequity compared to 12 months before,the smallest proportion across all assetclasses (page 14).This shows that LPs are still willing tocommit significant amounts of capitalto fund managers and it is thereforeimperative fund managers know theattitudes of LPs in order to access thismoney. Preqin’s most recent surveyof over 100 institutional investors inprivate equity provides fund managersthat are looking to nurture new andexisting LP relationships with valuableinsight, capturing a wealth of informationon investor sentiment and investmentpreferences.as offering the best opportunities inprivate equity, with 50% of respondentslooking to invest in this fund type in 2015.Notably, 23% of private equity investorssee venture capital funds as presentingthe best opportunities, followed bydistressed private equity and mezzaninefunds, which were viewed as presentingthe best opportunities by 17% and 14%of private equity investors respectively.According to Preqin’s latest survey, just9% of private equity investors are lookingto reduce the number of GP relationshipsthey maintain in their portfolio over thenext two years, compared with 14%six months ago. This will be welcomenews to fund managers, as the statisticsuggests that the LP community at largeis not following the lead of CalPERS, theworld’s largest institutional investor thatwas widely reported to be actively lookingto cut its number of GP relationships.In terms of fund types, the majority ofLPs still see small to mid-market buyoutsFirst-time fund managers continue to beat a disadvantage when looking to securecapital, with 51% of LPs indicating thatthey would not commit to a debut fundmanaged by a new GP. Just under half(47%) of LPs deem the length of a GP’strack record as the most important factorto take into account when decidingwhether to commit to a fund, highlightingthat experience remains vital to a GP’sfundraising success.Key Facts52%42% 60%Proportion of investors that madea commitment to a private equityfund during the first half of 2015,compared to 62% in H1 2014.Proportion of investors that arelooking to increase their allocationto private equity over the next 12months, up from 29% in H1 2014.Proportion of investors that arelooking to make their next privateequity commitment either in H22015 or 2016. 2015 Preqin Ltd. / www.preqin.com65%22% 1.89tn*Excludes private real estate and infrastructure.Proportion of investors thatsee valuations as the biggestchallenge facing investors seekingto operate an effective privateequity program.Proportion of investors that areexpecting to increase their directinvestments through co-investingalongside fund managers in thenext 12 months.Estimated aggregate capital*invested in private equity as of 31December 2014.11Section Two: Private EquityPrivate Equity
Preqin Investor Outlook: Alternative Assets, H2 2015Satisfaction withReturnsFig. 2.1: Investors’ Returns Expectations for Their Private Equity Portfolios, June2013 - June 2015100%90%Proportion of RespondentsWhile the private equity asset classis renowned for its outperformanceover public markets over the longerterm, Preqin has aimed to gauge morespecifically what margin is expectedfrom investors, and how they feel theirprivate equity investments have fared inthe last year. Between 2013 and 2014, anotable period for bull market conditionswith significant stock market highs,there was a decrease in the proportionof investors that expected their privateequity portfolios to beat the public marketby more than 2%. In June 2015, despitepublic market indices nearing recordhighs, the largest proportion of investors(49%) have indicated they expect theirprivate equity investments to exceedpublic market returns by more than 4%.This would be driven by the apparentsuccess of respondents’ private equityinvestments in the last 12 months.35%80%49%Public Market 4.1% and over49%70%Public Market 2.1% to 4%60%50%41%Public Market 2%40%34%30%39%Same as 15Source: Preqin Investor Interviews, June 2013 - June 2015Fig. 2.2 shows that over a third (35%)of respondents stated that their privateequity fund investments had exceededtheir expectations in the last year, whichis a substantial increase on previousyears. In recent times, the proportionof investors that had their expectationssurpassed for their private equityportfolios has been declining, fallingfrom 18% in June 2013 to 12% in June2014. The proportion of LPs that felttheir investments in the asset class hadfallen short of expectations has remainedrelatively constant at 13%.However, there is some notable disparityin satisfaction with returns betweenregions. According to Preqin’s survey,half of investors based in Europe hadtheir expectations exceeded by theperformance of their private equityFig. 2.2: Proportion of Investors that Feel Their PrivateEquity Fund Investments Have Lived up to Expectations,June 2013 - June 2015Fig. 2.3: Proportion of Investors that Feel Their PrivateEquity Fund Investments Have Lived up to Expectationsby Investor s70%60%50%68%MetExpectations74%40%52%30%Fallen Short -150%Source: Preqin Investor Interviews, June 2013 - June s50%40%62%57%30%43%31%Fallen Short ofExpectations20%10%10%12Proportion of RespondentsProportion of Respondents90%fund investments over the past year,as shown in Fig. 2.3. But with 19% ofEurope-based investors reporting thattheir private equity portfolio had fallenshort of expectations, the region has thelargest proportion of dissatisfied LPs.0%19%8%NorthAmericaEurope14%13%AsiaRest ofWorldSource: Preqin Investor Interviews, June 2015 2015 Preqin Ltd. / www.preqin.com
2. Private EquityInvestor Activity inH1 2015Asia-based LPs were the most cautioustowards the asset class in the first half of2015, with only 35% making commitmentsto new private equity funds (Fig. 2.5), astark contrast to the 75% of investors inthe region committing to new funds in H12014. This is likely due to the high levelsof dry powder Asia-based fund managershave ready to put to work, with investorsreluctant to make new commitments untilunallocated capital has been invested.The majority of investors based in NorthAmerica, Europe and all other regionsoutside Asia, however, committed freshcapital to private equity funds in H12015, with 56%, 55% and 67% doing sorespectively, reflecting healthy privateequity investor activity and a positivestance towards the asset class amonginvestors in those regions.Fig. 2.4: Proportion of Investors that Made New Private Equity FundCommitments in H1, June 2012 - June 2015100%90%Proportion of RespondentsGlobalfundraisingwasrelativelysubdued during H1 2015, with a totalof 509 private equity funds raising anaggregate 253bn, notably lower thanthe 272bn collected by 656 vehicles inH1 2014. Preqin’s recent investor surveyhas revealed a slight decline in investoractivity too, with only 52% of respondentsmaking private equity fund commitmentsin the first half of 2015, a decrease fromthe 62% of investors interviewed in June2014. This is somewhat surprising giventhe significant levels of capital beingdistributed back to investors, but could bethe result of record levels of dry powderavailable within the asset class being aconcern to investors.80%47%52%57%70%62%Made NewCommitments in H160%50%40%Did Not Make NewCommitments in ource: Preqin Investor Interviews, June 2012 - June 2015Target AllocationsData Source:Fig. 2.6 indicates that 52% of investorsinterviewed are currently below theirtarget allocation to private equity and afurther 45% are at their target allocation.Encouragingly, despite a slight slowdownin activity in the first half of the year,this suggests that the vast majority ofinvestors interviewed are likely to makenew private equity fund commitmentsgoing forward in order to maintain orwork towards their target allocation.Fig. 2.5: Proportion of Investors that Made New PrivateEquity Fund Commitments in H1 2015 by InvestorLocationPreqin’s Private Equity Online isthe leading source of intelligenceon the industry and includesdetails for all aspects of the assetclass, including fund performance,fundraising, institutional investors,fund managers and more.www.preqin.com/privateequityFig. 2.6: Proportion of Investors At, Above or Below TheirTarget Allocations to Private Equity100%Proportion of Respondents90%70%3%35%80%56%55%67%60%Above TargetAllocationMade NewCommitments in H150%40%65%30%20%Did Not Make NewCommitments in H144%45%33%52%45%At TargetAllocationBelow TargetAllocation10%0%NorthAmericaEuropeAsiaRest ofWorldSource: Preqin Investor Interviews, June 2015 2015 Preqin Ltd. / www.preqin.comSource: Preqin Investor Interviews, June 201513
Preqin Investor Outlook: Alternative
H2 2015 Private Equity Hedge Funds Real Estate Infrastructure Private Debt. 1. Alternative Assets . It is clear that the institutional community remains confi dent in the ability of alternatives to help them meet their return objectives. The majority feel returns are meeting or exceeding expectations and, as a result, a much larger .
