Transcription
PREQININVESTOR OUTLOOK:ALTERNATIVEASSETSH1 2020
PREQIN INVESTOR OUTLOOK: ALTERNATIVE ASSETS, H1 2020Contents3Foreword11Private Equity4Participation in Alternative Assets17Private Debt5Reasons for Investing23Hedge Funds6Equity Market Cycle27Real Estate7Investor Allocations33Infrastructure8ESG39Natural ResourcesData PackThe data behind all of the charts and tables featured in this report is available in Excel format at no extra cost. This datamay be used in marketing materials, presentations, or company reports with appropriate accreditation to Preqin.www.preqin.com/investoroutlookPreqin is the Home of Alternatives , the foremost provider of data, analytics, and insights to the alternative assetscommunity. From pioneering rigorous methods of data collection to developing a revolutionary platform, we havecommitted ourselves to furthering the understanding of alternatives for over 16 years. Through close partnershipwith our clients, we continuously build innovative tools and mine new intelligence to enable them to make the bestdecisions every day. For more information, please contact info@preqin.com.All rights reserved. The entire contents of Preqin Investor Outlook: Alternative Assets, H1 2020 are the Copyright of Preqin Ltd. No part of this publication or any information contained in it may be copied,transmitted by any electronic means, or stored in any electronic or other data storage medium, or printed or published in any document, report or publication, without the express prior written approvalof Preqin Ltd. The information presented in Preqin Investor Outlook: Alternative Assets, H1 2020 is for information purposes only and does not constitute and should not be construed as a solicitation orother offer, or recommendation to acquire or dispose of any investment or to engage in any other transaction, or as advice of any nature whatsoever. If the reader seeks advice rather than informationthen he should seek an independent financial advisor and hereby agrees that he will not hold Preqin Ltd. responsible in law or equity for any decisions of whatever nature the reader makes or refrainsfrom making following its use of Preqin Investor Outlook: Alternative Assets, H1 2020. While reasonable efforts have been made to obtain information from sources that are believed to be accurate, andto confirm the accuracy of such information wherever possible, Preqin Ltd. does not make any representation or warranty that the information or opinions contained in Preqin Investor Outlook: AlternativeAssets, H1 2020 are accurate, reliable, up to date, or complete. Although every reasonable effort has been made to ensure the accuracy of this publication Preqin Ltd. does not accept any responsibility forany errors or omissions within Preqin Investor Outlook: Alternative Assets, H1 2020 or for any expense or other loss alleged to have arisen in any way with a reader’s use of this publication.2
ForewordAmid a slowing global economy and geopoliticaluncertainty, the alternative assets industry hascontinued to grow. Assets under managementballooned to in excess of 10tn as yield-hungryinvestors poured capital into alternatives, and nowonder: most investors we surveyed said that theywere satisfied with the performance of their portfoliosin 2019.1In private equity, 87% of respondents told us that theirinvestments met or exceeded their return expectationsin 2019. The percentages were similarly high acrossthe rest of private capital, though natural resourceshad the lowest share at 71%. Even in the hedge fundspace, investor satisfaction is improving, rising from45% in 2018 to 59% in 2019.Looking at returns across most asset classes, it'sno surprise that investors are largely satisfied withthe performance of their alternatives portfolios. Forexample, among funds of vintages 2007-2016, privateequity achieved the highest median net return of allprivate capital asset classes at 14.9%, followed by realestate at 12.4% and infrastructure at 10.6%. And whilehedge funds did suffer net redemptions of 97bn in2019, performance has improved, jumping from -2.00%in 2018 to 11.45% in 2019.How Are Investors Positioning Their Portfolios?In November 2019, when we surveyed investors, globalmarkets were continuing to move upward and 61%of alternatives investors said that they believed themarket cycle was at its peak. Nevertheless, they werelargely undeterred as far as allocations are concerned.The majority (64%) of private capital investors told usthat their investment plans are unaffected by their viewon the market cycle. This figure is unchanged from the1previous year’s survey, and the proportion looking toinvest more capital as a result of the cycle is actuallyhigher by two percentage points, at 28%.Hedge fund investors, though, are approaching 2020a degree more cautious. Although 51% of hedge fundinvestors say that their portfolio positioning will remainunchanged by the cycle, 43% are making moves toprotect their assets, up from 37% two years ago.What Does This Mean for Future Allocations?Sticking with the program: that’s what a significantproportion of the investors we surveyed plan to do in2020. Our study shows that investors are tacticallyrebalancing for the future, as opposed to drawing back.Across each alternative asset class, a minimum of77% of investors are planning to maintain or increasetheir capital commitments in the next 12 months. Andlooking ahead to the longer term, at least 81% willmaintain or raise their allocations.Although global markets could well be at an inflectionpoint, and uncomfortably high asset pricing is aconcern for investors in most asset classes, our studyclearly shows that investors are keeping faith withalternatives. Given the historical evidence of returnsthrough good times and bad, this strategy may wellturn out to be justified.For institutional investors, fund managers, andadvisors alike, a key ingredient in pursuing selective,robust, and adaptive investment strategies is goodinformation. Preqin is honored to support ourcustomers and the industry with the best possibleinformation. We aim to assist you in finding andselecting the best investment opportunities, and inconnecting you with the best business partners.We surveyed almost 400 investors in November 2019 across six alternative asset classes: private equity & venture capital, private debt, hedge funds, realestate, infrastructure, and natural resources. Preqin Ltd. www.preqin.com3
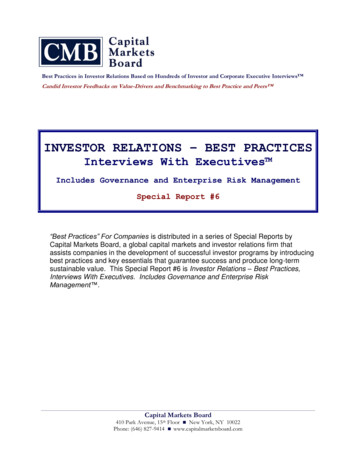
PREQIN INVESTOR OUTLOOK: ALTERNATIVE ASSETS, H1 2020Participation inAlternative AssetsFig. 1.1: Institutional Investors by Number of Alternative Asset Classes Invested rce: Preqin ProFig. 1.2: Institutional Investors Allocating to Each Alternative Asset Class (Incl. Funds of Funds)PRIVATE EQUITYPRIVATE DEBTHEDGE FUNDSREAL %33%Source: Preqin ProFig. 1.3: Institutional Investors by Target Allocation to Each Asset Class (As a % of Total Assets)PrivateEquity11.0%12.9%6.0%Average targetallocationAverage targetallocationAverage targetallocationRealEstateInfrastructureAverage targetallocationAverage targetallocation9.0%Less than 0-14.9%3.5%Average targetallocation15-19.9%20% or MoreSource: Preqin Pro4
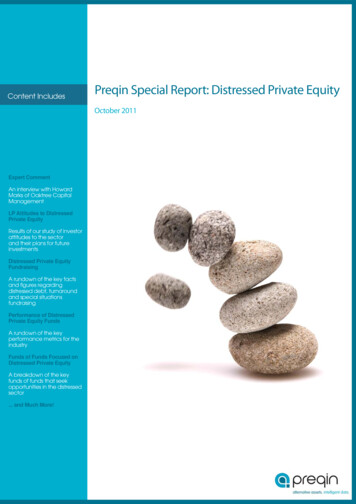
1. ALTERNATIVE ASSETSReasons forInvestingFig. 1.4: Institutional Investors’ Main Reasons for Investing in Alternative AssetsDiversification80%70%60%Reduce PortfolioVolatilityHigh Risk-AdjustedReturns50%40%30%20%10%0%High AbsoluteReturnsReliable IncomeStreamInflationHedgePrivate EquityPrivate DebtLow Correlation toOther Asset ClassesHedge FundsReal EstateInfrastructureNatural ResourcesSource: Preqin Investor Interviews, November 2019Fig. 1.5: Institutional Investors’ Targeted Returns for Their Alternative Assets PortfoliosPrivate Equity12%47%Private Debt 1%39%10%20%10%49%37%Natural Resources 1%7% 1%40%42%Infrastructure 1%6%2%49%49%Real Estate 1%8%53%43%Hedge Funds 1%0%32%8% 1%49%30%40%50%60%12%70%80%90%1%100%Proportion of RespondentsLess than 2%2-7%8-13%14-19%20% or MoreSource: Preqin Investor Interviews, November 2019 Preqin Ltd. www.preqin.com5
PREQIN INVESTOR OUTLOOK: ALTERNATIVE ASSETS, H1 2020Equity MarketCycleFig. 1.6: Investor Views on Where We Are in the Current Equity Market Cycle, 2018 vs. onPeak2%RecessionNov-18TroughNov-19Source: Preqin Investor Interviews, November 2018 - 2019Fig. 1.7: Investor Views on How Their Outlookon the Equity Market Cycle Is Impacting TheirPrivate Capital Investments, 2018 vs. 201964%Fig. 1.8: Investor Views on How Their Outlookon the Equity Market Cycle Is Impacting thePositioning of Their Hedge Fund Portfolios,2018 vs. 201964%54%51%40%26%28%6%10%Investing MoreCapitalNo ChangeNov-187%Investing LessCapitalNov-19Source: Preqin Investor Interviews, November 2018 - 2019643%5%Positioning MoreAggressively– AssetAccumulation Isa PriorityNo ChangeNov-18Positioning MoreDefensively –Asset ProtectionIs a PriorityNov-19Source: Preqin Investor Interviews, November 2018 - 2019
1. ALTERNATIVE ASSETSInvestorAllocationsFig. 1.9: Investors’ Expected Capital Commitments to Alternative Assets in the Next 12 MonthsCompared with the Previous 12 Months, 2018 vs. 2019November 201812%31%Private Equity32%Private ortion of RespondentsMore Capital45%44%14%39%28%17%51%21%Real Estate38%45%17%Infrastructure38%46%16%Natural Resources29%40%41%Hedge Funds26%52%17%100%November 20190%29%0%Same Amount of Capital48%20%40%23%60%80%100%Proportion of RespondentsLess CapitalSource: Preqin Investor Interviews, November 2018 - 2019Fig. 1.10: Investors’ Intentions for Their Alternative Assets Allocations over the Longer Term,2018 vs. 2019November 2018November 20195%49%46%Private Equity5%47%48%Private 40%20%0%Proportion of RespondentsIncrease Allocation7%6%51%27%0%19%58%43%Natural Resources29%54%35%67%20%40%5%9%50%26%Real Estate36%44%41%Hedge Funds29%54%51%60%7%80%100%Proportion of RespondentsMaintain AllocationDecrease AllocationSource: Preqin Investor Interviews, November 2018 - 2019 Preqin Ltd. www.preqin.com7
PREQIN INVESTOR OUTLOOK: ALTERNATIVE ASSETS, H1 2020ESGFig. 1.11: Investors with an Active ESG Policy by Asset ClassPrivate EquityVenture CapitalPrivate DebtHedge FundsReal EstateInfrastructureNatural 2%40%50%60%70%80%90%100%Proportion of RespondentsYesNo, but Expect to within Next 12 MonthsNo, No Plans toUnsureSource: Preqin Investor Interviews, November 2019Fig. 1.12: Rate at Which Investors Reject a FundDue to Inadequate ESG PolicyFrequently9%Sometimes42%26%23%21%23%Do Not ConsiderESG Principlesduring FundEvaluationESG FundsTypically PerformBetterESG FundsTypically PerformAbout the SameNeverSource: Preqin Investor Interviews, November 20198Fig. 1.13: Investor Views on the Performance ofESG Funds vs. Non-ESG Funds56%ESG FundsTypically PerformWorseSource: Preqin Investor Interviews, November 2019
1. ALTERNATIVE ASSETSFig. 1.14: Investor Views on the Benefits of Having an Active ESG PolicyProportion of Future-Proofing Risk-AdjustedComplianceReturnAbsoluteReturnOther AppealsESG Policy Nota ConsiderationSource: Preqin Investor Interviews, November 2019Fig. 1.15: Investor Requirements for FundManagers to Report on ESG70%69%60%7%10%50%40%30%20%ESG Will Stay asIntegral as itCurrently Is13%100%3%76-99%4%51-75%5%26-50%0%1-25%6%10%ESG Is Already anIntegral Part ofthe IndustryESG Will BecomeMore Integral tothe Industry22%0%Proportion of Respondents80%Fig. 1.16: Investor Predictions on How Integral ESGWill Become to the Alternative Assets Industryover the Next 36 Months61%ESG Will BecomeLess Integral tothe IndustryProportion of Managers Required to Report on ESGSource: Preqin Investor Interviews, November 2019Source: Preqin Investor Interviews, November 2019 Preqin Ltd. www.preqin.com9
PREQIN PROYour key to the alternatives marketDATAEverything you need in one placeDiscover the industry’s most comprehensive private capital and hedge fund datasets and aglobal network of 250,000 professionals.TOOLSSpend time on what mattersImprove your productivity with a range of tools for efficient reporting, benchmarking,fundraising, allocation decisions, and business development.ANALYTICSSee through the private marketsBetter understand the trends in the industry and your place in the market with interactivevisual analytics.Find out more on www.preqin.com
2. PRIVATE EQUIT YPrivate Equity:Investors Are Stickingwith the ProgramBuoyed by attractive returns, 86% of investors plan to maintain or increase capitalcommitments in the next 12 monthsIndeed, top-quartile funds of vintages 2015 and 2016are delivering net IRRs of 23.0% and 25.9% respectively.Among private capital funds of vintages 2007-2016,5%Nov-195%68%10% 13%Nov-186%Nov-178%Nov-1415% 11%64% 71% 69% 64%Nov-1674% 77%75%19%30% 24% 26% 26%Nov-1511% 13% oportion of RespondentsFig. 2.1: Investor Views on the Performance ofTheir Private Equity Portfolios over the Past 12Months Relative to Expectations, 2012 - 2019Exceeded ExpectationsMet ExpectationsFallen Short of ExpectationsSource: Preqin Investor Interviews, November 2012 - 2019private equity outperformed all others with a mediannet return of 14.9%. And some investors expect privateequity returns to improve even further. Over a fifth(21%) of surveyed investors expect their private equityportfolios to perform better in the next 12 months, upfrom 17% in 2018 and 15% in 2017 (Fig. 2.2).Asset Prices Continue AscentBut 2020 will not be without its challenges. In each ofthe past five years, our surveys have revealed risingasset valuations as investors’ key concern for returngeneration, and market competition is intensifying– competition for assets is the second most citedchallenge for return generation in 2020 (Fig. 2.3).Fig. 2.2: Investor Expectations for thePerformance of Their Private Equity Portfoliosin the Next 12 Months Compared with the Past12 Months, 2017 - 201970%Proportion of RespondentsPositive Sentiment PrevailsInvestors on the hunt for yield continued to commitcapital to private equity in 2019, boosting totalfundraising to 595bn. This was the third year in arow that the amount secured by private equity fundssurpassed 500bn. A key factor underpinning robustfundraising is investor satisfaction with the performanceof the asset class: 87% of investors told us that theirprivate equity investments met or exceeded their returnexpectations in 2019 (Fig. 0%Will PerformWill PerformWill PerformBetterAbout the SameWorseNov-17Nov-18Nov-19Source: Preqin Investor Interviews, November 2017 - 2019 Preqin Ltd. www.preqin.com11
PREQIN INVESTOR OUTLOOK: ALTERNATIVE ASSETS, H1 2020What Is to Come?A significant majority (61%) of alternatives investorsbelieve the equity market cycle is at its peak (Fig. 2.5),the same percentage as in our November 2018 survey.Even so, amid high asset prices and concerns about aweakening economy, private equity investors are keepingfaith with the asset class. Over the next 12 months, 86%of private equity investors intend to commit at least thesame amount of capital to the asset class as they did inthe past year (Fig. 2.7). What’s more, 95% are planningto maintain or increase their long-term allocations tothe asset class (Fig. 2.16).In a market characterized by high prices for assets, fundmanagers will be looking to prove their ability to sourceattractive opportunities. Fund managers are not theonly ones concerned about valuations – investors are aswell. Sixty-four percent of those surveyed feel portfoliocompany pricing is higher than it was 12 months ago(Fig. 2.4). And given their perception that assets areovervalued, 36% are expecting a price correction in 2020(Fig. 2.6).Investors noted several other key challenges for returngeneration. A third of investors cited rising interest ratesas a concern back in 2019, while only 10% said the sameof 2020 (Fig. 2.3). Twenty-three percent were worriedabout the impact of stock market volatility on returngeneration in 2019, but just 18% said the same of 2020.Secondaries and fund of funds vehicles have attractedgreater investor interest, with 33% and 17% ofinvestors respectively believing they present the bestFig. 2.3: Private Equity Investor Views on the Key Challenges for Return Generation in 2019 vs. 202072%72%Asset Valuations40%Competition for AssetsRising Interest Rates33%10%Exit EnvironmentStock Market VolatilityGeopolitical LandscapeDeal FlowRegulation5%Currency Market VolatilityCommodity Market 0%20%30%40%50%60%70%80%Proportion of Respondents20192020Source: Preqin Investor Interviews, November 2018 - 201925%20%10%0%2% 3%HigherSameNov-18Lower10% 8%UnsureNov-19Source: Preqin Investor Interviews, November 2018 - November Expansion60%61%70%64%Proportion of RespondentsProportion of Respondents70%Fig. 2.5: Alternative Assets Investor Views onWhere We Are in the Current Equity MarketCycle, 2018 - 2019PeakFig. 2.4: Private Equity Investor Views onPortfolio Company Pricing Compared to 12Months Ago, 2018 vs. 2019Nov-19Source: Preqin Investor Interviews, November 2018 - 2019
2. PRIVATE EQUIT YFig. 2.6: Private Equity Investor Views on Portfolio Company Pricing, 2018 vs. 2019Proportion of 5%0%14%12%6%1%0%3%Undervalued, SomeUndervalued,Considerable Room Room for FurtherPrice Risesfor Further PriceRisesFairly ValuedNov-18Overvalued,Correction Morethan 12 Correction Likelywithin Next 12MonthsNov-19Source: Preqin Investor Interviews, November 2018 - 2019Fig. 2.7: Investors’ Expected CapitalCommitments to Private Equity in the Next 12Months Compared with the Previous 12 Months,2015 - 2019Fig. 2.8: Number of Private Equity FundsInvestors Plan to Commit to in the Next 12Months, 2019 vs. 2020*60%Proportion of 17Nov-18Nov-19Less CapitalSame Amount of CapitalProportion of Investors100%50%40%50%35%31%30%22%22%18%20%12% 11%10%0%1 FundMore Capital2-3 Funds20194-9 Funds 10 Funds orMore2020Source: Preqin Investor Interviews, November 2015 - 2019Fig. 2.9: Timeframe for Investors’ Next IntendedCommitment to a Private Equity FundSource: Preqin ProFig. 2.10: Private Equity Investors’ Intentions forForming New GP Relationships over the Next 12MonthsProportion of Respondents70%60%2% 2%59%Only NewRelationships50%40%Mainly NewRelationships, SomeRe-ups28%30%18%20%13%10%0%Q1 2020Q2 2020H2 202011%2021 orLater14%54%Mix of NewRelationships andRe-upsMainly Re-ups, SomeNew RelationshipsOnly Re-upsSource: Preqin Investor Interviews, November 2019Source: Preqin Pro*February 2019 vs. February 2020 Preqin Ltd. www.preqin.com13
PREQIN INVESTOR OUTLOOK: ALTERNATIVE ASSETS, H1 2020targeting emerging markets has declined from 5% to2% in the same period (Fig. 2.12). Among private equityinvestors that are targeting emerging markets, 50% and44% think Southeast Asia and China respectively offersthe best opportunities (Fig. 2.14).opportunities, up from 23% and 8% a year prior (Fig.2.11). And following recent years, investors still favorsmall to mid-market buyout funds; 60% feel theypresent the best opportunities in 2020, up from 54% in2018.Although private equity investors appear committedfor the long term, emerging markets are less presentin their plans – at least for the next 12 months. Theproportion of investors that plan to target only developedmarkets in the coming year has increased from 37% in2018 to 47% in 2019, and the share of respondents solelyFig. 2.11: Investor Views on Fund Types Presenting the Best Opportunities in Private Equity in the Next12 Months, 2018 vs. 201954%Buyout – Small to Mid-MarketGrowth29%23%SecondariesVenture Capital – Early StageVenture Capital – GeneralVenture Capital – Late StageVenture Capital – SeedFund of Funds3%Venture Capital – Venture yout – Large to Mega6%60%34%16%10%20%30%40%Proportion of RespondentsNov-1850%60%70%Nov-19Source: Preqin Investor Interviews, November 2018 - 2019Proportion of RespondentsFig. 2.12: Private Equity Investors' Intentions for Targeted Markets in the Next 12 Months, 2018 vs. 16%3%Only DevelopedMarketsMainly DevelopedMarkets, SomeEmerging MarketsMix of Developed andEmerging MarketsNov-183%Mainly EmergingMarkets, SomeDeveloped Markets5%2%Only Emerging MarketsNov-19Source: Preqin Investor Interviews, November 2018 - 201914
2. PRIVATE EQUIT Y60%50%50%30%Nov-187%Middle EastSouth AmericaCentral &Eastern EuropeIndiaSource: Preqin Investor Interviews, November 2019Nov-19Source: Preqin Investor Interviews, November 2018 - 201933% 39% 36%49%6%6%4%5%5%Nov-18Nov-1916%Nov-1743% 46% 43% 49% 44%Nov-168%52% 48% 53% 46% 0%30%20%10%0%Nov-126%Proportion of RespondentsFig. 2.16: Investors’ Intentions for Their PrivateEquity Allocations over the Longer Term, 2012 %27%21%20% 17%14%Pooled Fundsof FundsCo-Investments37%35%7%0%Nov-1974%73%Pooled SingleManager FundsProportion of ica13%10%Africa21% 19%20%Source: Preqin Investor Interviews, November 2018 - 2019Fig. 2.15: Private Equity Fund StructuresTargeted by Investors in the Next 12 Months,2018 vs. 201944%40%ChinaProportion of RespondentsSingaporeAustralia & NewZealandSouth KoreaFig. 2.14: Investor Views on Emerging MarketsPresenting the Best Opportunities in PrivateEquitySoutheast 49%50%43%40%28%26%30%21% 11%10%20%8% 8% 5%12%8% 8% 7% 6% 5%10%0%Western Europe(Excl. UK)Proportion of RespondentsFig. 2.13: Investor Views on Developed MarketsPresenting the Best Opportunities in PrivateEquity, 2018 vs. 2019Decrease AllocationIncrease AllocationMaintain AllocationSource: Preqin Investor Interviews, November 2012 - 2019*'Open-Ended' was not included as an option in our November 2018 survey. Preqin Ltd. www.preqin.com15
3. PRIVATE DEBTPrivate Debt:Investors Settlefor LessInvestors are more optimistic than they were at the end of 2018, but performanceexpectations have been lowered amid concerns over pricing pressureExpectations Are ModerateAmong investors we surveyed across all asset classesin November 2019, those in private debt recorded thehighest level of satisfaction with performance. Only11% said they were disappointed with their private debtportfolios (Fig. 3.1). However, only 13% told us theirexpectations had been exceeded, which is down from25% that said the same in 2017, and 18% in 2018. This isno surprise given that average returns from private debtfunds have been among the lowest for private capital in2018 and 2019.The general sense is that 2019 returns will continue in2020. nvestors are more optimistic than they were at theend of 2018, perhaps because returns have improvedsomewhat in the intervening months. However, investorsFig. 3.1: Investor Views on the Performance ofTheir Private Debt Portfolios over the Past 12Months Relative to Expectations, 2017 - 201990%80%18%25%10%0%61%68%7%Nov-17More curiously, half of investors think that dealopportunities are fairly valued, up 10 percentage pointsFig. 3.2: Investor Expectations for thePerformance of Their Private Debt Portfolios inthe Next 12 Months Compared with the Past 12Months, 2017 - 201970%13%70%60%50%40%30%20%Pricing Is an IssueReturn expectations have been tempered by theincreasingly challenging deals marketplace. Deal pricingand competition for opportunities have re-emerged asinvestors’ key concerns going into 2020, cited by 48%and 43% of investors respectively (Fig. 3.3). A similarproportion (49%) believe that pricing at the end of 2019is higher than it was 12 months ago, although this is onpar with views given at the end of 2018 and continues along-term trend (Fig. 3.4).76%16%11%Nov-18Nov-19Exceeded ExpectationsMet ExpectationsFallen Short of ExpectationsSource: Preqin Investor Interviews, November 2017 - 201962%Proportion of RespondentsProportion of Respondents100%are almost equally split as to whether returns will beworse (18%) or better (19%) in 2020 (Fig. ill PerformBetterWill Perform Aboutthe SameNov-17Nov-18Will PerformWorseNov-19Source: Preqin Investor Interviews, November 2017 - 2019 Preqin Ltd. www.preqin.com17
PREQIN INVESTOR OUTLOOK: ALTERNATIVE ASSETS, H1 2020compared with 12 months ago (Fig. 3.6). Meanwhile, theproportion that think deals are overvalued has fallenfrom 55% in 2018 to 48% at the end of 2019.Fig. 3.3: Private Debt Investor Views on the KeyChallenges for Return Generation in 2019 vs.2020Future Plans Are LukewarmIn the longer term, private debt investors areprogressively coming up to meet their target allocations,and intend to hold them there. The proportion ofsurveyed institutions that plan to raise their long-termallocation has fallen year on year from 62% at the end of2016 to 41% at the end of 2019 (Fig. 3.14).50%42%48%34%43%Rising Interest Rates27%Asset ValuationsCompetition for Assets19%27%18%27%12%Deal FlowGeopolitical LandscapeRegulation5%9%10%Exit Environment8% 9%Currency Market VolatilityIn the shorter term, investors are more enthusiastic.The proportion of investors that intend to invest morein the next 12 months than in the past 12 months hadreached a nadir (32%) in our study at the end of 2018(Fig. 3.7). At the end of 2019, though, this had reboundedStock Market Volatility6%7%1% 2%Commodity Market Volatility0% 10% 20% 30% 40% 50% 60%Proportion of Respondents20192020Source: Preqin Investor Interviews, November 2018 - 2019Fig. 3.5: Alternative Assets Investor Views onWhere We Are in the Current Equity MarketCycle40%32% ureNov-19Nov-18Source: Preqin Investor Interviews, November 2018 - tion of RespondentsProportion of Respondents60%RecessionFig. 3.4: Private Debt Investor Views on AssetPricing Compared to 12 Months Ago, 2018 vs.2019Nov-19Source: Preqin Investor Interviews, November 2018 - 2019Fig. 3.6: Private Debt Investor Views on Asset Pricing, 2018 vs. 2019Proportion of 0%15%15%15%2%Undervalued, SomeUndervalued,Considerable Room Room for FurtherPrice Risesfor Further PriceRisesFairly ValuedNov-18Overvalued,Correction Morethan 12 MonthsAwayOvervalued,Correction Likelywithin Next 12MonthsOvervalued,CorrectionImminentNov-19Source: Preqin Investor Interviews, November 2018 - 201918
3. PRIVATE DEBTFig. 3.7: Investors’ Expected Capital Commitmentsto Private Debt in the Next 12 Months Comparedwith the Previous 12 Months, 2015 - 2019Fig. 3.8: Timeframe for Investors’ Next IntendedCommitment to a Private Debt 20%10%0%52%48%13%11%10%Nov-15Nov-16Nov-17Less Capital60%Proportion of RespondentsProportion of -190%Same Amount of Capital59%More Capital14%9%Q1 2020Source: Preqin Investor Interviews, November 2015 - 2019Q2 2020H2 20202021 orLaterSource: Preqin Investor Interviews, November 2019Fig. 3.9: Private Debt Investors’ Intentions for Forming New GP Relationships over the Next 12 Months,2019 vs. 2020*Proportion of %17%11%4%Only New RelationshipsMainly NewRelationships, SomeRe-upsMix of NewRelationships andRe-ups2019Mainly Re-ups, SomeNew RelationshipsOnly Re-ups2020Source: Preqin ProFig. 3.10: Investor Views on Fund Types Presenting the Best Opportunities in Private Debt in the Next 12Months, 2018 vs. 2019Direct Lending40%Special Situations40%36%Distressed Debt22%Mezzanine7%Funds of Funds6%Venture %Proportion of RespondentsNov-18*February 2019 vs. February 2020Nov-19Source: Preqin Investor Interviews, November 2018 - 2019 Preqin Ltd. www.preqin.com19
PREQIN INVESTOR OUTLOOK: ALTERNATIVE ASSETS, H1 2020rise and fall with them in the event of any major marketmovement. But distressed debt funds run countercyclically, and so can stand to make impressive gains inthe event of a downturn. An investor’s attitude is likelyto depend in large part on which side of the market it ismore involved with.to 44%, with a further 39% that intend to invest as muchin 2020 as they did in 2019. But even here, the 17% thatwill reduce their commitments in the months ahead isthe largest proportion that Preqin has seen in five yearsfor the asset class.A Tale of Two OutlooksAs we progress into 2020, a general consensus onthe health and direction of the private debt industry isdifficult to establish. This is perhaps due to the radicallydifferent value propositions it offers. The fortunes ofthe direct lending market are tightly tied to those of thewider private equity and public markets, and so willFig. 3.11: Private Debt Investors’ Intentions for Targeted Markets in the Next 12 Months, 2018 vs. 2019Proportion of %Only DevelopedMarketsMainly DevelopedMarkets, SomeEmerging MarketsMix of Developed andEmerging MarketsNov-182%Mainly EmergingMarkets, SomeDeveloped Markets7%5%Only Emerging MarketsNov-19Source: Preqin Investor Interviews, November 2018 - 2019Fig. 3.12: Inve
Across each alternative asset class, a minimum of 77% of investors are planning to maintain or increase their capital commitments in the next 12 months. And looking ahead to the longer term, at least 81% will maintain or raise their allocations. Although global markets could well be at an inflection point, and uncomfortably high asset pricing is a