Transcription
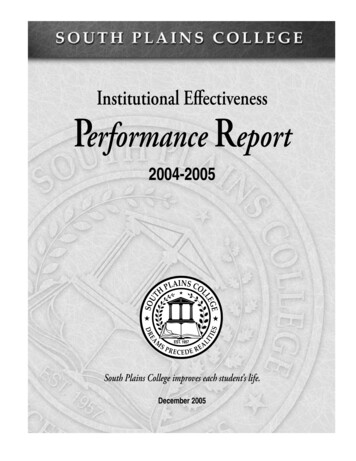
2004-2005 Performance ReportSouth Plains College – 1Institutional EffectivenessPerformance ReportNPLAI S COLHSPEST. 1957LIEAMTIDRESGELESOUT2004-2005RECEDE REASouth Plains College improves each student’s life.December 2005
2004-2005 Performance ReportSouth Plains College – 2Institutional EffectivenessPerformanceReportSPEST. 1957LIEAMTIDRESHNPLAI S COLGELESOUT2004-2005RECEDE REASouth Plains Collegeimproves each student’s life.DECEMBER 2005
2004-2005 Performance ReportSouth Plains College – 3Index of MeasuresCSF A: Dynamic Educational Programs and Quality InstructionA-1: Curriculum Review and Planning . 8A-2: Accreditation . 8A-3: Articulation Agreements. 8A-4: Student Satisfaction with Instruction. 9A-5: Employer Satisfaction with Graduates . 10A-6: Faculty Qualifications .11CSF B: Student OutcomesB-1:B-2:B-3:B-4:B-5:B-6:B-7:Course Completion . 12Graduation Rates . 12Academic Transfer and Performance . 15Success in Developmental Education . 17Technical Program Placement Rates . 19Personal Growth and Goal Attainment. 21Licensure Passage . 21CSF C: Quality Student and Support ServicesC-1:C-2:C-3:C-4:Access and Equity . 22Assessment of Programs and Services . 26Retention . 28Course and Degree Advisement . 30CSF D: Economic Development and Community InvolvementD-1: Education in Support of Economic Development . 31D-2: Interaction with the Community . 32D-3: Partnerships and Alliances . 34CSF E: Effective Leadership and ManagementE-1:E-2:E-3:E-4:Cooperative Planning and Goal Attainment . 35Management of Resources . 36Acquisition of Public/Private Resources . 39Facility Development . 41CSF F: Collaborative Organizational ClimateF-1: Ongoing Professional Development . 42F-2: Employee Diversity . 43F-3: Employee Satisfaction . 45
2004-2005 Performance ReportSouth Plains College – 4IntroductionSouth Plains College has made a significant commitment to accountability and quality with the adoption of a comprehensive institutional effectiveness program. This planning and assessment process isbased on successful accomplishments of the college’s vision and mission within the context of an institutional plan and as measured by student outcomes.To ensure effectiveness, South Plains College has embraced a process of continuous organizational improvement designed to improve the way the work of the institution is done and to accomplish the goalsand objectives of the institution. The college has established a three-year strategic planning cycle thatsets institutional goals based on a review of the college’s vision, mission, role and scope, and commitment statements. Each goal is reached through a set of priority objectives. These goals and objectivesformulate the college’s Institutional Plan and provide the framework for the development of operationalobjectives on departmental and program levels.A companion assessment process measures the extent to which institutional goals and objectives areaccomplished. The college has identified these measures as critical success factors and indicators of effectiveness which map the college’s performance against high standards. The college uses this processto monitor its plan and make necessary adjustments in programs and services.A yearly update of the institutional effectiveness program is presented to the South Plains CollegeBoard of Regents. The document used to convey these annual results is the Institutional EffectivenessPerformance Report. The 2004-05 Performance Report presents assessment results recorded for Year 4 of the2001-2005 Institutional Plan.For additional information about the institutional effectiveness program at South Plains College or toaddress questions, contact the Office of Institutional Advancement, South Plains College, 1401 S. College Ave., Levelland, Texas 79336. Telephone: (806) 894-9611, ext. 2217, 2218.
nalDevelopmentCooperativePlanning &Goal AttainmentCSF-EEFFECTIVELEADERSHIP& MANAGEMENTCSF-FEducationin Supportof EconomicDevelopmentAccess &EquityCourseCompletionCurriculumReview &Planning1CSF-DECONOMICDEVELOPMENT& COMMUNITYINVOLVEMENTCSF-CQUALITYSTUDENT& CATIONALPROGRAMS& versityManagementof ResourcesInteractionwith theCommunityAssessmentof Programs& factionAcquisition ofPublic/PrivateResourcesPartnerships& AlliancesRetentionAcademicTransfer mentCourseand DegreeAdvisementSuccess inDevelopmentalEducationStudentSatisfactionof Satisfactionof Graduates5Personal Growthand GoalAttainmentFacultyQualifications6MEASURES OF INSTITUTIONAL EFFECTIVENESSSYSTEM OF OUTCOME ASSESSMENTLicensurePassage72004-2005 Performance ReportSouth Plains College – 5
2004-2005 Performance ReportSouth Plains College – 6Critical Success Factors and Measuresof Institutional EffectivenessInstitutional effectiveness is at the heart of what an institution does. South Plains College believes that its institutional effectiveness process will improve teaching and learning and contribute to the attainment of the college’svision and validation of its mission.South Plains College measures its performance through an outcome-based assessment process. The college hasidentified six factors that are critical to its success as an institution of higher learning. Through these Critical Success Factors, SPC maintains a comprehensive evaluation system that measures the extent to which institutionalgoals and objectives are accomplished. These Critical Success Factors include the following.Dynamic Educational Programs and Quality InstructionStudent OutcomesQuality Student and Support ServicesEconomic Development and Community InvolvementEffective Leadership and ManagementCollaborative Organizational ClimateTo monitor progress and achievement in each of these areas, the college has identified 27 measures of institutionaleffectiveness. Benchmarks (standards) have been developed for each of these measures. The results of performance are compared against these benchmarks and indicate how well the college has achieved its stated goalsand objectives. The achievement of the identified Critical Success Factors is positive proof of the college’s effectiveness. This system of outcome assessment against critical success factors is illustrated in the table found on thepreceding page.The indicators and benchmarks and their supporting measurement criteria are the observed, quantified or qualified results of performance. The collected data provide valuable information for those making decisions about thefuture direction of the college. The following section contains the identified benchmarks for evaluation and thereview of data which describes the college’s performance in each critical success area. Interpretation of the findings is provided for each benchmark and if the standard was not met, an action plan for the next year (2004-05)has been developed.Definition of Critical Success FactorsCSF A: DYNAMIC EDUCATIONAL PROGRAMS AND QUALITY INSTRUCTIONThe primary mission of South Plains College is to provide quality educational programs that prepare studentsfor transfer to a university or to enter the workplace. Faculty design curricula to develop students’ competencies,skills and general knowledge in order to be successful in a rapidly changing world. The quality of instructionreceived by the student in these programs is an essential contributor to student success. At the same time, thesecurricula address the needs and expectations of transfer institutions, employers in business and industry, and accrediting bodies.CSF B: STUDENT OUTCOMESThe success of South Plains College is measured by the success of students as they attain their goals. These goalsmay include remaining in college and graduating in a field of study, attaining specific job skills, successfullytransferring to a university, obtaining employment in the workplace, obtaining licensure in certain professions,and performing well in their chosen careers.
2004-2005 Performance ReportSouth Plains College – 7CSF C: QUALITY STUDENT AND SUPPORT SERVICESSouth Plains College provides opportunities for widely diverse populations to access its educational programsand services. To successfully respond to these constituencies, the college continually assesses the needs and satisfaction levels of its students, alumni and employers. This information is used to provide appropriate programs,services, facilities, technology and resources to assist students in achieving their goals.CSF D: ECONOMIC DEVELOPMENT & COMMUNITY INVOLVEMENTThe college supports economic and workforce development by providing educational programs that facilitatethe training of entry-level workers and the retraining of current workers, based on local business and industrydemands. South Plains College faculty, staff and students are actively involved in the community and its development. At the same time, the community is actively involved in the events, activities and programs of the college.CSF E: EFFECTIVE LEADERSHIP & MANAGEMENTTo be effective, the college must be accountable to the citizens and students who provide resources. This accountability includes demonstrating effective leadership, cooperative planning, resource management, acquisition ofresources and the development of facilities and technology in order to accomplish college goals. Additionally, theculture of an organization powerfully influences the performance of its members, the use of available resourcesand the quality of its programs and services. South Plains College seeks to nurture an organizational climate thatis characterized by a shared vision, unity of purpose, common organizational values and collaboration. Decisionmaking and resource allocation reflect these values and are influenced by broad input from college employees.CSF F: COLLABORATIVE ORGANIZATIONAL CLIMATEThe culture of an organization powerfully influences the performance of its members, the use of resources, andthe quality of its programs and services. South Plains College seeks to promote a collaborative institutionalclimate through a shared institutional vision and common organizational values. Decision-making and resourceallocation reflect these values and are influenced by broad input from college employees.
2004-2005 Performance ReportSouth Plains College – 8CSF A: Dynamic Educational Programsand Quality InstructionMeasurement A-1: Curriculum Review and PlanningBENCHMARK AND RESULTSA-1.1 The number of curriculum changes each year will be within the normal limits of variationfrom year to year or the reasons for the extra variation will be known.NUMBER OF CURRICULUM CHANGESANNUAL REPORT TO THE riculum Changes390138391118150172Upper Control Limit438438438438438438SOURCE: Office of Academic AffairsInterpretation:South Plains College provides an up-to-date curriculum to meet the needs of students and service area constituents. Changes to the curriculum are made regularly. In recent years, the number of curriculum changes has fluctuated as changes in the Workforce Education Course Manualguidelines have been made and as consolidation of some technical programs have taken place.However, the annual number of changes is still below the upper control limit. The standard ismet.Measurement A-2: AccreditationBENCHMARK AND RESULTSA-2.1 Individual educational programs subject to accreditation by external review bodies shallachieve reaccreditation status with a minimum of recommendations.Report:There were no educational programs that underwent external review for reaccreditation duringthe 2004-05 academic year.Measurement A-3: Articulation AgreementsBENCHMARK AND RESULTSA-3.1 South Plains College will maintain articulation agreements with 100% of all accredited senior institutions in the college’s service area.Interpretation:South Plains College maintains active articulation agreements with the following accreditedsenior institutions: Texas Tech University, Lubbock Christian University and Wayland BaptistUniversity. Additionally, articulation agreements are maintained with the following seniorinstitutions located outside the college’s service area: West Texas A&M University, Eastern NewMexico University, Midwestern University, Sul Ross State University and Angelo State University. The standard is met.
2004-2005 Performance ReportSouth Plains College – 9BENCHMARK AND RESULTSA.3-2 South Plains College will increase articulation agreements with accredited IndependentSchool Districts in the college’s service area by 5% each year until 100% saturation is reached.NUMBER OF ARTICULATION AGREEMENTS WITH SERVICE AREA ISDSData Elements2002-032003-042004-05Total Service Area ISDs504949Tech Prep Agreements504949Dual Credit Agreements444448100%100%100%Percent InvolvementSOURCE: Office of Academic AffairsInterpretation:The college maintains some form of articulation agreement with 100% of the public schooldistricts in the college’s service area. In some districts, multiple agreements are maintained.An active partnership with the Region 17 Education Service Center ITV network has allowedthe college to expand dual credit articulation efforts and deliver additional courses beyond itsservice area. The standard is met.Measurement A-4: Student Satisfaction with InstructionBENCHMARK AND RESULTSA-4.1 Students participating in the annual faculty evaluation survey will rate their level of satisfaction with courses and instruction above average (greater than 3.0 on 5.0 scale) in all categories.STUDENT EVALUATION OF INSTRUCTIONANNUAL REPORT TO THE BOARDOverall Rating of 4.604.604.804.80SOURCE: Office of Academic AffairsInterpretation:The quality of instruction at SPC is rated annually by students through the faculty evaluationprocess. SPC students continue to rate their overall level of satisfaction with instruction veryhigh. The measure has exceeded the benchmark by 1.5 points throughout the reporting yearsFor the past two years, the overall rating has approached excellent on the scale (5.0) with itshighest mark of 4.8, indicating consistent instructional quality. The standard is met.
2004-2005 Performance ReportSouth Plains College – 10BENCHMARK AND RESULTSA-4.2 Graduates of South Plains College will rate their level of satisfaction with instruction aboveaverage (greater than 3.0 on 5.0 scale) in all survey categories.Interpretation:Data for this measure has not been collected since the 2000 Cohort Year, therefore no new datais being reported. With the discontinuance in 1998 of TexSIS, a state-wide graduate follow-upservice, administration of a graduate follow-up process and system at SPC has been limited. Development of a graduate follow-up survey instrument and reporting process has been identifiedas a priority initiative for the 2005-2008 Institutional Plan.Action Plan:The Instructional Council will develop a new graduate follow-up system in Year 1 of the 20052008 plan cycle, pilot the system in Year 2, and operationalize the system in Year 3.BENCHMARK AND RESULTSA-4.3 Technical graduates of South Plains College will rate their level of satisfaction of programtraining in relation to job above average (greater than 3.0 on 5.0 scale) in all survey categories.Interpretation:Data for this measure has not been collected since the 2000 Cohort Year, therefore no new datais being reported. With the discontinuance in 1998 of TexSIS, a state-wide graduate follow-upservice, administration of a graduate follow-up process and system at SPC has been limited. Development of a graduate follow-up survey instrument and reporting process has been identifiedas a priority initiative for the 2005-2008 Institutional Plan. Recent technical program accreditation visits have emphasized the need to reinstate a graduate follow-up process.Action Plan:The Instructional Council will develop a new graduate follow-up system in Year 1 of the 20052008 plan cycle, pilot the system in Year 2, and operationalize the system in Year 3.Measurement A-5: Employer Satisfaction with GraduatesBENCHMARK AND RESULTSA-5.1 Employers of SPC graduates will rate their satisfaction of technical training received in relation to job requirements above average (greater than 3.0 on 5.0 scale) in all survey categories.Interpretation:Data for this measure has not been collected since the 2000 Cohort Year, therefore no new datais being reported. With the discontinuance in 1998 of TexSIS, a state-wide graduate follow-upservice, administration of a graduate follow-up process and system at SPC has been limited. Development of a graduate follow-up survey instrument and reporting process has been identifiedas a priority initiative for the 2005-2008 Institutional Plan. Recent technical program accreditation visits have emphasized the need to reinstate a graduate follow-up process.Action Plan:The Instructional Council will develop a new graduate follow-up system in Year 1 of the 20052008 plan cycle, pilot the system in Year 2, and operationalize the system in Year 3.
2004-2005 Performance ReportSouth Plains College – 11Measurement A-6: Faculty QualificationsBENCHMARK AND RESULTSA-6.1 The college will employ full-time faculty members whose degrees are presented by regionally accredited institutions, whose educational credentials meet or exceed the SACS standards,or whose qualifications meet the standards for exceptions described in the SACS Criteria.PERCENTAGE OF FACULTY MEETING SACS QUALIFICATIONS CRITERIAData Elements2002-032003-042004-05Total Academic Faculty140145150No. Meeting SACS Criteria140145150100%100%100%Total Technical Faculty109114114No. Meeting SACS Criteria109114114100%100%100%% Compliance% ComplianceSOURCE: Office of Academic AffairsInterpretation:South Plains College seeks to employ full-time faculty members who meet the educationalcredentials required by SACS. Faculty who do not meet the criteria are required to demonstrateprogress toward meeting the requirements as a condition of employment. For 2003-2004, all fulltime academic faculty members and technical faculty members met the credential requirementsor had sufficient justifications on file to meet the SACS criteria. The standard is met.BENCHMARK AND RESULTSA-6.2 The percentage of contact hours taught by full-time faculty employed at the college will exceed the state average for public community colleges.PERCENTAGE OF SECTIONS TAUGHT BY FULL-TIME FACULTYData Elements2002-032003-042004-05SPC Full-Time Faculty89.0%90.0%92.4%State Average Full-Time Faculty66.0%66.0%66.0%SOURCE: LBB Performance Measures, THECBInterpretation:The percentage of course sections taught by full-time faculty members is a performance measureused by the Legislative Budget Board and the Texas Higher Education Coordinating Board. TheTHECB measures the total number of contact hours taught by full-time faculty. This measurewas instituted for 1998-99. There are no statewide data for comparison purposes. The TexasCommunity College Teachers Association surveys the percentage of course sections taught byfull-time faculty and this number has been used as a point of comparison for this report. Thepercentage of courses taught by full-time faculty at SPC greatly exceeds the statewide percentage reported by TCCTA. The standard is met.
2004-2005 Performance ReportSouth Plains College – 12CSF B: Student OutcomesMeasurement B-1: Course CompletionBENCHMARK AND RESULTSB-1.1South Plains College will maintain a course completion rate of not more than 5% below thestate average.PERCENTAGE OF COURSE COMPLETERSData ElementsFall 2001Fall 2002Fall 2003Fall 2004SPC Course Completers85.0%85.3%85.7%86.0%State Average81.4%83.9%84.0%83.8%SOURCE: LBB Performance Measures, THECBInterpretation:The state performance measures for two-year institutions includes the percentage of studentswho complete a course. Grades of A, B, C, D & F count as course completion. South PlainsCollege’s course completion rate exceeded the state average for all years reported. The standardis met.Measurement B-2: Graduation RatesBENCHMARK AND RESULTSB-2.1At least 35% of all full-time technical students not receiving remediation will complete adegree or certificate or transfer within three years.GRADUATION/TRANSFER RATE FOR FULL-TIME STUDENTSData Elements1998 Cohort1999 Cohort2000 Cohort483636651217 in 2001285 in 2002310 in 2003Percent of the Cohort45%45%48%State Perkins Benchmark36%35%35%Cohort of Full-Time FTIC StudentsNo. of SPC Students who Graduated or TransferredSOURCE: Perkins Measure, THECBInterpretation:This Perkins measure examines the graduation rate of full-time, first-time-in-college technicalstudents who are not subject to remediation. Data for this measure are collected and reported bythe THECB. The college’s graduation/transfer rate for the 1998 and 1999 cohorts who graduatedor transferred three years after entering SPC is 45%. For the most recent 2000 cohort, the rate is48%. The measures exceed the Perkins benchmark for all years reported. The standard is met.
2004-2005 Performance ReportSouth Plains College – 13BENCHMARK AND RESULTSB-2.2At least 15% of all part-time technical students not receiving remediation will complete adegree or certificate or transfer within five years.GRADUATION/TRANSFER RATE FOR PART-TIME STUDENTSData Elements1996 Cohort1997 Cohort1998 Cohort484754807172 in 2001345 in 2002517 in 2003Percent of the Cohort36%46%64%State Perkins Benchmark15%15%15%Cohort of Part-Time FTIC StudentsNo. of SPC Students who Graduated or TransferredSOURCE: Perkins Measure, THECBInterpretation:This Perkins measure examines the five-year graduation/transfer rate of part-time, first-timein-college technical students. Data for this measure is collected and reported by the THECB. Thecollege’s graduation/transfer rate for part-time students was 36% for the 1996 cohort, 46% infor the 1997 cohort and 64% for the 1998 cohort. The reported measures are well above the 15%benchmark. The standard is met.BENCHMARK AND RESULTSB-2.3At least 35% of all full-time technical students receiving remediation will complete a degreeor certificate or transfer within four years.GRADUATION/TRANSFER RATE FOR FULL-TIME STUDENTS RECEIVING REMEDIATIONData Elements1998 Cohort1999 Cohort2000 Cohort681505NA210 in 2002152 in 2003NAPercent of the Cohort31%30%NAState Perkins Benchmark36%35%NACohort of Full-Time FTIC StudentsNo. of SPC Students who Graduated or TransferredSOURCE: Perkins Measure, THECBInterpretation:This Perkins measure examines the graduation/transfer rate of full-time, first-time-in-collegetechnical students who are subject to remediation. Data for this measure are collected and reported by THECB. The college’s graduation/transfer rate for the 1998 cohort who graduated ortransferred within four years after entering SPC is 31%. For the 1999 cohort, the rate is 30%. Datafor the 2000 Cohort had not been reported by the THECB at the time this report was compiled.For the two reported cohorts, the SPC rate is five percentage points below the Perkins benchmark. The standard is not met.Action Plan:The College will continue to monitor the graduation/transfer rate for students receiving remediation. An effort is underway by the Office of Enrollment Management and the Retention Teamto revise the college’s student advisement system, establish a student early alert system for atrisk students, and to engage all SPC employees in retention strategies.
2004-2005 Performance ReportSouth Plains College – 14BENCHMARK AND RESULTSB-2.4At least 15% of all part-time technical students receiving remediation will complete a degreeor certificate or transfer within seven years.GRADUATION/TRANSFER RATE FOR PART-TIME STUDENTS RECEIVING REMEDIATIONData Elements1995 Cohort1996 Cohort1998 Cohort88124NA27 in 200235 in 2003NAPercent of the Cohort31%28%NAState Perkins Benchmark15%15%15%Cohort of Part-Time FTIC StudentsNo. of SPC Students who Graduated or TransferredSOURCE: Perkins Measure, THECBInterpretation:This Perkins measure examines the completion rate of part-time, first-time-in-college technicalstudents who are subject to remediation. The measure reports the number of students who complete a degree or certificate or transfer within seven years of entering SPC. Data for this measureare collected and reported by the THECB. The college’s graduation/transfer rate for part-timestudents was 31% for the 1995 cohort and 28% for the 1996 cohort. Data for the 1998 cohort hadnot been reported at the time this report was prepared. The reported measures are above the15% benchmark. The standard is met.BENCHMARK AND RESULTSB-2.5The total number of degrees awarded by the college in a given year shall compare favorablywith peer institutions such that the college’s regional ranking on this measure shall not bemore than two positions less than its regional ranking for enrollment.NUMBER OF DEGREES AND CERTIFICATES AWARDEDData 12510775Tech Prep AAS Degrees/Certificates106137199267Technical Certificates217183279217Total Degrees and Certificates610711830809SPC Regional Ranking -- Degrees3rd3rd3rd3rdSPC Regional Ranking -- Enrollment3rd3rd3rd3rd0000AA, AS DegreesAAS DegreesRanking DifferenceSOURCE: LBB Performance Measures, THECBInterpretation:The THECB performance measures include the total number of degrees and certificates earnedat an institution annually. SPC awarded 809 degrees and certificates in 2003-04, a 1.2% decreasefrom the previous year. The college ranked third among peer institutions in its region. Allinstitutions which awarded more degrees than SPC had larger enrollments. The standard is
2004-2005 Performance ReportSouth Plains College – 15met. Receipt of a Title V HSI Strengthening Institutions Grant will also fund expanded retentionand completion activities that are expected to encourage more students to complete degree andcertificate requirements. The Pathway Partnership with Texas Tech University is also expectedto result in an increase in degrees and certificates awarded in subsequent years.BENCHMARK AND RESULTSB-2.6The percentage of first-time in college (FTIC) students persisting to graduation or transferwill not fall below 5% of the statewide average for peer institutions.GRADUATION/TRANSFER RATE FOR FTIC STUDENTSData Elements1999 Cohort2000 Cohort2001 Cohort2,2112,345NA792873NAPercent of Cohorts Reported35.8%37.2%NAStatewide Average of Peer Institutions28.9%29.0%NANumber of FTIC StudentsNo. of SPC Students who Graduated or TransferredSOURCE: Annual Data Profile, THECBInterpretation:For the most recent cohort that was tracked, 37.2% persisted to graduation or transferred threeyears later. This rate exceeded the statewide rate of 29.0%. For the previous reported cohort,South Plains College’s measure also exceeded the state average for peer institutions. The graduation/transfer rate has also increased during the reported periods. Data for the 2001 cohort wasnot available from the THECB at the time this report was compiled. The standard is met.Measurement B-3: Academic Transfer and PerformanceBENCHMARK AND RESULTSB-3.1The transfer rate for academic students will not be more than 5% below the statewide average for peer institutions.TRANSFER RATES FOR ACADEMIC STUDENTSREPORTED FROM DATABASE SEARCHData Elements1998-991999-002000-012001-022002-03SPC Percentage Rate45.5%44.1%44.3%49.4%NARegional Percentage Rate37.0%34.1%39.9%40.4%NAState Percentage Rate33.2%36.6%45.8%39.6%NASOURCE: Automated Student and Adult Learner Follow-up System, THECBInterpretation:The THECB performs a database search yearly for all academic students who had previouslyenrolled at SPC in a given year. The student records (Social Security Numbers) are comparedto the datab
2004-2005 Performance Report South Plains College - 1 Institutional Effectiveness Performance Report 2004-2005 South Plains College improves each student's life. December 2005 S O U T H P L A I N S C O L L E G E D R E A M S P RECE D E R E L I T I E S EST. 1957.