Transcription
Advancing the Enterpriseto Unlock ValueEva BorattoExecutive Vice President &Chief Financial Officer
Cautionary statement regardingforward-looking statementsThe Private Securities Litigation Reform Act of 1995 provides a safe harbor for forward-looking statementsmade by or on behalf of CVS Health Corporation. By their nature, all forward-looking statements involverisks and uncertainties. Actual results may differ materially from those contemplated by the forward-lookingstatements for a number of reasons as described in our Securities and Exchange Commission filings,including those set forth in the Risk Factors section and under the section entitled “Cautionary StatementConcerning Forward-Looking Statements” in our most recently filed Annual Report on Form 10-K andQuarterly Report on Form 10-Q.The presentations at our 2019 Investor Day include non-GAAP financial measures that we use to describeour company’s performance. In accordance with SEC regulations, you can find the definitions of thesenon-GAAP measures, as well as reconciliations to most comparable GAAP measures, on the InvestorRelations portion of our website.Link to our non-GAAP reconciliations.2
Continued focus on enhancinglong-term shareholder ant cashflow from lelong-termgrowth3Steps of value creationto drive long-term growth
Agenda2019 guidance reviewValue creation through integration synergies,modernization & transformationFinancial outlook & capital allocation strategy4
Enterprise Outlook: 2019 full year1Reaffirming all elements of 2019 guidance( in billions, except per share data) 251.2 to 254.4Consolidated RevenuesAdjusted Operating Income3 15.0 to 15.2 4.90 to 5.05GAAP Diluted EPS3 6.75 to 6.90Adjusted EPSCash Available to Repay Debt53 4.2 to 4.6
Agenda2019 guidance reviewValue creation through integration synergies,modernization & transformationFinancial outlook & capital allocation strategy6
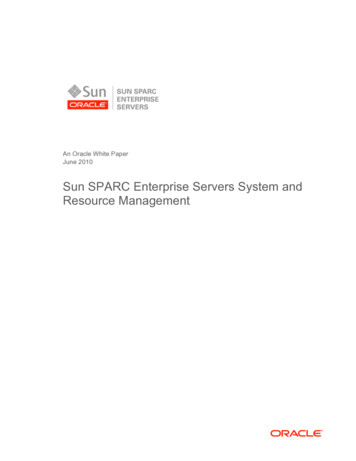
1 . I N T E G R AT I O N S Y N E R G I E S1Executing on integration synergies to reach 900M run rate 900MBusiness integration 800M Plan design Specialty / Coram /PBM Operations / OtherGeneral &administrative functions Vendor contracting Streamline corporatefunctions 300- 350MMedical cost savings Improve adherence and closegaps in care for patients withchronic diseases Optimize existing programsin readmission prevention Site of care managementBusinessintegration72020P2019PGeneral &administrativefunctionsMedicalcost savingsRun Rate2021P
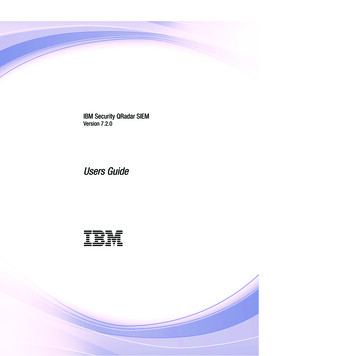
2 . E N T E R P R I S E M O D E R N I Z AT I O NGenerating net savings with enterprise modernizationAreas of net savings1 1.5B- 2.0B Productivity improvements Optimize call centers Vendor management Business initiatives1 900M- 1.1B 400M- 600M Technology modernization Rationalization Centers of excellence1Projected costs to achieve Operating expenses1 200M- 300M annuallythrough 20222020P2021PRun Rate2022PModernization net savings are incremental to previously disclosed cost reduction programs8
3 . T R A N S F O R M AT I O NDriving long-term value through transformationMedical costsavingsMembershipgrowthExpanded use ofCVS assetsIncreased customersatisfaction andretentionOpen platformand newbusinessesCommercial insuredPlan sponsorsPharmacyMedicare AdvantageMedicare AdvantagemembersMinuteClinic Improving theconsumer experiencePayor agnosticsolutionsFront of storeData andanalytics productsCoramNew businessesMedicare Advantagequality improvementProjected to drive 850M of incremental operating income in 2022, growing to 2.5B long term19
Substantial long-term valuecreation through strategicinitiatives & consumer-centricproducts 1.5B 2.0B 900MProjected to drive a run rate of 3.5Bin operating income in 20221101. Integrationsynergies 850M2. Enterprisemodernization3. Transformation
Agenda2019 guidance reviewValue creation through integration synergies,modernization & transformationFinancial outlook & capital allocation strategy11
Balancingnear-termexecutionwith longterm d expensereductioninitiativesFocus onintegrationprocess andexceed synergyexpectationsRefine androll out newfront doors tohealth careOptimizeenterpriseportfolio andevaluate assetbaseEnhanceshareholderreturns throughdisciplinedcapital allocation12
Well positioned for long-term growth2022 2021Projected AdjustedEPS growth1,3,6 (%)1320202019 6.75to 6.90Low singledigitsLow doubledigits5Mid singledigits2020P Key Elements1 7.00 Adjusted EPS3,6Revenue up low single digits %Tax rate 28.5%
Health Care Benefits – 2020 year-over-year driversTotal Revenues1Adjusted Operating Income1,3,4Divestiture of Aetna PDPCompetitive environmentHealth insurance fee reinstatementDivestiture of Aetna PDP and stranded costsOutpace industry growth in gov’t servicesHealth insurance fee reinstatement2Outpace industry growth in gov’t servicesSynergies / enterprise modernizationTransformation2020P up mid single digits %142020P up high single digits %
Retail / LTC – 2020 year-over-year driversTotal Revenues1Adjusted Operating Income1,3Front store continued shift to digitalFront store marginFront store formats & personalizationGenericsOmnicareOmnicareOutpace industry growth in RxReimbursement pressureRx growthSynergies / enterprise modernization2020P up low-to-mid single digits %152020P up low single digits %
Pharmacy Services – 2020 year-over-year driversTotal Revenues1Adjusted Operating Income1,3AnthemAnthemNet new business / Centene migrationNet new business / Centene migrationSpecialtyPricing pressurePurchasing economicsRebate guaranteesSpecialtySynergies / enterprise modernization2020P down low-to-mid single digits %162020P down mid single digits %
Investing in capabilities to drive sustainable long-term value 2.3B to 2.6BAnnual projected capital expenditures1Key areas of capital spendingHistoricalProjectedRemodelsInnovative HealthHUB sNew storesTransformative productsand modernizationTechnologyInitiativesNew storesData analyticsConsumer experiences17
Strong cash flow generation and effective capital deploymentPlan to reduce debt significantly to reach leverage ratio target of low 3x’sLeverage Ratio1,3,7 4.7xat transaction close3Focused on debt reduction in the near term Committed to returning to low 3x’s leverage ratio targetMid 3x Significant cash flow from operations supports debt repayment2021P1,3,7Low 3x2022P 1,3,7Expect to pay down 7.5B of debt fromclose of Aetna transaction to the end of 2019 Aggregate 5.1B of cumulative debt repaid to dateIncreased opportunity to enhance shareholdervalue once leverage ratio target achieved18
Thoughtful capital allocation strategy to drivelong-term value creationNear term (2020P-2021P)1DebtPaydown 45%AdditionalRetainedCapital Needsof InsuranceSubsidiaries 10% 25% 20%Net CapitalExpenditures19CapitalDeployment toShareholders –Dividends OnlyExpect 10B - 12B1,8 cash available annually forenhancing shareholder value in the long term (2022 )
Long-term assumptions – 2022 and beyond1Health Care BenefitsRetail / LTCPharmacy ServicesOtherCommercial retentionGenericsClaims growthCapital deploymentCompetitiveenvironmentHealthHUB /services growthGenericsImpact of digitalMembership growthImprovementin LTCIntroduction ofbiosimilarsInterest expenseReimbursementpressurePricing pressureTransformation / openplatformRx growthSpecialty growthProject adjusted EPS1,3 growth in low double digits % on average20
Scorecard to evaluate successTarget1 6.75 - 6.902019 7.00 (Low single digits%)2020Mid single digits %2021Low double digits %2022 300M - 350M2019 800M2020 900M2021 1.5B - 2BRun Rate 2022 850M2022 2.5BLong-termLeverage ratio3,7Low 3x’s2022Cash available for enhancing shareholder value8 10B - 12BAnnually Long-termInventory reduction 1.5B2022Adjusted EPS Growth3Integration synergiesEnterprise modernizationTransformation21Timing
K E Y TA K E AW AY SSteps to unlocking significantvalue well underwayStrong progress executing our plan to grow anddifferentiate our businessesSignificant upside to synergy targetsPositioned for long-term enterprise growthThoughtful allocation and prioritization of capital22
Endnotes1. Currently enacted laws and regulations were used in all the Company’s projections.2. After income taxes, the Health Insurer Fee is projected to be a headwind for the Health Care Benefits segment.3. This financial measure is a non-GAAP financial measure. For an explanation of this financial measure and a reconciliation to the mostdirectly comparable GAAP measure, refer to our Investor Relations website at https://www.investors.cvshealth.com.4. Health Care Benefits segment projections do not include an estimate of prior years’ development.5. 2022 includes modest share repurchases.6. Projected Adjusted EPS after 2019 excludes from GAAP diluted EPS the impact of amortization of intangible assets and other items, ifany, that neither relate to the ordinary course of the Company’s business nor reflect the Company’s underlying business performance,the corresponding tax benefit or expense related to the items excluded from adjusted net income attributable to CVS Health and thecorresponding impact to income allocable to participating securities, net of tax, related to the items excluded from net incomeattributable to CVS Health in determining adjusted net income attributable to CVS Health. The Company is not able to project theamount of any such other items during periods after 2019 at this time and therefore cannot reconcile projected Adjusted EPS after2019 to projected GAAP diluted EPS. The Company is unable at this time to accurately quantify the significance of any item ofunavailable information.23
Endnotes7.8.24The Company defines its leverage ratio as Adjusted Debt divided by adjusted earnings before interest, tax, depreciation andamortization (Adjusted EBITDA). Adjusted Debt is defined as short-term debt and total long-term debt (including the current portionof long-term debt), plus the present value of future operating lease payments at a discount rate of 8.5% assuming lease paymentsoccur at the end of the year. Adjusted EBITDA is defined as (i) net income before income taxes, depreciation and amortization, plus(ii) implied interest expense on future operating lease payments at a discount rate of 8.5% assuming lease payments occur at theend of the year, less (iii) other items, if any, that neither relate to the ordinary course of the Company’s business nor reflect theCompany’s underlying business performance, such as goodwill impairments, interest income on financings associated withproposed acquisitions (for periods prior to the acquisition) and any other items specifically identified herein. The Company is not ableto project the Adjusted EBITDA amount during 2021 or 2022 and beyond at this time and therefore cannot reconcile projectedadjusted EBITDA to projected GAAP net income. The Company is unable at this time to accurately quantify the significance of anyitem of unavailable information.Cash available for enhancing shareholder value annually in the long term is inclusive of current shareholder dividends.
Reaffirming all elements of 2019 guidance Enterprise Outlook: 2019 full year1 5 ( in billions, except per share data) Consolidated Revenues 251.2 to 254.4 Adjusted Operating Income3 15.0 to 15.2 GAAP Diluted EPS 4.90 to 5.05 Adjusted EPS 3 6.75 to 6.90 Cash Available to Repay Debt3 4.2 to 4.6 Agenda 6 2019 guidance review