Transcription
Chapter 9: Confirmatory Factor AnalysisPrerequisites: Chapter 5, Sections 3.9, 3.10, 4.39.1 The Confirmatory Factor Analysis ModelThe difference between the models discussed in this section, and the regression model introducedin Chapter 5 is in the nature of the independent variables, and the fact that we have multipledependent variables. The independent variables are unobserved constructs, also known as factors,dimensions or latent variables. At this point the student might ask, how scientific is it to speak ofunobserved variables in a model? We will soon see that if the model of unobserved independentvariables is correct, it makes a strong prediction about the structure of the covariances among theobserved dependent variables. For this reason, these models are a special case of models knownas covariance structure models.Given that we are dealing with unobserved variables, it will be useful to shift our notationsomewhat. In regression, we look at a particular variable as a column vector that displays theindividual observations which comprise the rows. In factor analysis, the individual observationscannot be fully observed since the right hand side variables, the factors, are not observed. Instead,we will propagate our model using a typical observation, call it observation i, but leaving off thesubscript i. What’s more, instead of arranging our matrices such that the each column is adifferent variable and each row is a different observation, we will be looking at the transpose.Of course, this is in contrast to the notation employed in Chapters 5 through 8. In that laterchapter, we study the modelY XB εwhere the columns of Y (and the parameter vector B as well as the error matrix ε) represent the pdifferent dependent variables. If we were to take the transpose of both sides of that model wewould haveY′ B′X′ ε′.You will note that, since the product of a transpose is the transpose of the product in reverse order[Equation (1.34)], B and X are now reversed. Also, the data matrices Y′ and X′ now have a rowfor each variable, instead of a column as before. Next, as described above, rather than look atevery subject, we look at a typical observation, for example, number i:εy i B ′x i i .εThe dot, which is a subscript reduction operator, is mentioned in Section 1.1. One final change isconvenient. If we totally drop the subscripts from y i , x i and i , we would just havey B′x ε.This is how we will describe the model in this chapter. We will call the regression weights λ'sinstead of β's and the independent variables will be η's instead of x's.We start out with a scalar representation of the situation:110Chapter 9
y 1 λ 11 η1 λ 12 η 2 L λ 1m η m ε 1y 2 λ 21 η1 λ 22 η 2 L λ 2 m η m ε 2L Ly p λ p1 η1 λ p 2 η 2 L λ pm η m ε p .(9.1)The left hand side shows p different variables. Perhaps y1 through y3 represent three measures ofconsumer “greenness”, that is, a tendency to buy environmental friendly products. Perhaps y4through y6 represent three different measures of innovativeness. In any case, the point is that they’s are p manifest or observed variables. As has been mentioned, we are representing the datafrom a typical subject, the i-th, but the subscript i is left off according to the traditions in this area.On the right hand side, you have regression coefficients, the λij, which are basically β weights. Inthe context of factor analysis, regression weights are called factor loadings. The reason that theyhave two subscripts is that you need one subscript to keep track of the dependent variable, or theequation, and another subscript to keep track of the independent variable. And speaking of which,these are the η values of which there are m. The η’s are the common factors which explain muchof the behavior of the y’s, at least the part of their behavior that they have in common – thecovariances. Finally, we have the εi which are called unique factors. This is not exactly the samething as the error in a regression model. In regression, the error is an error-in-equations, also2called specification error. That is to say, unless a regression model has an R of 1, the model ismissing some explanatory independent variables or is otherwise mispecified. In factor analysis,the ε’s are errors-in-variables, or measurement error. The three variables we devised to measure“greenness”, for example, might not do so perfectly. We generally assume that the part that thethree variables have in common, as quantified by their covariances, must be due to the fact that allthree are at least partially measuring what they are supposed to be measuring. But each one of thethree has some variance that is unique to it. That is what the εi account for.We can write the model in matrix terms, y1 λ 11 y λ 2 21 L L y p λ p1λ 12λ 22Lλ p2L λ 1m L λ 2 m L L L λ pm εy Λη . ε1 η1 ε η 2 2 . L L ε p η m (9.2)By all rights, in addition to the y vector, the η and ε vectors should have a subscript i since theyare random variables, sampled from the population for which this model holds. On the other hand,Λ is a constant matrix, holding parameters that describe this population.So how does this model with unobserved variables make contact with reality? In order to showhow it does so, we need to start with some assumptions and some definitions. We will assumethat E(y) 0, a p by 1 null vector. This does not reduce the generality of the model at all, sincecovariances are not affected by the addition or subtraction of a constant [see Theorem (4.8)]. Inorder to estimate the model, we will make the assumptions thatη N(0, Ψ),ε N(0, Θ)Structural Equation Models111
and thatCov(ε, η) 0.Like the y vector, η and ε are mean-centered. We will also see quite a bit of the coviarancematrices for η and ε, with V(η) Ψ and V(ε) Θ. At this point, we are ready to see what thecovariance matrix of the y’s should look like. We have by the definition of variance in Equation(4.7)V(y ) Σ E (yy ′) E [( Λη ε )( Λη ε )′] Λ E ( ηη′) Λ ′ Λ E ( ηε ′) E (εη′) Λ ′ E(εε ′),but of the four components from left to right, pieces two and three vanish since Cov(ε, η) 0. Wehave made use of Equation (4.5) and (4.6). We can rewrite E(ηη′) Ψ, which was defined aboveas the covariance matrix of the η's when we were talking about assumptions. In piece four wehave E(εε′) Θ which was also defined above as the variance of the unique factors. Putting all ofthese conclusions together, we end up with the fact that the variance of y isV(y) ΛΨΛ′ Θ .(9.3)9.2 A Confirmatory Factor Analysis ExampleNow is the section of the chapter where we look at an example confirmatory factor analysis that isjust complicated enough to be a valid example, but is simple enough to be, well; a silly example.Lets say we have devised three questionnaire items which measure the consumers’ attitudetowards Beer B, and three other items that measure attitudes towards Beer C. Our six item surveythen contains the variables listed in the table:Variablesy1y2y3y4y5y6DescriptionMeasurement 1 of BMeasurement 2 of BMeasurement 3 of BMeasurement 1 of CMeasurement 2 of CMeasurement 3 of CTo finish describing the model, we will hypothesize that there are two factors, B (η1) and C (η2).Our model would then look like112Chapter 9
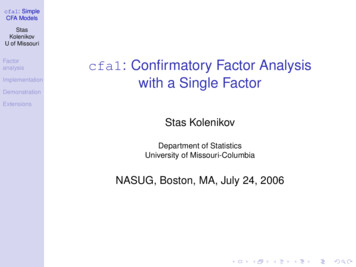
y Λη ε. y1 λ 11 y λ 2 21 y3 λ 31 y 4 0 y5 0 y 6 00 ε1 ε 0 2 ε 3 0 η1 λ 42 η 2 ε 4 ε 5 λ 52 λ 62 ε 6 Again, remember that the y, η and ε vectors are random variables, but Λ is a parameter matrix andthe unknowns in it must be estimated from the sample. To fully estimate the model, we also havetwo other parameter matrices, ψ 11Ψ ψ 21 andψ 22 θ11 0Θ L 0 0θ 22L00 L 0 .L L L θ pp LNote that the Ψ matrix is symmetric, being a covariance matrix and so we do not need toenumerate the upper triangular part of it. And by the definition of what we mean by a uniquefactor, the εi are independent which means that the variance matrix of the εi, Θ, is diagonal. As ageneral rule in covariance structure models, we need to specify variances and covariances of righthand side random variables, and we need to specify regression weights between right hand and lefthand side variables.Below you can see what we call the Path Diagram for this y6A path diagram is a very common way of representing a covariance structure model, and there area set of conventions that go along with this type of figure. Single-headed arrows representdirectional causal pathways, and two-headed arrows are used to represent covariation. UniqueStructural Equation Models113
factors, and other sorts of error terms, are usually indicated by single-headed arrows withoutlabels. Circles are used to convey the presence of latent variables, and boxes convey observedvariables.9.3 Setting a Metric for Latent VariablesThe model as it has been presented so far cannot be uniquely identified. To illustrate this, letspretend we have a single variable and a single factor. In that case everything boils down to2scalars, and the model is y λη ε and from Equation (9.3), V(y) λ ψ θ. Now define η* 2a·η so that V(η*) a ψ ψ*. Also, define λ* λ/a. In that case,y λ* η* ε λ aη ε and alsoaV( y) λ*2 ψ* θ λ2 2 a ψ θ.a2(9.4)(9.5)What this means is that if I have a model with parameters λ* and ψ*, and you have a model withparameters λ and ψ, both models would fit equally well and there would be no logical way todecide which was better. In fact, they would be completely equivalent. The source of thisambiguity lies in the fact that η is unobserved, and it is at most an interval scale. To furtheridentify the model we must set intervals for it, a process called setting its metric. We can do thisin one of two ways. We can fix one loading per factor to a constant, such as 1.0, or we can fix thevariance of each factor to 1.0. Returning to our two factor example, the first method would yield 1 λ 21 λΛ 31 0 0 00 0 0 , and1 λ 52 λ 62 ψΨ 11 ψ 21 ψ 22 while the second approach would give λ 11 λ 21 λΛ 31 0 0 00 0 0 , andλ 42 λ 52 λ 62 1Ψ ψ 21 .1 These two methods are equivalent, yielding the same Chi Square values, but the first method isslightly more general, being applicable in certain situations where the second method cannot beused. The first method ties the metric of each factor to the first variable that measures it. Thesecond method turns the factors into z-scores, and the factor covariance matrix Ψ can then beinterpreted as a correlation matrix. For both methods, the Θ matrix has p free parameters.114Chapter 9
9.4 Degrees of Freedom for a Confirmatory Factor Analysis ModelFactor analysis does not look directly at raw data. The input data for this technique are theelements of the sample covariance matrix S, which is a p by p symmetric matrix. Therefore Scontainsp(p 1)2(9.6)“data points”, those being the p variances and the p(p-1)/2 unique covariances. For our 6 variableexample, this would total 21. In our model, assuming we use the first method to fix the metric ofthe two factors, we have4 λ’s3 ψ’s6 θ’s------13 parametersThe degrees of freedom for the model are equal to the number of data points minus the number ofunique free parameters that are estimated from those data. In our case, we have 21 – 13 82degrees of freedom. We will be able to reject the model (or not as the case may be) using a χ testwith 8 degrees of freedom. In terms of hypotheses, we will be testingH0: Σ ΛΨΛ′ Θ(9.7)H A: Σ S .(9.8)against the general alternativeIn some ways this pair of hypotheses is very similar to hypotheses that we saw in Chapter 6 withregression. However, here we have a different sort of emotional attachment to the hypotheses. Inregression, which encompasses everything from the basic t-test through more complexpossibilities, we are generally motivated to “hope for” HA and hope against H0. Here, our model isH0, so in an emotional sense, the roles of the Type I and II errors are reversed. The truth is that thecurrent situation is actually more natural, if we can use that word. In regression, the hypothesis weare testing is a sort of “straw man” that no one believes in anyway, and that we set up just toknock down. We will talk more about the “emotional reversal” of H0 and HA later when we2discuss goodness of fit measures (that is, measures other than the traditional χ ). But first, it is2time to understand how we estimate the parameters of the model and come up with a χ value totest it. That is the topic of the next two sections. We will be using an estimation philosophyknown as Maximum Likelihood. In order to explore this topic, we will be returning to the muchsimpler regression model. Then we will venture forth and look at estimation for confirmatoryfactor analysis models.9.5 Maximum Likelihood Estimators for Factor AnalysisMaximum likelihood is discussed in general in Section 3.10 and within the context of theregression model in Section 5.4. ML for factor analysis begins with the probability of observationi under the confirmatory factor analysis model. Here we have the multivariate normal distributionStructural Equation Models115
[see Equation (4.17)] to deal with since we have p variables, not just one as we did withregression. We havePr(y i ) 1 1 exp y ′i Σ 1 y i (2π) p / 2 Σ 1 / 2 2 (9.9)for the p variables on observation i. For the whole sample we havenl0 1Pr( y i ) (2π)inp / 2 Σ n/2 1exp 2n y′Σii 1 y i . (9.10)abThe summation in the exponent of the above equation makes sense if you keep in mind that e · ea b e . Now, to get ready for the next equation note that from Equation (1.27) and Section 1.7n y′Σ 1iy ′i tr [nSΣ 1 ](9.11)ibecausen i y ′i Σ 1 y i Tr y ′i Σ 1 y i Tr n y y′Σii 1 Tr [nSΣ 1 ] .iThis is so since a scalar is equal to its trace, and the trace of a product is invariant to the sequenceof that product assuming conformability. We now take the log of the likelihood in Equation (9.10)but substitute the identity from Equation (9.11) to end up withln l0 L 0 111n p ln (2π) n ln Σ n tr (SΣ 1 )222(9.12) constant []1n ln Σ tr (SΣ 1 ) .21n p ln (2π) which doesn't impact the optimal solution2one way or the other since it does not depend on the parameters and so will not figure into thederivative. Now suppose I look at the likelihood under HA: Σ S. We will call that loglikelihood LA and we find thatThe term "constant" above represents 1LA constant - n [ln S p] .2(9.13)Now we have two log likelihoods, one; L0 which reflects the confirmatory factor analysis model,and another that gives us the log likelihood under the general alternative that Σ exhibits noparticular structure, which is to say it is arbitrary. In other words, it is what it is.It turns out that under very general conditions,116Chapter 9
l 2 ln 0 2 [L 0 L A ] χ 2 (m) , lA (9.14)where m represents the difference in the number of parameters estimated under the two models;the null (0) and the alternative (A). As we have already described, the alternative model estimatesp(p 1)parameters while the number of parameters in the null model depends on the specific2theory as expressed in the matrices Λ, Ψ and Θ. Plugging Equations (9.12) and (9.13) into2Equation (9.14), the χ value is then[]χˆ 2 n ln Σ ln S tr (SΣ 1 ) p .(9.15)As can be seen, as Σ S, χˆ 2 0. Thus the closer the match between Σ and S, the smaller the2value of χ . But it is also true that as n , χˆ 2 , and conversely, as n 0, χˆ 2 0. Thismeans that all things being equal, it becomes easier to reject H0 the larger the sample size, and itbecomes harder to reject H0 the smaller the sample size. This is how all efficient statisticsfunction, but since we have an emotional attachment to H0 instead of HA, this would seem to havecertain consequences both for individual researchers, and for the development of marketing as awhole.It is necessary that we pick values for the unknowns in the matrices Λ, Ψ and Θ at the minimumvalue of Equation (9.15). Equation (9.15) is obviously nonlinear in the unknowns so this willentail nonlinear optimization as discussed in Section 3.9. For now we note that any computeralgorithm that finds the minimum of Equation (9.15) will utilize the derivatives of that function todetermine "which way is down". Any such algorithm, however, requires rational starting values toavoid ending up in a local, rather than the global, minimum of the function. As such, you shoulddo the best job that you can by manually inserting starting values into whatever program you useto estimate the confirmatory factor model. Certainly, under any circumstances, you should beable to get the sign right for any loadings in the matrix Λ. Diagonal elements of Θ could beseeded with small positive values. Diagonal elements of Ψ are likely to resemble the variances ofthe measures, while off-diagonal elements could be smaller than the diagonal, and of appropriatesign. Of course, it is also important that any fixed elements in the matrices Λ, Ψ and Θ haveappropriate starting values, as these will also end up as the final values!9.6 Special Case: The One Factor ModelConsider a confirmatory factor model with one factor: ε1 y1 λ 1 ε 2 y 2 λ 2 η . L L L ε p y p λ p If we fix V(η) ψ11 1, the expression for the covariance matrix is simplyΣ λλ′ ΘStructural Equation Models(9.16)117
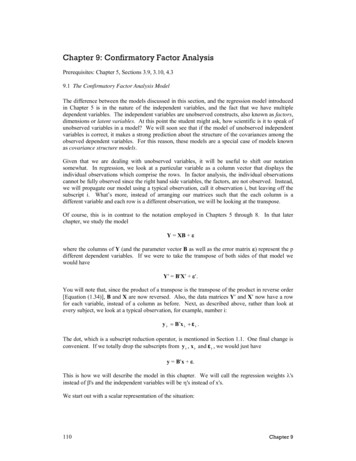
and our measures y1 , y2 , , yp are called congeneric tests. In this context the single η is called atrue score. As you might guess, this terminology comes from the field of educational andpsychological measurement. If we further specialize the model so that all lambdas are equal, i. e.λ1 λ 2 L λ p λ ,we have the model of τ-equivalent tests. Congeneric tests have p λ’s and p θ’s, but τ-equivalenttests have only one λ and p θ’s. Finally, the model of parallel tests includes the additionalrestriction thatθ11 θ 22 L θ pp θ .Congeneric tests involve 2p free parameters to be estimated from the sample covariances, τequivalent tests have p 1 parameters, and parallel tests have only 2 unknown parameters. Thusthe model of parallel tests makes a very strong prediction about the structure of the covariancematrix using only 2 parameters. Having only 2 parameters means that the model has a largernumber of degrees of freedom than τ-equivalence and especially congeneric tests. The degrees offreedom of the model represent restrictions that must be met in the covariance matrix. As such,parallel tests places many more restrictions on the covariance matrix which is shown below: θ 0 L 0 λ 0 θ L 0 λ .Σ [λ λ L λ ] L L L L L 0 0 L θ λ 9.7 The Multi-Trait Multi-Method ModelWe sometimes have an opportunity to measure a set of traits using a common set of methods. Forexample we might measure the consumer’s attitude towards a set of products repeating the sameitems to measure each product. With three traits (products) and three methods (items) we wouldhave a path diagram as below. Note that to simplify an already complicated diagram, the uniquefactors were left off, as were the labels on the arrows.118Chapter 9
η1y11y21y31η2y12η3y22η4y32η5y13y23y33η6and then the model would appear as y11 λ 11 y 21 λ 21 y 31 λ 31 y12 0 y 0 22 y 0 32 y13 0 y 23 0 y 33 000λ140000λ 250000λ 420λ 440λ 5200λ 55λ 620000λ 73λ 7400λ 830λ 850λ 93000 0 λ 36 0 0 λ 66 0 0 λ 96 η1 η 2 η3 η 4 η 5 η 6 ε11 ε 21 ε 31 ε12 ε 22 , ε 32 ε13 ε 23 ε 33 where η1, η2 and η3 are trait factors and η4, η5 and η6 are method factors. To finish specifying themodel, we note that V(ε) Diag(θ11 θ22 ··· θ99), meaning that the nine unique elements of Θ arearrayed on it’s diagonal, and that 1 α 21 αV( η) Ψ 31 0 0 0Structural Equation Models1α 32000 10 10 β 210 β 311β 32 1 119
α . 0 β The three by three section of zeroes in Ψ is null because trait and method factors are assumed2independent, an assumption that we would be testing when we look at the χ for the model. Notethat we have called the correlations among the trait factor α’s and the correlations among themethod factors β’s. This does not change anything of course. This is just a confirmatory factoranalysis model in which certain values in the Ψ matrix are playing slightly different roles fromother values.9.8 Goodness of Fit, Root Mean Square Error, and OtherOutput from the ModelWith a large enough sample size, one can statistically reject even fairly good models. Conversely,with a small sample size it is possible to fail-to-reject models that are patently incorrect. Giventhat state of affairs, Bentler and Bonet (1980) proposed that in addition to comparing H0 vs HA,that we introduce a truly null hypothesis. I will call this latest hypothesis HS for “straw man”hypothesis. Specifically we haveH A: Σ SH0: Σ ΛΨΛ′ ΘHS: Σ Ψ (with Ψ diagonal)For the straw man hypothesis, HS, we have further restricted H0 such that Λ I, Θ 0, and Ψ isdiagonal. We have three hypotheses. For hypothesis j, with degrees of freedom dfj, we defineQj χˆ 2df jand then we defineρs0 QS Q0QS 1(9.17)Δ s0 χˆ s2 χˆ 02χˆ s2(9.18)as one possible measure andas another measure of goodness of fit. This latter index, Δs0, where the subscripts s and 0 highlightthe fact that we are comparing hypotheses s and 0, represents the percent improvement in χ̂ 2 fromhypothesis s to hypothesis 0. The quantity 1 - Δs0 gives us the remaining improvement that wouldbe possible for HA.Joreskög has proposed an index simply termed GFI that consists of120Chapter 9
GFI 1 [tr Σ 1S Itr ( Σ 1S)]2and an adjusted version,AGFI 1 p(p 1)(1 GFI)2 df 0We should also mention that there exists a traditional measure of fit for any sort of model, the rootmean square error, orpRMSE i (si 1ij σ ij ) 2j 1p(p 1) / 2.Note that the double summation operators in the numerator run through each of the uniqueelements in the covariance matrix. The RMSE gives you the average error across the elements ofΣ as compared with S.We can also look at lack of fit for any individual fixed parameter. Of course, any free parameterestimated from the sample covariance matrix S does not contribute to lack of fit. It is the fixedparameters, generally the 0’s in Λ, Ψ and Θ that are being tested in H0 and it is these elements thatcause a model to not fit. Given that we are picking free parameters in such a way that thederivative of Chi Square with respect to those parameters is 0, or assuming all of our freeparameters are in the vector α′, we have solved for the free parameters when χˆ 2 0′ α ′because when the derivatives are zero, Chi Square is minimized. But this suggests a way to judgethe fixed parameters. For any fixed parameter, say π, in general χˆ 2 0. πThese first derivatives provide a clue as to which parameter can be changed from fixed to free forthe maximal benefit to χˆ 2 . All that remains is that we scale the first derivative with the secondderivative and we have what is called a modification index, or MI:2n χˆ 2 2 π MI . (χˆ 2 ) 2 π πGeneral information on the second order derivative is given in Section 3.3 and its role in ML isdiscussed in Section 3.10.Structural Equation Models121
ReferencesBentler, Peter and Douglas Bonett (1980) Significance Tests and Goodness-of-Fit in the Analysisof Covariance Structures. Psychological Bulletin, 88, 588-606.Cole, David A and Scott E. Maxwell (1985) Multitrait-Multimethod Comparisons AcrossPopulations: A Confirmatory Factor Analytic Approach. Multivariate Behavioral Research. 2,389-417.Jöreskog, Karl Gustav (1969) A General Approach to Confirmatory Maximum Likelihood FactorAnalysis. Psychometrika. 34 (2), 183-200.122Chapter 9
Chapter 9: Confirmatory Factor Analysis Prerequisites: Chapter 5, Sections 3.9, 3.10, 4.3 9.1 The Confirmatory Factor Analysis Model The difference between the models discussed in this section, and the regression model introduced in Chapter 5 is in the nature of the independent variables, and the fact that we have multiple dependent variables.