Transcription
Malaysian International Psychology Congress-2015MIPC0006MEASURING EMOTIONAL INTELLIGENCE IN A MALAYSIAN SAMPLE: ANEXPLORATORY FACTOR ANALYSISMohamad Nahar Abd Razak & Harris Shah Abd Hamid*Department of Psychology, International Islamic University MalaysiaPO Box 10, 50728 Kuala Lumpur, MalaysiaABSTRAKSchutte et al. (1998) membangunkan 33 item skala kecerdasan emosi yang didakwa bersifatunidimensional. Petrides dan Furnham (2006) telah menjalankan analisis faktor untuk skala yangberkenaan sama dan mendapati empat faktor yang mendasari skala. Kajian tentang kecerdasan emosi telahdijalankan di Malaysia dengan skala yang telah diterima pakai, disesuaikan, dan dibangunkan oelhpengkaji tempatan. Kedimensian skala perlu ditunjukkan dengan jelas untuk meletakkan penemuan kajiankecerdasan emosi dalam konteks tempatan. Kajian ini meneliti struktur faktor versi dwibahasa (terjemahanMelayu oleh Abd Hamid dan Kimin, 2004) yang menggunakan utama paksi pemfaktoran dengan putaranortogon varimax, dengan sampel Malaysia. Skala ini telah diberikan kepada 187 pekerja Malaysia disebuah agensi kerajaan dan komuniti kolej. Analisis ini mendedahkan empat faktor yang mendasari skalayang padan dengan penemuan Petrides dan Furnham. Kebolehpercayaan didapati baik untuk tiga faktordan tidak boleh diterima untuk satu faktor. Isu-isu berkaitan struktur faktor juga dibincangkan.Kata kunci: kecerdasan emosi, analisis faktor, MalaysiaABSTRACTSchutte et al. (1998) developed a 33-item emotional intelligence scale which they claimed to beunidimensional. Petrides and Furnham (2006) conducted factor analysis on the same scale and found 4factors underlying the scale. Studies on emotional intelligence had been conducted in Malaysia withscales that were adopted, adapted, and developed. The dimensionality of the scales needed to be clearlydemonstrated to better put the findings within the local context. This study examined the factor structure ofthe bilingual version of the scale (Malay translation by Abd Hamid and Kimin, 2004) using principal axisfactoring with a varimax orthogonal rotation, in a Malaysian sample. The scale was administered to 187Malaysian employees in a government agency and a college community. The analysis revealed fourEmailutama:Petrides and Furnham’s findings. Reliability was found to befactorsunderlyingpengarangthe scale that matchedharris@iium.edu.mygood for three factors and unacceptable for one. The issues in the factor structure were discussed.Keywords: emotional intelligence, factor structure, MalaysiaINTRODUCTIONEvidence suggests that emotional intelligence (EI) has value at the workplace. Salesmen at Met Lifeinsurance company in the United States who scored high on optimism achieved 37% higher sales thantheir colleagues who were pessimistic within their first 2 years of employment. “Learned optimism” is aconstruct of emotional intelligence (Cherniss, 2000, quoting Seligman, 1986). EI was found to havesignificant, positive relationship to organizational commitment among teachers in the United States (Anari,2012) and employees of SME in Iran (Khalili, 2011). There is no universally agreed definition of EI. Adefinition of EI, proposed by Boyatzis, Goleman, and Rhee (2000, p.4), is as follows: “emotionalintelligence is observed when a person demonstrates the competencies that constitute self awareness, selfmanagement, social awareness, and social skills at appropriate times and ways in sufficient frequency tobe effective in the situation.”Studies have been conducted to develop scales that are concise and able to comprehensively measure EI.One such example is the work of Schutte et al. (1998) who developed a 33-item scale. The authorsclaimed that “The 33 items loading on factor one represented all portions of the conceptual model of28
Malaysian International Psychology Congress-2015Salovey and Mayer (1990)” (p.171). This scale would be tempting for I/O psychologists who needeconomical and reliable scale. However, the study came under heavy critique from Petrides and Furnham(2006) especially on the method of factor analysis which they implied as rudimentary at best. The criticsargued that if the scale had been developed based on a conceptual model then factor analysis would haveshown the factor structures underlying the model. The critics conducted a confirmatory factor analysisusing LISREL and found the lack of fit for the single factor model. Exploratory factor analysis by thecritics revealed 4 factors underlying the scale. Prentice and King (2013) also derived a four factor solutionusing data from 261 casino workers. Their study used CFA based on Pearson Covariance Matrix andMaximum Likelihood Estimation.Schutte’s 33-item emotional intelligence scale had been used in Malaysian and showed good reliability.Liau et al. (2003) used the English version of the scale on 203 secondary school students. The Cronbachalpha in that study was 0.76. Exactly the same alpha value was obtained by Md Nawi and Redzuan (2011)in their study with 276 adult volunteers and non-volunteers. The Malay translation of the scale was testedamong 161 university students and the reliability was 0.85 (Abd Hamid & Kimin, 2004). Another studyfound the alpha to be 0.88 when tested with 100 participants whose age ranged from 15 to 59 years (Andi,2004). Both the English and Bahasa Melayu versions of the scale demonstrated good reliability. However,the factor structure of the scale was not examined as extensively. In one study with 127 university staff,Ngah, Jusoff and Rahman (2009) used Principle Axis Factoring with oblique rotations. The researchersremoved seven items from the English version of the scale and found three factors namely utilization ofemotion, regulation of emotions, and expressions of emotions.Therefore, the objective of this study is to examine the factor structure of the EI scale developed bySchutte et al. (1998) by way of exploratory factor analysis. However, in this study, a bilingual (includingMalay) version of the scale will be examined.METHODParticipantsIn total, 187 employees participated in the study (45 males, 128 females and 1 not disclosed). The meanage of the sample was 33.22 years (SD 7.10, min 24, max 56).MaterialsThe questionnaire was developed by Schutte et al. (1998) and translated into Malay by Abd Hamid andKimin (2004). It contains 33 items, three of which are reverse-coded (items 5, 28, 33). Respondents ratetheir agreements to such items as “I like to share my emotions with others” and “I am aware of the nonverbal messages that I send to others” on a 5-point Likert-type scale (1 strongly disagree, 5 stronglyagree). The total score is the sum of all items, which can range from 5 to 165, with higher score indicatinga higher emotional intelligence. The items are shown in Appendix A.ProcedureParticipants from a government defence agency and a community college completed the questionnairewhen they were attending training programs. SPSS version 17 was used as the statistical analysis tool.RESULTSData ScreeningFrom 187 cases, 12 cases were eliminated using listwise deletion and 2 cases were eliminated as outliers,with 173 valid cases remained. The ratio of 5.24 cases per variable did not satisfy the minimum amount ofdata for factor analysis. This serves as a caution to the study.Factor AnalysisTo begin with, the normality of the data was checked. The skewness of the distribution was .12 (SE .19)while a kurtosis of .04 (SE .37) indicates that the distribution is flatter than normal. KolmogorovSmirnov with Lilliefors significance correction test statistic of .072 (df 173, p .027) indicates that thedata is not normally distributed. This serves as a caution to the study.Next, the factorability of the EI items was examined. Several well-accepted criteria for the factorability ofa correlation were used. Firstly, an inspection of the inter-item correlation matrix revealed that all itemsbut 1 (item 28, reverse-coded) correlated at least .3 with at least one other item, suggesting reasonablefactorability. Secondly, Kaiser-Meyer-Olkin test of sampling adequacy value of .83, more than therecommended value of .60, indicated that factor analysis may be useful to be carried out on this data.Thirdly, Bartlett’s test of sphericity was significant (χ 2 2073.61, df 528, p .01), indicating that the29
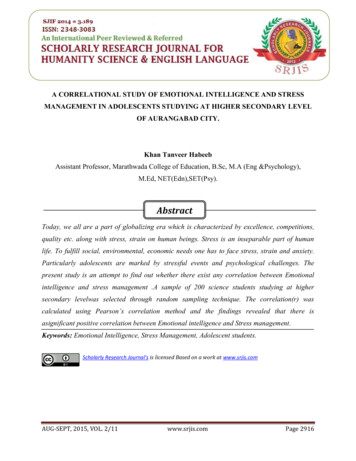
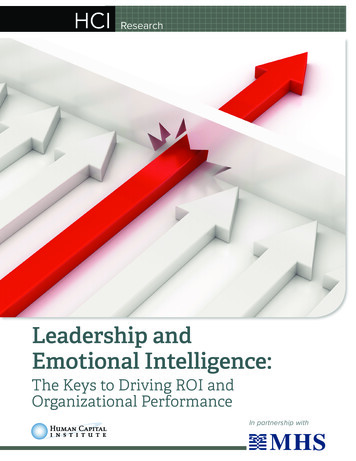
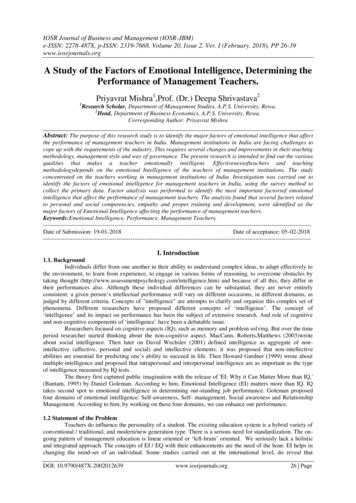
Malaysian International Psychology Congress-2015correlation matrix was not an identity matrix and that the items were related and therefore suitable todetect structure. Fourthly, except item 5 (reverse-coded), all of the diagonals of the anti-image correlationmatrix were above .50. Finally, the communalities for all but 2 items (5 and 28, both reverse-coded) wereall above .3, confirming that each item shared some common variance with other items. Given the overallindications, factor analysis was deemed to be able to be carried out but with caution.Principal axis factoring was used as the preferred method for extraction to mitigate the risks of thepotentially poor multivariate normality of the data. Kaiser criterion was applied to extract the structures(items with eigenvalues greater than 1). However, the criterion may not always obtain the best outcomesfor some data sets (Costello & Osborne, 2005). The extraction produced a nine-factor model thatexplained 47% of the total variance. The first factor explained 23.7% of the variance while factors 2, 3and 4 (eigenvalues from 1.5 to 2.5) explained 6.0%, 4.41% and 3.09%, respectively. Factors 5 to 9(eigenvalues of just over 1) explained 1.55% to 2.65% of the variance each. Meanwhile, an inspection ofthe scree plot (see Fig. 1) revealed a four-factor model. The four-factor model was preferred because thenumber was more manageable. Furthermore, the scree plot is better than Kaiser’s criterion at determiningstructures (Costello & Osborne, 2005). Table 1 shows the factor loadings of Varimax-rotated factors.Next, 4 factors were fixed to be extracted and a model which explained 35.85% of the variance wasproduced. Both Varimax (orthogonal) and direct oblimin (oblique) rotations were subjected on the modelto produce a solution. The solution from Varimax rotation was preferred because it was clear andrelatively easier to interpret the meaning of the factors. The resulting solution from the oblimin rotation,although almost similar to the Varimax-rotated solution, had factor correlations below .30 for 3 out of 5relations, contained factors with items that were all negatively loaded, and contained items with positiveand negative loadings on multiple factors.30
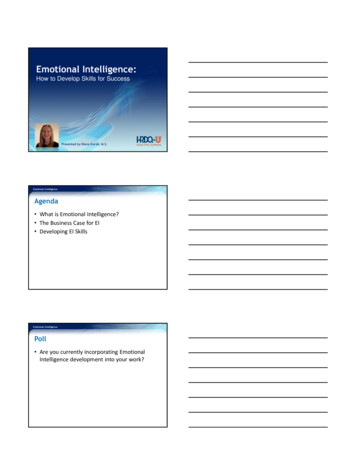
Malaysian International Psychology Congress-2015Table 1. Factor loadings of varimax-rotated factors from the emotional intelligence scaleaaItem numberFactor 1Factor 2Factor 3Factor -.104.078.118-.055.535-.432.406.385-.317Factor loadings greater than 0.30 are shown in boldface.The items along with their numbers are presented in Appendix A.31
Malaysian International Psychology Congress-2015Fig. 1. Scree plot of 33 items in the Emotional Intelligence scaleCostello and Osborne (2005) suggested that researchers decide whether to eliminate an item that loads at.32 or higher on two or more factors. In this study, items with a primary factor loading of less than .30 orcross-loaded with .30 or above were eliminated. In a factor that contained items with positive andnegative factor loading, items with negative loadings were eliminated to ensure a simple factor structure.As a result, 24 items were retained and 9 items that met the criteria were removed (12, 15, 19, 23, 26, 27,5r, 28r, and 33r).In the second iteration, principal axis factoring analysis was conducted on the 24 items, using bothVarimax and oblimin rotations, extracting 4 factors that explained 39.65% of the total variance. Obliminrotation failed to produce any pattern within 25 iteration limit. On the other hand, Varimax rotationproduced 4 factors with almost equal amount of items in each. However, items that primarily loaded to thefactors were not as semantically clear as the factors that emerged before the item reduction was carriedout. The loss of clarity in the meaning of the factors after item reduction did not justify the increase of3.8% in variance explained. Therefore, the four factors with all the 33 items from the first iteration weredecided to be retained and further tested for internal consistency. The four factors were labelled ‘MoodRegulation’, ‘Emotion Appraisal’, ‘Emotion Utilization’, and ‘Social Skills’ as previously used by Petrideset al. (2000).Subsequently, internal consistency of the four sub-scales was tested. However, only 3 scales obtainedgood Cronbach’s alphas: .89 for Mood Regulation (14 items), .77 for Emotion Appraisal (8 items), .78 forEmotion Utilization (5 items). Social Skills (6 items) obtained an unacceptable alpha of .21. Furtherelimination of items did not yield much higher Cronbach’s alphas.Means of the factors were obtained based on the scores of the items primarily loaded on the factors.Higher scores indicated higher emotional intelligence; namely, higher ability in regulating mood,appraising emotion, utilizing emotion and better social skills. Employees were best at mood regulation(M 4.11, SD .38), followed by emotion utilization (M 3.94, SD .52) and emotion appraisal (M 3.77,SD .47). The skewness and kurtosis for the scales and inspection of the histograms suggested that thedistributions of the data could be considered as approximately normal. Although an orthogonal (Varimax)rotation was used, the factors were found to be correlated, ranging from weak to strong. Table 2 shows thedescriptive statistics and correlations for the factors.32
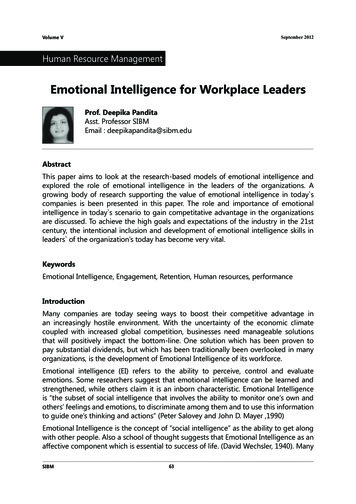
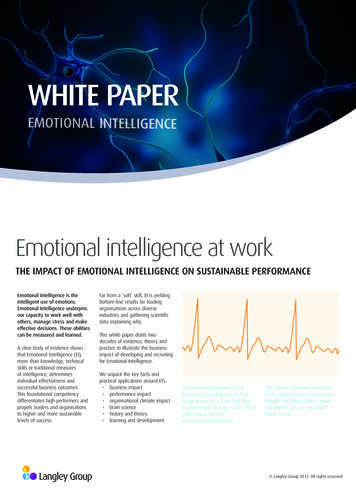
Malaysian International Psychology Congress-2015Table 2. Descriptive statistics and correlations for Mood Regulation, Emotion Appraisal, EmotionUtilization and Social SkillsFactorMMood Regulation4.11Emotion Appraisal3.77Emotion Utilization 3.94Social Skills3.31All correlations sig. at p 9.48.34.26Taken as a whole, the analyses indicated that four factor were underlying the emotional intelligence scale.Using the factors and retaining all 33 items, 3 factors demonstrated good internal consistency while 1 scalehad an unacceptable internal consistency. The composite scores of the three factors had evidence ofapproximately normal distribution; therefore, the data was deemed suitable for further parametricstatistical analyses.DISCUSSIONBased on the data screening and factorability of the data, it was found that factor analysis was suitable tobe carried out on the bilingual EI scale. A four-factor structure emerged from the 33 bilingual items basedon principal axis factoring exploratory factor analysis using oblique rotation strategy (direct oblimin) astested in a Malaysian sample. The four factors matched the factors proposed by Petrides and Furnham(2000) which were mood regulation, emotion appraisal, emotion utilization, and social skills withacceptable Cronbach’s alphas, except for social skills.In selecting the items to be retained in each factor, Costello and Osborne (2005) proposed that the factorwith item loadings above .30, with no or few cross-loadings, and comprised of three or more items shouldbe considered as best fit for the data. The first factor, mood regulation, comprised of 14 items (2, 3, 6, 7,8, 9, 10, 14, 16, 23, 24, 26, 30, and 31) that described awareness of own emotions (e.g. “I am aware of myemotions as I experience them”) and optimism (e.g. “I expect good things to happen”). This factor wasalso labelled as optimism by Petrides and Furnham (2000). Twelve items loaded above .40 while Items 26and 31 cross-loaded on factor 3 but it was decided to retain them on this factor as their primary loadingvalues were above .40 and just over .30 on factor 3.The second factor, emotion appraisal contained eight items (1, 4, 15, 18, 19, 25, 29, and 32) pertaining todetecting and interpreting emotions (e.g. “By looking at their facial expressions, I recognize the emotionspeople are experiencing”, “I can tell how people are feeling by listening to the tone”). Items 15 and 29cross-loaded on factor 4 and item 19 on factor 3; but the items were decided to be retained based on thesame justification. Furthermore, the items were also face valid.The third factor, emotion utilization, comprised of five items (17, 20, 21, 22, 27) which have affinity tocontrol and put the emotion to good use (e.g. “I have control over my emotions”, “When I am in a positivemood solving problems is easy for me”). Four of the items cross-loaded on other factors; 3 items crossloaded on another factor and 1 item cross-loaded on 2 other factors. The items were retained as they wereface valid and high loading on this factor.Social skills as the last factor consisted of 6 items (5 reverse-coded, 11, 12, 13, 28 reverse-coded, 33reverse-coded). The items pertained to actions of a person in relation to others (e.g. “I like to share myemotions with others”, “I arrange events others enjoy”). Item 12 cross-loaded on factor 1. Item 28(reverse-coded) had a loading of below .30. However, the item was included in this factor together withthe other reverse-coded items. As cautioned during data screening, item 5 “I find it hard to understand thenon-verbal messages of other people” showed low anti-image correlation and low communality. Item 28“When I am faced with a challenge, I give up because I believe I will fail” also showed low communality.Furthermore, based on the author’s own experience in inspecting reliability and validity of scales, reversecoded items tend to cause issues in internal consistency. Therefore, grouping them together would allowthe factor to be dropped during analysis.The factors were found to be correlated although varimax rotation was used. Varimax rotation is favoredwhen there is a basis to believe that the factors should not be related to one another. In theory, it would beideal that factors are only minimally related; however, in reality, a person will not be able to regulate33
Malaysian International Psychology Congress-2015his/her mood without the ability to appraise the emotion. Therefore, some correlation among the factorsshould be expected (Petrides & Furnham (2000).A researcher intending to measure EI using this scale should take note of the low reliability of the socialskill factor or consider excluding this factor. Also, scale developers may need to consider avoidingreverse-coded items in Malaysia.REFERENCESAbd Hamid, H.S. and Kimin, J. 2004. An exploratory study on emotional intelligence: a comparisonbetween university students and student leaders. Jurnal Kinabalu, 10, 35-48.Anari, N. N. 2012. Teachers: emotional intelligence, job satisfaction, and organizational commitment.Journal of Workplace Learning, 24(4), 256-269.Andi, H.K. 2011. Emotional intelligence of Malaysian youths. Institut Penyelidikan PembangunanBelia Malaysia. Malaysian Journal of Youth Studies, 5, 143-164.Boyatzis, R. E., Goleman, D. and Rhee, K. 2000. Clustering competence in emotional intelligence:Insights from the Emotional Competence Inventory (ECI). Handbook of Emotional Intelligence,343-362. San Francisco: Jossey-Bass.Cherniss, C. 2000. Emotional intelligence: What it is and why it matters. annual meeting of the Society forIndustrial and Organizational Psychology, New Orleans, LA, 15.Costello, A. B. and Osborne, J. W. 2005. Best practices in exploratory factor analysis: fourrecommendations for getting the most from your analysis. Practical Assessment Research &Evaluation, 10(7), 2-9.Khalili, A. 2011. Examining the Relevance of Emotional Intelligence and Organizational Commitmentamong Employees of Small and Medium Enterprise in Private Sector. International Journal ofBusiness and Management, 6(12), 180.Liau, A. K., Liau, A. W., Teoh, G. B., & Liau, M. T. 2003. The Case for Emotional Literacy: the influenceof emotional intelligence on problem behaviours in Malaysian secondary school students. Journalof Moral Education, 32(1), 51-66.Nawi, N. H. M., & Redzuan, M. R. 2011. Emotional Intelligence, Personality and Self Esteem: AComparison of the Characteristics among Two Categories of Subjects. International Journal ofHumanities and Social Science, 1(8), 238-247.Ngah, R., Jusoff, K., & Rahman, Z. A. 2009. Emotional intelligence of Malaysian academia towards workperformance. International education studies, 2(2), P103.Petrides, K., and Furnham, A. 2000. On the dimensional structure of emotional intelligence. Personalityand Individual Differences, 29(2), 313-320. Elsevier.Prentice, C., & King, B. 2011. The influence of emotional intelligence on the service performance ofcasino frontline employees. Tourism and Hospitality Research, 11(1), 49-66.Schutte, N. S., Malouff, J. M., Hall, L. E., Haggerty, D. J., Cooper, J. T., Golden, C. J. and Dornheim, L.1998. Development and validation of a measure of emotional intelligence. Personality andIndividual Differences, 25(2), 167-177.Seligman, M. E. and Schulman, P. 1986. Explanatory style as a predictor of productivity and quittingamong life insurance sales agents. Journal of Personality and Social Psychology, 50(4), 832.34
argued that if the scale had been developed based on a conceptual model then factor analysis would have shown the factor structures underlying the model. The critics conducted a confirmatory factor analysis using LISREL and found the lack of fit for the single factor model. Exploratory factor analysis by the critics revealed 4 factors .