Transcription
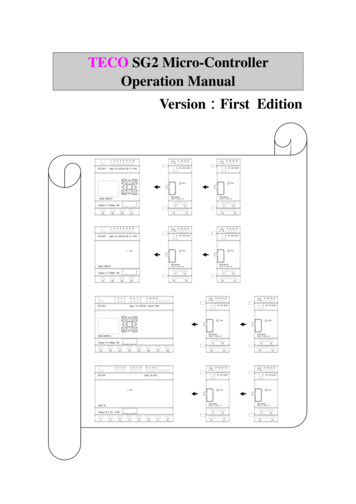
TECO 2012 – WMO TECHNICAL CONFERENCE ON METEOROLOGICAL AND ENVIRONMENTAL INSTRUMENTS AND METHODS OF OBSERVATIONOperational usage of Solid-State Weather RadarMasakazu Wada1, Naoki Anraku1, Hiroshi Yamauchi2, Ahoro Adachi21TOSHIBA corporation, Tokyo, Japan, o.jp2Meteorological Research Institute(MRI), Tsukuba, Japan, hyamauchi@mri-jma.go.jp,aadachi@mri-jam.go.jpI. INTRODUCTIONWith a rush of disasters in recent years caused by unusualweather, especially localized heavy rains and gusts, weatherradar plays a significant role in weather observation.To deal with these meteorological phenomena, we havedeveloped Solid-State Weather Radar (hereinafter SSWR),the new model of weather radar first installed in 2007. TheSSWR installed in MRI 1 is the first SSWR system used inJapan and the SSWR installed under management of MLIT2is the first operational SSWR used in Japan, which use dualpolarization with solid-state transmitters to achieve highlyaccurate observation of precipitation. Also, we havedrastically reduced its size and life-cycle cost compared withconventional radar.In this paper, we will describe the characteristic andperformance of SSWR to show that it delivers superiorperformance compared with those of conventional radarssuch as Klystron and magnetron, by evaluating actualobserved data provided from MLIT and MRI.As of April 2012, 15 units of Solid-State Weather Radarshave manufactured and installed by TOSHIBA Corporation.The new weather radar will provide useful weatherobservation data to greatly contribute to maintain safety andsecurity of our society.II. SOLID-STATE TRANSMITTERFigure 1 shows the evolution process of weather radar inJapan. The weather radar in the initial stage started itsoperation as analog radar which displayed the intensity ofback scattering of radio wave from rain as the intensity ofbrightness on a display. Later, the observation values weredigitalized to enable the quantitatively-detected observationof rainfall. In the 1990's, weather radar in Japan was dividedinto two radar types: Doppler radar and dual polarizationradar. Around the same time, the transmitter type changedfrom magnetron to klystron.Figure1. Evolution of Weather Radar in Japan12Meteorological Research Institute of Japan Meteorological AgencyMinistry of Land, Infrastructure, Transport and tourismNaoki Anraku
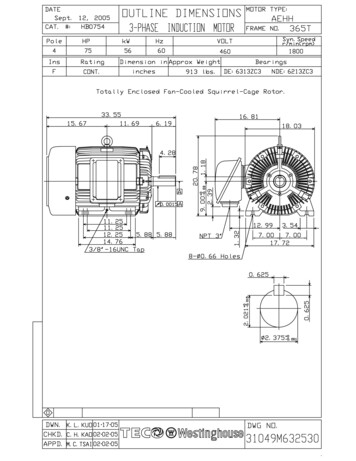
TECO 2012 – WMO TECHNICAL CONFERENCE ON METEOROLOGICAL AND ENVIRONMENTAL INSTRUMENTS AND METHODS OF OBSERVATIONToday, dual polarization Doppler radars are wildlydeployed in Japan. Solid-State transmitters are commonlyused for most of these radars.III.AC-BAND SOLID-STATE WEATHER RADARC-band Solid-state weather radarC-band SSWR is the first Solid-State transmitter basedweather radar system installed in Japan. It has small andhigh-performance digital signal processor to enable widearea and high-precision observation with low transmitspower.Figure 2 shows the appearance of C-band SSWR in MRIfacility and Figure 3 shows its major components.The size of transmitter was reduced by approximatelyhalf (based on Toshiba products) compared with theconventional weather radars. Table I. shows the majorspecification of C-band SSWR installed in MRI.TABLE I.SPECIFICATION OF C-BAND SOLID-STATE WEATHER RADARINSTALLED IN MRIItemObservation rangeFrequencyPulse widthPeak PowerReceiver dynamic rangeRadome diameterAntenna diameterAntenna gainBeam widthRange resolutionOutput dataIV.Description230 km or more in radius5370 MHz1 s to 129 s3.5 kW per polarization110 dB7 m or less4 m or less42 dBi or more1 deg or less150 m or lessReceived signal power (Ph, Pv)Doppler velocity V (m/s)Spectrum width W (m/s)Differential phase DP (deg)Correlation coefficient ( HV)X-BAND SOLID-STATE WEATHER RADARB X-band Solid-state weather radarFigure 4 shows the first operational X-band Solid-Statetransmitter based weather radar installed in site and Fig.5shows its major components. The major components wereaccommodated in the radome at the top of a steel tower bymaking them compact and light weight. Thus, byminimizing the length of waveguide, the attenuation ofradio wave was greatly reduced so that it allows sufficientobservation performance with small power. The size wasreduced by approximately 1/4 (based on Toshiba products)compared with the conventional weather radars and theconsumption power was reduced by approximately 1/10(based on Toshiba products).TABLE II. shows the major specification of X-bandSSWR deployed in Japan.Figure 2. C-band SSWR installed in MRI facilityFigure 3. C-band Solid-State Weather RadarFigure 4.X-band SSWR (outward appearance)
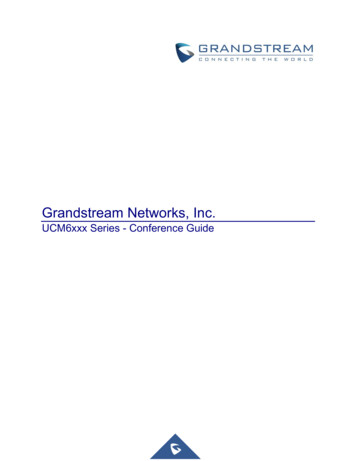
TECO 2012 – WMO TECHNICAL CONFERENCE ON METEOROLOGICAL AND ENVIRONMENTAL INSTRUMENTS AND METHODS OF OBSERVATIONBy virtue of the high precision with small sample number,the radar can observe dual-pol parameters with practicalantenna scan speeds of 4 rpm for low elevation angle (EL 8) and 6 rpm with high PRF for high elevation angle (EL 8 deg). This enables us to conduct volume scan with 13elevations of PPI and 2 azimuths of RHI every 4 minutes.The lowest elevation PPI scan (EL 0.5deg) is conductedevery 2 minutes.Figure 5. X-band Solid-State Weather RadarTABLE II. SPECIFICATION OF X-BAND SOLID-STATE WEATHER RADARINSTALLED IN MLITItemObservation rangeFrequencyPulse widthPeak PowerReceiver dynamic rangeRadome diameterAntenna diameterAntenna gainBeam widthRange resolutionOutput dataDescription80 km or more in radius9700 to 9800 MHz1 s to 32 s200 W per polarization110 dB4.5 m or less2.2 m or less41 dBi or more1.2 deg or less150 m or lessReceived signal power (Ph, Pv)Doppler velocity V (m/s)Spectrum width W (m/s)Differential phase DP (deg)Correlation coefficient ( HV)Figure 6. Distribution of hv for samples collected in stratiform rain withSNR larger than 20dB by the MRI radar.V. C-BAND OBSERVATION DATAAC-band dual-pol Radar in Tsukuba(MRI)Here, we report validation result of rainfall estimates withthe C-band SSWR of Meteorological Research Institute(hereinafter, MRI radar) using disdrometer observations for arecord heavy rainfall event.In the afternoon of 26th August, 2011, Tokyo metropolitanarea experienced a record heavy rainfall. The Nerima weatherstation of Japan Meteorological Agency observed hourlyaccumulation rainfall of 90.2 mm. This heavy rainfall eventwas observed by the MRI radar located 50 km northeast inTokyo and an optical disdrometer located in Itabashi, Tokyo.Adoption of solid-state transmitters brings severaladvantages such as narrow bandwidth, no need of highvoltage components, high redundancy and low operationalcost. One of the most important advantages is high precisionof dual-pol parameters.Figure 6 shows the distribution of hv for samples collectedin stratiform rain with SNR larger than 20dB by the MRIradar. Peak values of hv are 0.998 and 0.992 for long andshort pulse observations, respectively. The distribution seemsalmost independent of sample number N. Figure. 7 shows thedistribution of standard deviation of DP calculated usingnine gate windows along radial. Peak values of DP are 1.0deg and 2.0 deg for long and short pulse observations,respectively. As is the case with hv, the distribution seemsindependent of sample number N.Figure 7. Distribution of the standard deviation of DP for samplescollected in stratiform rain with SNR larger than 20dB by the MRI radar.Differential scattering phaseis removed from differentialphase DP using FIR filtering method proposed by Hubbertand Bringi (1995). Then specific differential phase KDP isderived from the dp using the method proposed by Savitzkyand Golay (1964). Attenuation corrected reflectivity Zcorr isderived from reflectivity Z and DP according to thefollowing equation:Zcorr Zobs 0.073 DP (Bringi and Chandrasekar 2001)Rain rate R(Kdp, Z corr) is estimated as follows:(KDP 1ºkm-1 or Zcorr 30dBZ) R(KDP, Zcorr) R(Zcorr) 0.0365 Zcorr0.625(Marshall and Palmer, 1948)
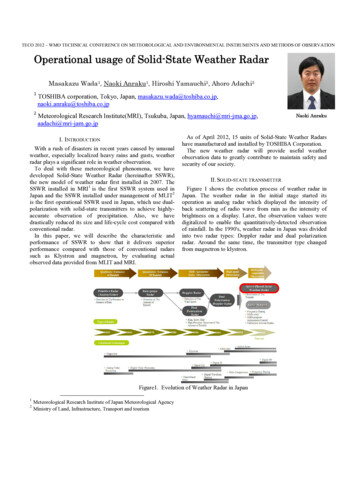
TECO 2012 – WMO TECHNICAL CONFERENCE ON METEOROLOGICAL AND ENVIRONMENTAL INSTRUMENTS AND METHODS OF OBSERVATION(Bringi and Chandrasekar 2001)Owing to adoption of solid-state transmitters, the MRI radarcan observe dual-pol parameters with high precision withsmall sample number. The peak values of HV and thestandard deviation of DP for stratiform rain are 0.998 and 1.0deg, respectively. This result shows that C-band solid-statedual-pol radar has sufficient capability, in order to observeheavy rainfall with a practical scanning rate.BObserved data and meteorology in Tsukuba(MRI)We had installed an optical disdrometer (Löffler-Mang andJoss, 2000) at our observation site in Itabashi, Tokyo(hereinafter Itabashi site). The distance between the Itabashisite and the radar site is 52 km. The height of the beam centerof the lowest elevation PPI is 600 m at this site.The disdrometer outputs raindrop size – velocity distributionfor specified time period. The distribution was recorded everyminute. The data with less velocity than the half or twice ofthe terminal velocity (Gunn and Kinzer, 1949) are removed.After the quality check, reflectivity Z(Disdro) and rain rateR(Disdro) are calculated from the distribution.ZcorrZItabashiItabashiheavy rainfall. The reflectivity in the heavy rainfall area issignificantly changed by the attenuation correction. Fig.9 israin rate distributions at the same time with Figure 8. The leftfigure shows rain rate distribution estimated using correctedZ and Z-R relation (R(Zcorr)) and the right figure shows rainrate distribution of R(KDP, Zcorr). R(KDP, Zcorr) indicates muchhigher value than R(Zcorr) in Tokyo metropolitan area.Reflectivity and rain rate obtained by the radar werecompared with those measured by the disdrometer over radarpixel centered on the disdrometer location. Since samplingvolume of radar observation locates hundreds of meters aloft,the comparison have to consider fall times of raindrops. Weassumed fall time was 3 minutes and shifted 3 minutes toradar observation time.Figure 10 shows the time series of reflectivity at the Itabashisite measured by disdrometer, Z(Disdro), observed by theMRI radar with attenuation correction, Zcorr, and withoutcorrection, Z. While Z is significantly less than Z(Disdro),Zcorr is similar to Z(Disdro) except the period of 15:10 to15:30 when Z(Disdro) is more than 50 dBZ.Figure 11 shows the time series of rain rate measured by thedisdrometer, R(Disdro), estimated from reflectivity withoutcorrection, R(Z), estimated from reflectivity with correction,R(Zcorr), and estimated from KDP and Zcorr, R(KDP, Zcorr). Thedisdrometer measured strong rain rates of more than100mmh-1 over 12 minutes, reaching as much as 160 mmh-1.The hourly accumulation of R(Disdro) from 15:00 to 16:00 is63mm.R(Kdp, Zcorr) agrees well with R(Disdro), while R(Z) andR(Zcorr) are quite different from R(Disdro). The hourlyaccumulation of R(KDP, Zcorr) agrees well with that ofR(Disdro) (9% overestimated). On the other hand, the hourlyaccumulation of R(Z) and R(Zcorr) are 84% and 44%underestimated, respectively.60Z(Disdro)Z̲corrZ302010R(KDP, 0015:00R(Zcorr)4015:10Figure 8. Reflectivity fields without attenuation correction (left) and withattenuation correction (right) observed by the MRI radar at elevation angle of0.5 at 15:21 LST, 26th August 2011.Reflectivity (dBZ)5016:50(KDP 1ºkm-1 and Zcorr 30dBZ)R(KDP, Zcorr) R(KDP) 129(KDP/f)0.85Time (LST)Figure 10. Time series of reflectivity at the Itabashi site measured bydisdrometer (red), observed by the MRI radar with attenuation correction(green) and without correction (brown).200R(Disdro)R(Z̲corr)R(Z)R(Kdp, Z̲corr)18012010080604020Time (LST)Figure 8 shows the reflectivity fields observed by the MRIradar at 15:21LST on 26th August 2011. At this time Tokyometropolitan area located southwest of the radar experiencedFigure 11. Time series of rain rate at the Itabashi site measured bydisdrometer (red), esteimated using Z corr (green), esteimated using Z(brown) and estimated using polarimetric parameters R(Kdp, Z 0015:20Figure 9. Sample of rain-rate fields estimated from Z-R relation (left) andestimated using specific differential phase (right) observed by the MRI radarat elevation angle of 0.5 at 15:21 LST, 26th August 2011.14015:10Itabashi15:00ItabashiRain rate (mm/h)160
TECO 2012 – WMO TECHNICAL CONFERENCE ON METEOROLOGICAL AND ENVIRONMENTAL INSTRUMENTS AND METHODS OF OBSERVATIONRainfall estimates of the MRI radar over radar pixel centeredon the disdrometer location were validated using thisdisdrometer observation. Time series of reflectivity withattenuation correction agrees well with that of thedisdrometer, if reflectivity is less than 50 dBZ. Time series ofrain rate estimated using Z-R relation is far from that of thedisdrimeter. On the other hand, time series of rain rateestimated from KDP agrees well with that of the disdrometer.The hourly accumulation of rain rate estimated from Z-Rrelation is 84% underestimated, while the estimation fromKDP is only 9 % overestimated.DStratiform and convective Observation by C-band SSWRFigure 12 and 13 show the stratiform precipitationobserved by MRI radar and Fig.14 and Fig.15 show theobservation result of convective precipitation. In theobservation result of stratiform precipitation, the meltinglayer is clearly represented can be inferred in the convectiveprecipitation. From these results, we can conclude that solidstate weather radars allow us to obtain favorable result in thedual polarization observation.Figure 13. PPI display of stratiform precipitation(C-band)Figure 12.RHI display of stratiform precipitation(C-band)
TECO 2012 – WMO TECHNICAL CONFERENCE ON METEOROLOGICAL AND ENVIRONMENTAL INSTRUMENTS AND METHODS OF OBSERVATIONFigure 14.RHI display of convective precipitation(C-band)Figure 15. PPI display of convective precipitation(C-band)
TECO 2012 – WMO TECHNICAL CONFERENCE ON METEOROLOGICAL AND ENVIRONMENTAL INSTRUMENTS AND METHODS OF OBSERVATIONVI.AX-BAND OBSERVATION DATAX-band dual-pol Radar of Kinki area network(by MLIT)As shown in Figure 16, MLIT has installed 4 units of X-banddual-pol radars in Kinki Area. One of the radar installed inJyubusan is solid-state weather radar while the other three areKlystron weather radars.Rokko(El 0.1 )Tanokuchi(El 1.6 )(b) 2010/07/13 06:56Jyuubusan(El 0.4 )Figure 17.CKatsuragi(El 0.1 )Figure 16. X-band dual-pol radar of Kinki area network (MLIT)BRadar echo observed by the Solid-State dual-pol radar andKlystron dual-pol radarsComparison of observation data among the radars.Figure 18 shows the scatter diagram of precipitationintensity observed by each radar and TABLE III. shows thecorrelation coefficient of precipitation intensity among theradars.Observed results by X-band dualpPol RadarFigure 17 shows the result of two observational examplesobtained by these 4 radars. As shown, the results of radarobservation were very similar and no conspicuous differenceis found among the radars.(a) 2010/07/07 15:00Figure 18. Scatter diagram of precipitation intensity of solid-state andKlystron radars
TECO 2012 – WMO TECHNICAL CONFERENCE ON METEOROLOGICAL AND ENVIRONMENTAL INSTRUMENTS AND METHODS OF OBSERVATIONTABLE III. CORRELATION COEFFICIENT OF PRECIPITATION 98-Jyuubusan0.6800.7250.823As shown in TABLE III. , the correlation coefficients ofthe SSWR in Jyuubusan and the Klystron radar in Tanokuchiare the highest score (0.823) while the correlation coefficientsof the Klystron radars in Tanokuchi and Katsuragi are thelowest score (0.756).Generally speaking, the correlation coefficient of radars ishigher as the distance between sites is closer. Relationshipbetween the distance among the radar sites and the correlationcoefficient are shown in Figure 19.The correlation coefficients of the radar sites areapparently dependent on the distance among the radar sites. Itbecame evident that, the distance among the sites is shorter,the correlation coefficient is higher. In comparison with this,the difference of transmission system, whether it is solid-stateor Klystron, seems to have no impact on the results. This factendorses the conclusion that the observation by solid-stateradars is equivalent to that of the conventional Klystronradars.0.90Correlation coefficient0.85Jyuubusan vs. TanokuchiKatsuragi vs. Rokko0.80VII.CONCLUSIONTotal of 15 Solid-State Weather Radars have installed byTOSHIBA Corporation for actual operational use in Japan.Weather service is already provided to general public viaMLIT website. Observation data obtained by SSWR weremore satisfactory results compared with those of electrontube radars.We expect new Solid-State Weather Radar, which has thefeatures of compact size and light-weight design with its lowrunning cost and low spurious level, will be used in countriesall around the world.Rokko vs. TanokuchiKatsuragi vs. Tanokuchi0.75ACKNOWLEDGMENTSJyuubusan vs. Rokko0.70Jyuubusan vs. Katsuragi0.650.6020304050distance(km)6070Figure 19. Relationship between the distance among the radar sites and thecorrelation coefficientCFigure 20. Example of Rainfall Observation detected by X-band dualpol Radar (provided by MLIT)*The title of this page is written in Japanese. It says "X-band dual-polradar precipitation information. Under trial operation”Distribution of Observation Data through the webThe high-precision observation data obtained by X-bandSolid-State Weather Radar is distributed to public fordisaster prevention activities such as people to evacuatewhen torrential rainfall occurs after going through a varietyof processing together with observation data of other Xband dual-pol radars provided by MLIT (Figure 20).We would like to express our appreciation for theproviding X-band dual-pol observation data as a part ofactivities in "MLIT Technical Development Consortium” andC-band observation data provided by MRI-JMA.
TECO 2012 – WMO TECHNICAL CONFERENCE ON METEOROLOGICAL AND ENVIRONMENTAL INSTRUMENTS AND METHODS OF OBSERVATIONREFERENCESBringi, V.N., and Chandrasekar, V., 2001: PolarimetricDoppler Weather Radar: Principles and Applications,Cambridge University Press, pp 636.Gunn, R., and Kinzer, G. D., 1949: The terminal velocityof fall for water drops in stagnant air. J. Meteor., 6, 243–248.Hubbert, J., and Bringi, V.N., 1995: An iterative filteringtechnique for the analysis of copolar differential phase anddual-frequency radar measurements. J. Atmos. OceanicTechnol., 12, 643-648.Löffler-Mang, M., and Joss, J., 2000: An opticaldisdrometer for measuring size and velocity of hydrometeors.J. Atmos. Oceanic Technol., 17, 130–139.Marshall, R. E., and Palmer, W. McK., 1948: Thedistribution of raindrops with size. J. Meteor., 5, 165-166.Nakagawa, K., Hanado, H., Fukutani, K., and Iguchi, T.,2005: Development of a C-band pulse compression weatherradar. extended abstract, 32nd Conf. on Radar Meteorology,Albuquerque, U.S, Amer. Meteor. Soc., P12R.11.Savitzky, A.; and Golay, M.J.E., 1964: Smoothing andDifferentiation of Data by Simplified Least SquaresProcedures. Analytical Chemistry 36, 8, 1627–1639.Wada, M., Horikomi, J., and Mizutani, F., 2009:Development of solid-state weather radar. preprints, 34th Conf.on Radar Meteorology, Williamsburg, VA, U.S, Amer.Meteor. Soc., 12B.4.Yamauchi, H., Adachi A., Suzuki O., and Kobayashi T.,2012:Precipitation estimate of a heavy rain event using a Cband solid-state polarimetric radar, ERAD 2012, The 7thEuropean conference on radar in meteorology and hydrology.
TECO 2012 ΠWMO TECHNICAL CONFERENCE ON METEOROLOGICAL AND ENVIRONMENTAL INSTRUMENTS AND METHODS OF OBSERVATION Figure 5. X-band Solid-State Weather Radar TABLE II. SPECIFICATION OF X-BAND SOLID-STATE WEATHER RADAR INSTALLED IN MLIT Item Description Observation range 80 km or more in radius Frequency 9700 to 9800 MHz Pulse width 1 s to 32 s