Transcription
International Review of Research in Open and Distributed LearningVolume 16, Number 2April – 2015Perceived Usability Evaluation of LearningManagement Systems: Empirical Evaluation of theSystem Usability ScaleKonstantina Orfanou1, Nikolaos Tselios1, and Christos Katsanos2of Patras, Greece, 2Hellenic Open University, Greece and Technological Educational Institute of WesternGreece1UniversityAbstractPerceived usability affects greatly student’s learning effectiveness and overall learning experience,and thus is an important requirement of educational software. The System Usability Scale (SUS)is a well-researched and widely used questionnaire for perceived usability evaluation. However,surprisingly few studies have used SUS to evaluate the perceived usability of learningmanagement systems (LMSs). This paper presents an empirical evaluation of the SUSquestionnaire in the context of LMSs’ perceived usability evaluation. Eleven studies involving 769students were conducted, in which participants evaluated the usability of two LMSs (eClass andMoodle) used within courses of their curriculum. It was found that the perceived usability of theevaluated LMSs is at a satisfactory level (mean SUS score 76.27). Analysis of the results alsodemonstrated the validity and reliability of SUS for LMSs’ evaluation, and that it remains robusteven for small sample sizes. Moreover, the following SUS attributes were investigated in thecontext of LMSs evaluation: gender, age, prior experience with the LMS, Internet self-efficacy,attitude towards the Internet and usage frequency of the LMS.Keywords: Usability evaluation; educational software; system usability scale; SUS; learningmanagement system; LMS; e-learning227This work is licensed under a Creative Commons Attribution 4.0 International License.
Perceived Usability Evaluation of Learning Management Systems: Empirical Evaluation of the System Usability ScaleOrfanou, Tselios, and KatsanosIntroductionNumerous usability evaluation questionnaires designed to measure users’ subjective assessmentsof a system’s usability (i.e., its perceived usability) are available at the moment (Brooke, 1996;Lewis, 1991, 1992, 1995; Tullis & Albert, 2008; Tullis & Stetson, 2004). Possibly, the most widelyadopted is the System Usability Scale (SUS) (Brooke, 1996). This is mainly because it ischaracterized by a number of advantages.SUS is very short; it comprises only 10 items to be rated on a five point scale ranging fromstrongly disagree to strongly agree, among which five are positive statements and the rest arenegative. The small number of questions arises from Brooke’s (1996) goal to construct a ‘quickand dirty’ usability evaluation questionnaire. In addition, the SUS score is single and ranges from0 to 100. Therefore, its results can be comprehensible even to non-experts. Moreover, it has beenfound to be a remarkably robust measure of system usability (Bangor, Kortum, & Miller, 2008;Lewis & Sauro, 2009; Tullis & Stetson, 2004), even with a small sample size (Tullis & Stetson,2004). In addition, SUS can be used to assess the usability of any software system, device orservice. In other words, it is “technology agnostic” (Bangor et al., 2008). Another great advantageis that in contrast to other questionnaires, such as SUMMI, SUS is provided free of charge underthe only condition of the reference of the source.More and more teachers use LMSs to enhance their teaching methods (Torkzadeh & van Dyke,2001). Asynchronous education or distance learning helps teachers and learners to overcomelimitations of typical teaching such as space and time, and it also allows a personalized learningon the part of the learner. Thus, in recent years the interest is focused on web-based LMSs andusage of reliable usability evaluation questionnaires within LMSs should be considered as aneffective option. However, an initial literature review reported in the following contrasted theaforementioned suggestion; few studies report effective usage of instruments such as SUS. Itbecomes apparent that the study of LMSs’ usability is still at an early stage and the investigationof the SUS questionnaire within the context of LMSs’ usability evaluation is important.The goal of this paper is twofold: (a) to examine the applicability of the SUS method in the contextof the perceived usability evaluation of LMSs, (b) to investigate associations (if any) between SUSscore and students’ characteristics, and in specific gender, age, previous experience with the LMS,Internet self-efficacy, Internet user attitude, and LMS usage frequency.The paper is organized as follows: Initially, the research methodology, the profile of theparticipants and the LMSs (Moodle and Eclass, an open platform based on Claroline) which werethe subject of evaluation are presented. Subsequently, the research results are presented focusingon the investigation of SUS within LMSs. The implications of these results are also discussed.This work is licensed under a Creative Commons Attribution 4.0 International License.228
Perceived Usability Evaluation of Learning Management Systems: Empirical Evaluation of the System Usability ScaleOrfanou, Tselios, and KatsanosRelated WorkSUS and Perceived Usability Evaluation of ProductsSUS benchmark data.Bangor et al. (2008) conducted an extensive research studying the usability evaluation of variousproducts and services using the SUS questionnaire. Within a decade they gathered more than2,300 individual surveys from more than 200 studies. It was found that the mean SUS score was70.14 with a median of 75 (on a per study basis 69.69 and 70.91, respectively) and Cronbach’salpha was 0.91. Moreover, it was observed that no evaluated product received a score below 30,and fewer than 6% of study scores fell below 50.Bangor et al. (2008; 2009) also wanted to add an interpretation of the SUS score. To this end,they compared the quartiles of the SUS score and adjective ratings of perceived usability. Theyfound that if the SUS score is over 85 the system/product is highly usable, over 70 to 85 it ischaracterized from good to excellent, a value from about 50 to about 70 shows that the system isacceptable but it has some usability problems and needs improvement, and finally a system withSUS score below 50 is considered unusable and unacceptable.In a recent survey, Kortum and Bangor (2013) assessed the perceived usability of 14 commoneveryday products using the SUS questionnaire. Their aim was to provide practitioners andresearchers enough data (benchmarks) so that they would be able to characterize and presentresults of their own usability investigations. Surprisingly, e-learning platforms are neitherincluded in the categories of web products chosen nor in the nine additional product categoriesthat the authors mention that they would also study if they had the opportunity for a largerproduct list.SUS validity and reliability.Tullis and Stetson (2004) measured the usability of two websites using five different surveys,including the Questionnaire for User Interaction Satisfaction (QUIS), the SUS, the ComputerSystem Usability Questionnaire (CSUQ), and two vendor specific surveys, and found that the SUSprovided the most reliable results across a range of sample sizes. They reported that two of thequestionnaires, SUS and CSUQ, achieved this goal faster, extracting the correct conclusion (whichwebsite had superior usability) to over 90% of cases, when the sample size was between 12 and 14.This result implies that usability studies applying the SUS questionnaire could have reliableresults even with a small sample, as low as 12 participants.In addition, studies (Bangor et al., 2008, 2009) have found significant correlation (from r 0.806to r 0.822) between the SUS score and a 7-point adjective rating scale with different wordingsthat assessed the “user-friendliness” of the system; the worst rating was ‘worst-imaginable’,This work is licensed under a Creative Commons Attribution 4.0 International License.229
Perceived Usability Evaluation of Learning Management Systems: Empirical Evaluation of the System Usability ScaleOrfanou, Tselios, and Katsanoswhereas the best rating was ‘best-imaginable’. This association strengthens the validity of the SUSquestionnaire.SUS attributes.Bangor et al. (2008) examined the possible associations between gender or age and the final SUSscore in a subset of their dataset (N 213). They found a significant negative correlation betweenSUS score and age (r -0.203, p 0.03), but no significant difference between the mean SUS scoresobtained from women (mean 71.6) and men (mean 70.2).Sauro (2011) examined the influence of prior experience with a website on the users’ SUS scores.Using a large dataset from about 2,000 users who evaluated the usability of 62 websites and 16software products, he found that users with previous experience rate the websites and softwareproducts from 6% to 15% more usable than first-time users.In addition, Bangor et al. (2008) report that a one-way analysis of variance on the data referringto different type of devices (i.e., cell phones, customer equipment such as modems, GUIs,interactive voice response systems, and web pages/applications) showed that SUS scores do varysignificantly (p 0.001) by the type of interface being tested.SUS and Educational Software EvaluationIn the context of an e-learning platform evaluation, Renaut, Batier, Flory, and Heyde (2006)conducted a study in order to suggest how to use assessment methods based on observation andtest. Their aim was to detect usability problems and to cultivate knowledge of web developers ontheir end-users and user centered design. The platform used was SPIRAL, realized in LyonUniversity. The researchers used the SUS scale as a post-test assessment of the usability of theplatform. They found that 72% of the participating teachers described the platform as easy to use,but they do not cite specific SUS ratings. The overall conclusion of the study was that whileteachers seemed to positively assess the usability of the platform, they formed their own way ofusing the platform which was different from the one that was envisaged from the platform’sdevelopers.Ayad and Rigas (2010) evaluated three edutainment platforms in terms of user performance,learning effectiveness and satisfaction in order to explore usability aspects of educationalentertainment in e-Learning. The three platforms were Virtual Classroom, Game-based andStorytelling. The SUS questionnaire was employed to measure users’ satisfaction. The averageSUS scores for the three platforms were 75.3, 73.4 and 64.5 respectively. The Game-basedplatform was found to be the best in terms of user performance and overall learning experience.The SUS questionnaire was also used to assess the usability of the first version of the Topolorsystem (Shi, Awan, & Cristea, 2013). It is a Social Personalized Adaptive E-Learning Environment(SPAEE) and constitutes an attempt to combine social e-learning with adaptive e-learning. TheSUS score was 75.75 and Cronbach's alpha was found to be 0.85.This work is licensed under a Creative Commons Attribution 4.0 International License.230
Perceived Usability Evaluation of Learning Management Systems: Empirical Evaluation of the System Usability ScaleOrfanou, Tselios, and KatsanosMarco, Penichet, and Gallud (2013) proposed a way of remote collaboration in real time via theplatform Moodle. This method is based on the use of the tool Drag & Share, a collaborative toolwhich enables sharing and synchronization of files in real time. To evaluate the Drag & Share tool,the researchers asked a group of users to perform the same collaborative work in Moodle with andwithout the use of the tool. Subsequently, they compared their efficiency and satisfaction acrossthe two conditions. Efficiency was operationalized using the time taken for completion of workand user satisfaction was evaluated by the SUS questionnaire. SUS scores for the Moodle systemwith and without the tool Drag & Share were 89.5 and 46.75, respectively. These SUS scoresconfirmed the perceived usability of the tool proposed by the researchers.A recent study (Luo, Liu, Kuo, & Yuan, 2014) proposed a simulation-based learning system forinternational trade and used the SUS questionnaire to assess its perceived usability. Theresearchers studied the usability of the system and the opinions of the students that used it duringtwo semesters. They collected 49 and 24 valid completed surveys for each semester respectively.After the first semester, the SUS score was 58.1, which showed that the system neededimprovement. The researchers made some modifications to the system based on the collecteduser data and found that after the second semester the SUS score increased to 65.93. The usabilityof the system was improved, but there was still room for further improvement. In addition, at theend of the second semester nine teachers were interviewed and they were also asked to completethe SUS questionnaire. The SUS score was 74.45, indicating that the part of the system which isaddressed to the teachers was sufficiently usable. This finding also shows that students’ andteachers’ perceptions of LMS usage may vary (Emelyanova & Voronina, 2014).Simoes and de Moraes (2012) used SUS to evaluate the usability of the virtual learningenvironment adopted by the Distance Education Center of the Federal Institute of Espírito Santo– Brazil, which has the Moodle platform as a basis. They examined the usability of theenvironment from three different perspectives using three different methods of evaluation.Initially, they used the SUS questionnaire to assess users’ satisfaction, then they evaluated thedesign of the interface with the method of heuristic evaluation, and finally they evaluated theusability of the system by applying the method of cooperative evaluation. The sample size was 59users: students who attended the first semester’s course “Information Technology” and peoplewho were already using the environment for four months. All three methods unveiled that thevirtual learning environment had serious usability problems. The authors characterized the SUSquestionnaire as an effective tool for evaluating usability and users’ satisfaction. However, theydid not report the obtained SUS scores.Venturi and Bessis (2006) used SUS to evaluate the perceived usability of DELTA, a distributedlearning resources repository. The sample was 14 users who performed six tasks beforecompleting the SUS questionnaire. The authors state that usability tests were extremely effectivein discovering usability issues. However, no SUS scores are reported.In a case study (Granic & Cukusic, 2011), SUS was used among other usability evaluationtechniques to evaluate UNITE, an e-learning platform that supports education in 14 EuropeanThis work is licensed under a Creative Commons Attribution 4.0 International License.231
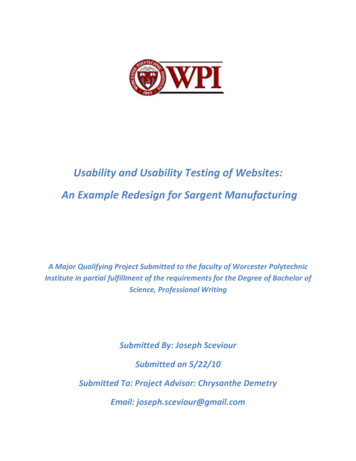
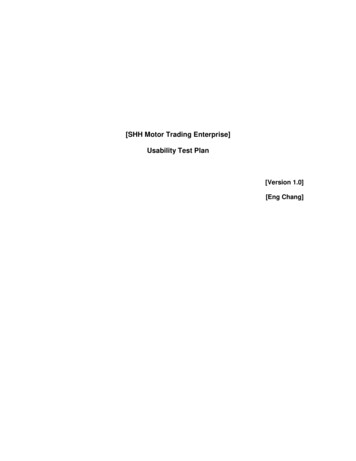
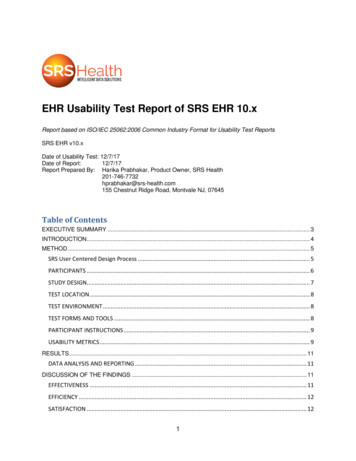
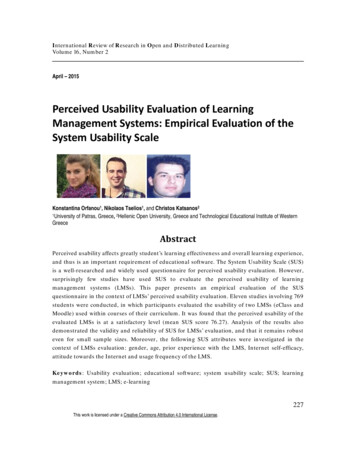
Perceived Usability Evaluation of Learning Management Systems: Empirical Evaluation of the System Usability ScaleOrfanou, Tselios, and Katsanossecondary schools with a total of 512 students and 46 teachers. The survey was conducted in nineschools and 47 students and 23 teachers participated. The average SUS score was 59.36 forstudents and 53.15 for teachers. They also found that there was a significant negative correlation(r -0.467, p 0.001) between the SUS score and students’ age, as it was also found in Bangor et al.(2008).MethodResearch DesignAll in all, 11 studies were carried out. In all studies, university students were asked to evaluate theperceived usability of their course’s Moodle-based LMS (Fig. 1) or eClass-based LMS (Fig. 2) bycompleting SUS. Moodle was selected because it constitutes a widely acceptable and globallypopular LMS solution. Eclass, an open platform based on Claroline, is the LMS solution used inthe University of Patras (and in most Greek higher education institutes) and it was selectedbecause: a) we had access to a wide variety of courses, and b) we wanted to have benchmark datafor its perceived usability. In all studies, participation was voluntary.Figure 1. The Moodle-based system for the course “Technologies of Information andCommunication in Education” (tenth study).This work is licensed under a Creative Commons Attribution 4.0 International License.232
Perceived Usability Evaluation of Learning Management Systems: Empirical Evaluation of the System Usability ScaleOrfanou, Tselios, and KatsanosFigure 2. The eClass-based system for the course “Digital Telecommunications” (second study).The provided questionnaire comprised SUS items as well as general demographics questions andquestions related to the participants’ internet self-efficacy (ISE) and internet user attitude (IUA).Already validated constructs were used to measure ISE and IUA (Papastergiou, 2010).Furthermore, students were asked to state whether they had prior experience with the LMSsystem used in their course (yes/no), and also rate on a 1 (not at all frequently) to 5 (veryfrequently) scale the usage frequency of their course’s LMS. Moreover, an adjective rating wasused to collect students’ ratings of the LMS perceived usability according to a 7-point adjectiverating scale (Bangor et al., 2009).Participants were presented with either the Greek (Katsanos, Tselios, & Xenos, 2012) or theEnglish (original) version of the SUS items based on their self-rated knowledge of English. Weprovided this option in an attempt to minimize potential threats to the validity and reliability ofSUS data obtained from non-native English speakers (Finstad, 2006). In our previous research(Katsanos et al., 2012), three studies involving 280 university students in both blended anddistance learning education were conducted. Analysis of the results demonstrated the validity andreliability of the Greek version of SUS in the context of Moodle evaluation. The questionnaire waspilot-tested in a preliminary study involving 63 students.Participants and ProceduresOverall, the 11 studies reported in this paper involved 769 university students of eight Universitydepartments, 487 female and 282 male, aged 18 to 52 (mean 21.78, sd 4.31). They reportedusing the Internet for 8.02 years (sd 2.94) on average. A total of 436 students completed theGreek version of the SUS questionnaire, whereas 333 students completed the English version ofSUS. In addition, 355 students had prior experience with the system used at their course. On a 1–5 scale, their mean self-reported LMS usage frequency was 3.81 (sd 0.99), their mean internetself-efficacy was 4.10 (sd 0.61) and their mean internet user attitude was 4.27 (sd 0.52). TheThis work is licensed under a Creative Commons Attribution 4.0 International License.233
Perceived Usability Evaluation of Learning Management Systems: Empirical Evaluation of the System Usability ScaleOrfanou, Tselios, and Katsanosdata collection process lasted thirty-four days, from 22 May to 9 June 2013 and from 30 Januaryto 13 February 2014, at the end of each semester and took place after the last lecture of the course.The characteristics of the sample per study are elaborated in Table 1.Table 1Overview of DatasetStudy NSubjectLMSGender AgeGR, EN Mean(female, (mean version LMSmale) sd)of SUS Internetattitude(sd)Priorexperiencewith LMS(yes, no)MeanInternetusage inyears (sd)165ElectricalMachines IeClass19female,46 male20 to 31 GR,3034 EN(21.85 2.60)3.58(1.07)4.42(0.56)4.45(0.45)57 yes, emale,39 male19 to 19 GR,2737 EN(23.27 1.69)3.18(0.74)4.42(0.57)4.34(0.53)48 yes, 8no9.77(3.00)354Zoology IeClass37female,17 male18 to 22 GR, 4.242532 EN (0.95)(18.65 1.18)3.88(0.68)4.01(0.51)18 yes, 36no7.28 (1.97)487DifferentialEquationseClass36female,51 male19 to 40 GR, 3.462747 EN (0.97)(21.43 1.72)4.19(0.54)4.19(0.53)59 yes, 28no8.11 (2.44)563Pharmaceuti eClasscalImmunology31female,32 male19 to 30 GR, 4.022933 EN (0.73)(21.14 1.93)3.96(0.62)4.23(0.42)43 yes, 20 8.38no(2.84)652Mathematics forChemistseClass39female,13 male18 to 27 GR,2225 EN(18.88 1.06)3.42(0.98)3.92(0.58)4.19(0.43)9 yes, 43no6.48(1.85)767MathematicsIeClass58female,9 male18 to 32 GR,3235 EN(18.99 2.14)3.51(0.84)3.97(0.59)4.17(0.47)21 yes, 46no7.19 (2.37)842ElectronicElements ofPowereClass7female,35 male21 to 15 GR,2627 EN(22.62 1.43)3.90(0.82)4.28(0.59)4.01(0.73)29 yes, 13no7.83 (2.31)This work is licensed under a Creative Commons Attribution 4.0 International License.234
Perceived Usability Evaluation of Learning Management Systems: Empirical Evaluation of the System Usability ScaleOrfanou, Tselios, and Katsanos952DecisioneClass22 to 23 GR,4529 EN(24.29 s3.31)3.54(0.92)4.31(0.56)4.25(0.50)41 yes, 11no8.88(2.09)10178ICT inEducationMoodle 174female,4 male19 to all48(178)(21.04 GR 4.28)4.37(0.86)3.95(0.53)4.34(0.50)5 yes, 173no6.56 (2.57)1153Methodolog Moodle 41y offemale,Educational12 maleResearch22 to 19 GR,5234 EN(30.38 7.43)3.68(1.12)4.11(0.66)4.60(0.44)25 yes, 28no10.89(3.80)All76911 subjects,8 Univ.Depart.18 to 4363.8152GR,(0.99)(21.78 333 EN 4.31)4.10(0.61)4.27(0.52)355 yes,414 no8.02(2.94)Theory9eClass,2Moodle28female,24 male487female,282maleResearch MaterialsThe Google Forms service was used to create and distribute the questionnaire for each study. Thecollected data were organized and preprocessed using Microsoft Excel 2010 and were analyzedusing IBM SPSS Statistics v19.0. The materials provided to the students through the eClass andthe Moodle system were organized according to each subject and were available to the studentsuntil the end of the semester (or the academic year).ResultsSUS within LMSsSUS benchmark data for LMSs.The SUS questionnaire is investigated within the context of assessing usability of LMSs. Table 2presents a summary of the data collected in the eleven studies evaluating perceived usability ofthe eClass and the Moodle LMSs. The number of students who completed each SUS version, themean and standard deviation of their SUS scores and perceived usability ratings are provided perstudy and across all studies. All SUS scores for the 11 studies are beyond the value of 72/100,therefore according to the criteria of Bangor et al. (2009) the usability of the evaluated LMSs is ata satisfactory level.This work is licensed under a Creative Commons Attribution 4.0 International License.235
Perceived Usability Evaluation of Learning Management Systems: Empirical Evaluation of the System Usability ScaleOrfanou, Tselios, and KatsanosTable 2Sample Size and Descriptive Statistics (SUS score, Usability Rating) in our DatasetStudyLMS1Students (N)SUS Score(0-100)MeanSD79.7313.31Usability Rating(1-7)MeanSD4.750.87eClassAll65Greek SUS31English 13.245.080.81AllSUS validity and reliability within LMSs’ evaluation.For the needs of the analyses, the negative statements of SUS (i.e. Q2, Q4, Q6, Q8, and Q10) wererecoded so that positive responses are associated with a larger number, like the rest five positivestatements. In all subsequent statistical analyses, we use the correlation coefficient r as an effectsize, which is calculated according to the formulas reported in Field (2009).The students’ SUS scores were compared to their overall adjective ratings of perceived usability,following the same approach used in a study (Bangor et al., 2009) within a different context. Anon-parametric measure of association was used (Spearman’s coefficient) since the assumption ofnormality was violated by both dependents; W(769) 0.979, p 0.001 and W(769) 0.849,p 0.001 respectively. A significant correlation between the SUS score and the overall adjectiverating was found; rs 0.525, p 0.01. This value is lower than the ones found by previous studies inexamining the usability of other systems; r 0.806 (Bangor et al., 2008), r 0.822 (Bangor et al.,2009), and r between 0.498 and 0.787 (Kortum & Bangor, 2013). However, moderatecorrelations with absolute values as small as 0.30 to 0.40 are considered (Nunnally & Bernstein,1994) large enough to justify the validity of psychometric instruments, such as questionnaires.This work is licensed under a Creative Commons Attribution 4.0 International License.236
Perceived Usability Evaluation of Learning Management Systems: Empirical Evaluation of the System Usability ScaleOrfanou, Tselios, and KatsanosThe values of the correlation between the overall adjective rating and the SUS score of the Greekand English language version of the questionnaire were rs 0.491, p 0.01 and rs 0.577, p 0.01,respectively. Furthermore, both language versions of the SUS had good internal consistency;Cronbach’s alpha 0.820 for the English version (N 333 surveys) and Cronbach's alpha 0.808for the Greek version (N 436 surveys).In addition, it was examined whether the SUS is reliable within LMSs even with a small-sizedsample. A similar process to that of Tullis and Stetson (2004), who studied usability of websites,was conducted. The context of websites can be considered a similar framework to e-learningplatforms, and can provide a basis for comparison. First, twenty sub-samples were randomlychosen for a sample size of 6, 8, 10, 12, and 14 participants. Next, for each sample size, thepercentage of 20 t-tests that yielded the same conclusion as the analysis of the full dataset (i.e.,the mean SUS score of the sub-sample did not significantly differ from the overall mean SUSscore) was calculated. Tullis and Stetson (2004) report that a sample of 12 to 14 users providesthe correct finding 100% of the time. In the present study, it was found that the SUS score of asample of 6 to 14 users does not differ from the total score at least 90% of the time.Investigation of SUS Attributes within LMSsAdditional analyses were conducted to investigate the following SUS attributes in the context ofLMSs’ evaluation: a) gender, b) age, c) prior experience with the LMS, d) Internet self-efficacy, e)attitude towards the Internet, and f) usage frequency of the LMS. The first three attributes havebeen previously investigated in the context of other products’ usability evaluation (Bangor et al.,2008; Granic & Cukusic, 2011; Kortum & Bangor, 2013; Sauro, 2011; Tullis & Stetson, 2004) andwe were interested to explore whether the reported findings are confirmed within LMSs’evaluation. To the best of our knowledge, the latter three SUS attributes have not been previouslyexplored in any evaluation context.Students’ gender and SUS score.Α two-tailed Mann-Whitney U test investigated the effect of students’ gender on their SUS score.A non-parametric test was selected because the SUS score distributions of both men and womendeviated significantly from the normal distribution; W(282) 0.976, p 0.001 and W(487) 0.980,p 0.001 respectively. Results showed no significant difference in SUS score between women(mean 76.30, sd 13.16) and men (mean 76.21, sd 13.40); U 68549.000, z 0.040, p 0.968.Comparing this result with the findings of previous research in a different context, it is consistentwith the research of Bangor et al. (2008).Students’ age and SUS score.A small, non-significant negative correlation was found between the SUS score and age ofstudents who evaluate the usability of LMSs; rs -0.061, p 0.09. Therefore, age does not seem tobe significantly associated with the perceived usability of a LMS, which is in conflict with previousstudies (Bangor et al., 2008; Granic & Cukusic, 2011). However, it is important to mention thatThis work is licensed under a Creative Commons Attribution 4.0 International License.237
Perceived Usability Evaluation of Learning Management Systems: Empirical Evaluation of the System Usability ScaleOrfanou, Tselios, and Katsanosthe range of students’ age in our dataset may not be varying enough; our participants had a meanage of 21.78 years and the 95% confidence interval for the mean was from 21.47 to 22.08 yearsold. Enriching our dataset with SUS scores from older adult students is required before providinga definitive answer on the association between students’ age and SUS score.Students’ prior experience with the LMS and SUS score.Α two-tailed Man-Whitney U test investigated the effect of students’ prior experience with theLMS on their SUS score. The assumption of normality was violated for both conditions.Thus anon-parametric test was applied; W(414) 0.979, p 0.001 and W(355) 0.974, p 0.001. Asignificant difference was observed (U 66467.000, z 2.289, p 0.022, r 0.08) in the evaluationof perceived usability of LMSs between users with prior experience with the system (mean 77.36,sd 13.37) and first-time users (mean 75.33, sd 13.06). This result is consistent with findings ofprevious studies in different evaluation contexts (Kortum & Bangor, 2013; Sauro, 2011).However, in the context of LMSs, students with prior experience score the perceived usability ofthe system averaged 2.12 percentage points higher (2.12%) than students with no priorexperience, while Sauro (2011), who examined usability in websites, found that users with priorexperience rate usability averaged 11% higher than first-time users.Students’ Internet self-efficacy and SUS score.A significant positive correlation was observed between the SUS score and Internet self-efficacy(Papastergiou, 2010) of students who evaluate the usability of LMSs; rs 0.326, p 0.01.Therefore, the more efficient on the Internet students feel, the higher perceived usability ratingsfor the used LMS they provide.In addition, we recoded our dataset to create two between-subject groups based on students’Internet self-e
This work is licensed under a Creative Commons Attribution 4.0 International Li cense. 231 . Marco, Penichet, and Gallud proposed(2013) a way of remote collaboration in real time via the platform Moodle. This method is based on the use of the tool Drag & Share, a collaborative tool which enables sharing and synchronization of files in real time.