Transcription
Line Laser and Triple LaserQuantification of the Differencein International RoughnessIndex Between Textured andNon-Textured StripsBernard Izevbekhai, Principal InvestigatorOffice of Materials and Road ResearchMinnesota Department of TransportationJuly 2017Research ProjectFinal Report 2017-28RESEARCH SERVICES & LIBRARY mndot.gov/research
To request this document in an alternative format, such as braille or large print, call 651-366-4718 or 1800-657-3774 (Greater Minnesota) or email your request to ADArequest.dot@state.mn.us. Pleaserequest at least one week in advance.
Technical Report Documentation Page1. Report No.2.3. Recipients Accession No.MN/RC 2017-284. Title and Subtitle5. Report DateLine Laser and Triple Laser Quantification of the Difference inInternational Roughness Index between Textured and NonTextured StripsJuly 20177. Author(s)8. Performing Organization Report No.6.Bernard Igbafen IzevbekhaiHyung Jun Ahn9. Performing Organization Name and Address10. Project/Task/Work Unit No.Minnesota Department of TransportationOffice of Materials and Road Research1400 Gervais Avenue, MS 645Maplewood, Minnesota 5510911. Contract (C) or Grant (G) No.12. Sponsoring Organization Name and Address13. Type of Report and Period CoveredMinnesota Department of TransportationResearch Services & Library395 John Ireland Boulevard, MS 330St. Paul, Minnesota 55155-1899Final Report14. Sponsoring Agency Code15. Supplementary Noteshttp:// mndot.gov/research/reports/2017/201728.pdf16. Abstract (Limit: 250 words)Practitioners have often wondered whether, during ride measurement with inertial devices, the motion of the laser through pavementtexture introduces non representative values of international roughness index (IRI), particularly in certain textures. In response to thisproblem, a special texture study created a non-textured strip by a recession of the middle 4 ft of a texturing broom dragged longitudinallybehind the paver. The study measured IRI and other surface properties in adjacent textured and non-textured strips by using a lightweightprofiler outfitted with a line laser and a triple laser arranged in tandem. IRI measurements were performed after sufficient concretestrength gain and repeated as soon as the joints were sawn. The same measurements were repeated after the joints were deployed.Results showed a significant difference between the IRI of a textured strip and that of a non-textured strip. Further analysis indicated that,although texture appears to affect IRI, this effect was amplified by the type of laser used, as the triple laser appeared to indicate higher IRIsin comparison with the RoLine laser. Although the RoLine is not a reference profiler for IRI values unaffected by texture, the prevalence ofthe RoLine and the triple laser in construction acceptance testing is sufficient reason to be concerned about the difference inherent in theobtained results. Chi-square and t-test statistical analysis showed that laser type induced comparable and even higher IRI anomalies thandid the experimental drag texture. In addition, the texture-induced IRI anomaly can be minimized by measuring smoothness for acceptanceat least 2 weeks after paving. There was no significant difference in pavement noise in terms of on board sound intensity (OBSI) betweentextured and non-textured strips. The friction numbers derived from the Dynamic Friction Tester indicated a correlation between the nontextured and textured strip friction numbers in each of the 6 sections. This indicated that the finishing process before texturing continuedto influence the microtexture even after the broom drag. This finding is limited to the texture types investigated. Therefore, extrapolationof these results to other textures should be done with caution due to anomalous laser –induced IRI on certain textures.17. Document Analysis/Descriptors18. Availability Statementconcrete pavements, texture, indexes (informationmanagement), sound intensity, friction, statistical analysisNo restrictions. Document available from:National Technical Information Services,Alexandria, Virginia 2231219. Security Class (this report)20. Security Class (this page)21. No. of PagesUnclassifiedUnclassified4122. Price
Line Laser and Triple Laser Quantification of the Difference inInternational Roughness Index Between Textured andNon‐Textured StripsFINAL REPORTPrepared by:Bernard Igbafen Izevbekhai, PE PhDHyung Jun Ahn, PhDOffice of Materials and Road ResearchMinnesota Department of TransportationJuly 2017Published by:Minnesota Department of TransportationResearch Services & Library395 John Ireland Boulevard, MS 330St. Paul, Minnesota 55155‐1899This report represents the results of research conducted by the authors and does not necessarily represent the views orpolicies of the Minnesota Department of Transportation. This report does not contain a standard or specified technique.The authors, the Minnesota Department of Transportation, do not endorse products or manufacturers. Trade ormanufacturers’ names appear herein solely because they are considered essential to this report because they are consideredessential to this report.
ACKNOWLEDGMENTSRobert Orthmeyer, Senior Pavement Engineer of Federal Highway Administration facilitated the uniqueoutfitting of MnDOT’s lightweight profiler with RoLine and triple laser to enable this research work.Steve Olson and John Pantelis of Minnesota Department of Transportation (MnDOT) facilitated on-sitetesting. The Project Contractors Messrs. Shafer Contracting Company accommodated our elaboratetesting process in the test section after they created the adjacent textured and non-textured stripswithin their already tight construction Schedule. The test section was created within an ongoing MnDOTpavement construction project on Interstate 35 in Duluth. The cooperation of MnDOT District 1 istherefore acknowledged.MnDOT Pavement Manager, Curtis Turgeon and Concrete Engineer, Maria Masten of the Office ofMaterials and Roads Research were the prime-movers of this research work.
TABLE OF CONTENTSCHAPTER 1: Introduction. 1CHAPTER 2: Experimental Design and Equipment . 32.1 Test Section . 32.2 Light Weight Profiler . 72.3 Circular Track Meter . 72.4 Locked-Wheel Skid Tester . 72.5 Dynamic Friction Tester, ASTM E 1911 . 82.6 On Board sound Intensity Tester . 9CHAPTER 3: Results and Analysis. 103.1 Smoothness . 103.2 Texture Configuration Properties . 153.3 Pavement Friction . 213.4 pavement Noise . 23CHAPTER 4: Statistical analysis of Effects of laser Type, Texture, Sawing, and Joint Deployment . 25CHAPTER 5: Conclusions and Recommendations . 315.1 Conclusions . 315.2 Recommendations . 32REFERENCES. 33
LIST OF FIGURESFigure 2-1 Location of test section on Interstate 35 near Duluth, MN (rd road). 4Figure 2-2 Circular Track Meter ASTM E-2157 . 4Figure 2-3 Lightweight Profiler used for pavement smoothness measurement . 5Figure 2-4 Textured and non-textured strips: (a) sample area of 1,000 ft and (b) close-up view ofadjacent strips . 6Figure 2-5 Dynamic Friction Tester (ASTM E 1911) used for friction evaluation in this project . 8Figure 2-6 On Board Sound Intensity Tester . 9Figure 3-1 IRI in pre saw, post saw, and post joint deployment . 13Figure 3-2 Difference in IRI between textures and non-textured strips . 14Figure 3-3 OBSI: (a) Non-textured Segment 1; (b) Textured Segment 1; (c) Non-textured Segment 2; (d)Textured Segment 2 . 24LIST OF TABLESTable 3-1 Presaw and postsaw test results for Triple Laser and RoLine . 11Table 3-2 Average IRI Presaw, Postsaw, and Postjoint Deployment . 12Table 3-3 Texture Test Results of Non-textured and Textured Strips at Stations 0 . 17Table 3-4 Texture Test Results of Non-textured and Textured Strips at Stations 100 . 18Table 3-5 Texture Test Results of Non-textured and Textured Strips at Stations 500 . 19Table 3-6 Texture Test Results of Non-textured and Textured Strips at Stations 600 . 20Table 3-7 Results of DFT (ASTM 1911) Friction Measurements . 22Table 3-8 Results of OBSI measurements . 23Table 4-1 Comparison of Significance of Texture and Laser Combinations . 27Table 4-2 t-Test results . 28
EXECUTIVE SUMMARYPractitioners have often expressed concern that, during ride measurement with inertial devices, themotion of the laser through pavement texture may introduce nonrepresentative values of internationalroughness index (IRI), particularly in certain textures. In response to this problem, a special texture studycreated a non-textured strip by a recession of the middle 4 ft of a texturing broom draggedlongitudinally behind the paver. The study measured IRI and other surface properties in adjacenttextured and non-textured strips by using a lightweight profiler outfitted with a line laser and a triplelaser arranged in tandem. IRI measurements were performed after sufficient concrete strength gain andrepeated as soon as the joints were sawn. The same measurements were repeated after the joints weredeployed. Results showed a significant difference between the IRI of a textured strip and that of a nontextured strip. Further analysis indicated that, although texture appears to affect IRI, this effect wasamplified by the type of laser used, as the triple laser appeared to indicate higher IRIs in comparisonwith the RoLine laser. Although the RoLine is not a reference profiler for IRI values unaffected bytexture, the prevalence of the RoLine and the triple laser in construction acceptance testing is sufficientreason to be concerned about the difference inherent in the obtained results. Chi-square and t-teststatistical analysis showed that laser type induced comparable and even higher IRI anomalies than didthe experimental drag texture. In addition, the texture-induced IRI anomaly can be minimized bymeasuring smoothness for acceptance at least 2 weeks after paving.There was no significant difference in pavement noise in terms of OBSI between textured and nontextured strips. The friction numbers derived from the Dynamic Friction Tester indicated a correlationbetween the non-textured and textured strip friction numbers in each of the 6 sections. This indicatedthat the finishing process before texturing continued to influence the microtexture even after thebroom drag. This finding is limited to the texture types investigated. Therefore, extrapolation of theseresults to other textures should be done with caution due to anomalous laser –induced IRI on certaintextures.
CHAPTER 1: INTRODUCTIONCertain pavement smoothness specifications had resulted in some undesirable riding conditions,including the chatter phenomena that could not be penalized because of the use of the profile indexesand blanking band filters. Other factors, such as anomalous ride quality resulting from certain textures,led the industry to inquire about the effects of texture on the ride. Furthermore, contractors hadexpressed concern that the zero blanking bands may result in strict penalties because the texture effectson ride measurement had not been quantified for a corrective algorithm. To address this issue, manyagencies changed from a 0.2 blanking band to a zero blanking band specification en route to aninternational roughness index (IRI) specification.A poll in 2000 showed that, above every other requirement, most people want smooth ridingpavements (1). From a value perspective, a study by Smith et al. (final report for NCHRP Project 1-31)correlated an increase in service life with various percentage improvements in ride quality (2). The studyshowed that some portland cement concrete sections in Alabama experienced increases of 11%, 28%,and 56%, respectively, in service life for 10%, 25%, and 50% increases in ride quality. Minnesota portlandcement concrete experienced 6%, 15%, and 30% increases in service life with the same respective ridequality improvements. Recent MnROAD reports show that smooth pavements remain smoother, andthe rate of deterioration of poorly riding pavements is higher than that of the smooth pavement (3).These data show that pavement smoothness should be a major infrastructure goal. To evaluatepavement performance through ride quality, one must ensure that measured ride quality is indicative ofactual pavement condition and that any error is quantified after the error source has been identified.Some of these sources of errors have been indicated in previous research work (4). Before 2003, theMinnesota Department of Transportation (MnDOT) specified ride quality in the 0.2-in. blanking band.This investigation created non-textured strips between Astroturf-textured finished strips on a pavingproject on US-212 trunk between the towns of Olivia and Bird Island. A lightweight profiler and aCalifornia profilograph were used to measure ride quality on each strip before and after jointestablishment. Results showed consistent deviation of 10 to 20 in./mile of IRI between the textured andnon-textured strips. The diamond-ground surface was consistently lower than the non-textured surface,by 5 in./mile. A ProVAL analysis of power spectral density showed a similar preponderance of highwavelengths attributed to joints and string lines but a myriad of low-wavelength features associatedwith texturing and the texturing process (4). Fortunately, with advancements in wave analysis andfrequency fragmentation as well as in mode decompositions, researchers are now better able toquantify roughness factors.A quest for a corrective algorithm for the effect of texture on IRI led to the development of a suggestedsoftware for optimizing texture–ride (4) that was superseded by the implementation of IRI in programdelivery as well as a combined IRI specification for construction acceptance (5, 6). Although a transitionwas made from profile index in program delivery to IRI, the challenge of the degree to which textureinfluences measured smoothness has not been fully solved. A lightweight profiler used in 2002 was, atthat time, equipped with a single laser (4). Later studies observed an anomalous difference between IRImeasured with point lasers and that measured by line lasers in the same profiler (7). Given the equal1
usage of line lasers and point lasers, a comprehensive evaluation of the effect of texture must includethe various types of lasers on adjacent textured and non-textured segments.In response to this problem, a special texture study was performed on Interstate 35 in July 2013, inDuluth Minnesota. This study which was performed in an identified test section on the interstatehighway during paving created a non-textured strip within the inverted turf dragged behind thefinishers. Subsequently, it measured IRI in the adjacent textured and non-textured strips using a lightweight profiler outfitted with the line laser and triple laser arranged in the line of the right wheels.Measurements were performed as soon as the lightweight profiler could ride on the concrete andmeasured again as soon as the joints were saw cut. The same measurements were repeated after thejoints were cut. Further measurements were conducted after the joints were deployed. Deployment ofjoints is contextually defined as the completion of the propagation of vertical cracks below the depth ofcut and (by implication) the commencement of aggregate interlock load transfer at that joint.Furthermore, pavement noise and surface friction were measured on textured and non-textured stripsutilizing on board sound intensity tester and friction tester (locked-wheel and dynamic), respectively.2
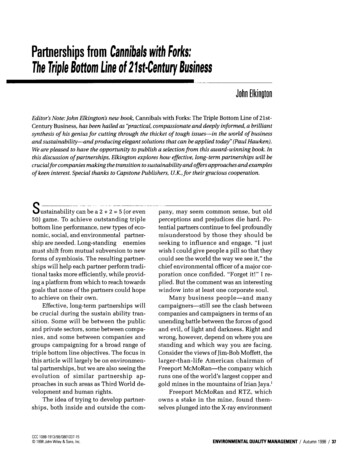
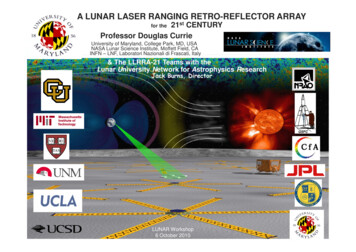
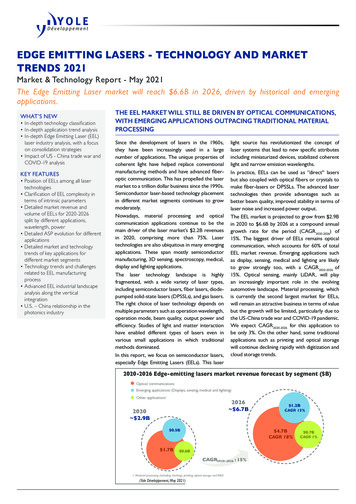
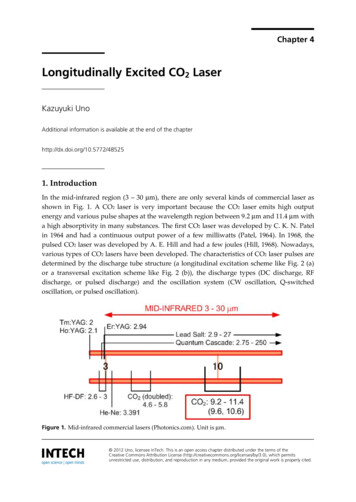
CHAPTER 2: EXPERIMENTAL DESIGN AND EQUIPMENT2.1 TEST SECTIONThe test section consisted of 1,005 ft of the outside lane on northbound Interstate 35 near Midway Roadin Duluth, Minnesota. The southern limit of the test section was approximately 96.4 ft from the northernlimits of the Midway Bridge approach panel on this Interstate highway, as shown in Figure 2-1. Thissection was part of a major project (SP 098-139) for construction of a new concrete pavement, whichconsisted of doweled concrete 10 in. thick with nonskewed joints at 15 ft intervals. The paving wasfollowed by finishing and broom-drag texturing. In the test section, the broom was indented at themiddle (between wheel paths) to create a non-textured strip 4 ft wide between two textured strips ofthat same width. Texturing was followed closely by the application of a uniform layer of alpha-methylstyrene curing compound. When sufficient strength gain had occurred in 8 hr, a lightweight profiler wasable to get on the pavement. The first set of smoothness measurements were conducted on thetextured strip as well as on the non-textured strip. The Minnesota DOT had equipped the lightweightprofiler with a tandem arrangement of the triple-laser accelerometer and the line-laser accelerometer,as shown in Figure 2-2. In this arrangement, the two accelerometers measured international roughnessindex (IRI) simultaneously followed by two repeat runs in each strip. Figure 2-3 amplifies line laser beamrays and triplepoint laser rays shown in Figure 2-2. These were the presaw ride measurements. FigureFigure 2-4 shows the adjacent textured and non-textured strips. The corresponding (presaw) ride filesare identified as mndotI35midwayDLpresawBWPnontxt (Runs 1 to 3).erd 5 ft from the centerline (CL) of theroad (non-textured) andmndotI35midwayDLpresawRWPtxt (Runs 4 to 6).erd 8 ft from the CL of the road (broomtextured).(The names and file extensions were chosen for continuity and easy access to a myriad of project andresearch files.)As soon as the transverse sawing was performed (3:00 a.m. the next day), longitudinal sawingcommenced and was completed at approximately 7:00 a.m. Joints were washed and cleaned of theexcess slurry. Another set of IRI measurements was taken on the textured and non-textured sections.Postsawing ride files were identified as mndotI35midwayDLpostsaw7.9.2013BWPnontxt (Runs 7 to 9) .erd 5 ft from the CL (nontextured) andmndotI35midwayDLpostsaw7.9.2013RWPtxt (Runs 10 to 12) .erd 8 ft from the CL of the road(textured)3
Figure 2-1 Location of test section on Interstate 35 near Duluth, MN (rd road)Figure 2-2 Circular Track Meter ASTM E-21574
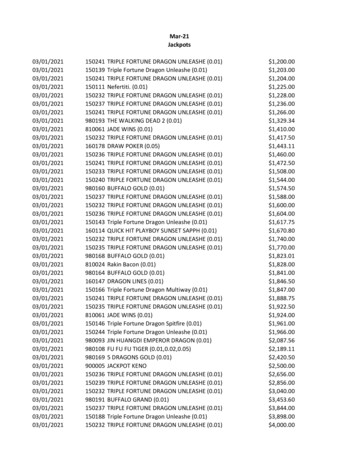
Figure 2-3 Lightweight Profiler used for pavement smoothness measurement5
(a)(b)Figure 2-4 Textured and non-textured strips: (a) sample area of 1,000 ft and (b) close-up view of adjacent strips6
2.2 LIGHT WEIGHT PROFILERTo evaluate the effect of texturing on ride measurement, the lightweight profiler was equipped withboth the RoLine (line) laser and the TriODS (triple) laser on the right-hand side. This arrangementfacilitated the simultaneous collection of ride data with two types of lasers. Ride was measured with theIRI. The IRI is based on the suspension algorithm of the quarter car traveling at 50 mph (8). Verticalacceleration of the quarter car is associated with displacements that are summed over the traveleddistance as in. per mile or meters per kilometer. IRI is neither a slope of the profile nor a summation ofslopes of elements of the profile but the average rectified value of the slope of the power spectraldensity. On the basis of the original intent for the quarter-car response to mimic the human response,the plot of IRI gain versus frequency is characterized by two peaks that emphasize axle hop (of theunsprung mass) and body bounce (of the sprung mass) (9).2.3 CIRCULAR TRACK METERTexture measurements were conducted with the circular track meter (ASTM E2157) so as to evaluatethe texture configuration associated with the textured and non-textured segments. The circular trackmeter uses a laser-displacement sensor with a charge-coupled device to measure the profile of a circle11.2 in. in diameter. The charge-coupled device is mounted on an arm that rotates 3.15 in. above thesurface. It is driven by a DC motor at a tangential velocity of 19.7 ft/min counterclockwise.Measurements were performed in accordance with ASTM E2157. Accordingly, three measurementswere made at each test cell location. The output data were segmented into eight 4.4-in. arcs of 128samples each. The precision for the given standard deviation of the eight measurements on the test cellis 0.001 in. Outputs given by the device are the texture depth [mean profile depth (MPD)] of the eightsegments. By using the software developed for opening the data from the circular track meter (Figure2), MPD is then reported.2.4 LOCKED-WHEEL SKID TESTERAt MnDOT, a locked-wheel skid tester, as specified by the American Society of Testing and Materials(ASTM E 274), is used. This device is towed behind a vehicle at a speed of 40 mph and measures theFriction Number (FN). The vehicle also carries a supply of water that is laid down directly in front of thetest tire to test the pavement when it is wet. When the locked-wheel skid trailer reaches the testingarea, a measured amount of water is applied to the pavement in front of the test tire; then the tire(ribbed or smooth) locks up, and the wheel is pulled along for a given length. During that period, itmeasures the amount of tractive force required to pull the trailer. The measured force is then sent to alaptop, which is stored inside the tow vehicle. Finally, the skid number or coefficient of friction can becalculated by taking the tractive force divided by the known wheel load and then multiplied by 100 (thisis done automatically as the test is being conducted).7
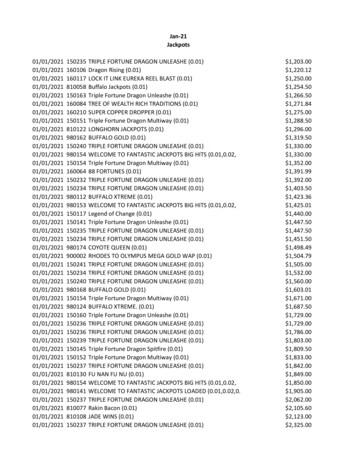
2.5 DYNAMIC FRICTION TESTER, ASTM E 1911The Dynamic Friction Tester (DFT) shown in Figure 2-5 consists of three rubber sliders, positioned on adisk of diameter 13.75 in, that are suspended above the pavement surface. When the tangential velocityof the sliders reaches 90 km/hr water is applied to the surface, and the sliders make contact with thepavement. A computer takes friction measurements across a range of speeds as the sliders slow to astop. A DFT value obtained at 20 km/hr, along with texture measurement provides a good indication ofInternational Friction Index (IFI).Figure 2-5 Dynamic Friction Tester (ASTM E 1911) used for friction evaluation in this project8
2.6 ON BOARD SOUND INTENSITY TESTERNear field noise measurement method usually obtain sound measurements while a vehicle is in motionusing microphone(s) positioned very close to the tire pavement interaction. OBSI equipment consists ofa Chevrolet Impala and eight four meters connected via four communication cables to a Bruel and Kjaerfront-end collector connected to a dell laptop computer. The intensity meters are mounted on a rigsystem attached to a standard reference test tire that is installed at the rear left side of the vehicle andmaintained at a temperature of 30 C. After recording temperature, four intensity meters were pluggedin to the B &K front-end unit, as well as 12v power supply and Ethernet (computer) cable. With thisarrangement, the unit is capable of measuring repeatable tire & pavement-interaction noise of the tirepavement contact-patch at a speed of 60 mph, thus measuring approximately 440 ft within 5 seconds. Itis mandatory to mount the rig on a non-dedicated vehicle and calibrate microphones. Durometerevaluation of the tire prior to measurement is also a required procedure, prior to data collection.Figure 2-6 On Board Sound Intensity Tester9
CHAPTER 3: RESULTS AND ANALYSIS3.1 SMOOTHNESSA gradual decrease in the difference between the IRIs of textured and non-textured strips is indicated bythe triple laser measurement (Table 3-1) from paving to joint deployment. Initially, before sawing, thatdifference was 10.5 in./mile, which became 7.5 in./mile after sawing. The reduction in the net effect oftexturing is attributed in part to changes in the megatexture and stress relief from built-in warp and curlattributable to joint sawing. After standard joint sawing to one-third the pavement thickness, the spacebeneath the joint is expected to crack to the slab bottom and provide load transfer through aggregateinterlock. This phenomenon is referred to as “joint deployment.” Although it can be accelerated byheavy equipment, such loads may cause uncontrolled cracking. Consequently, before traffic loading,shrinkage of the concrete and restraint of the base (or interlayer) facilitate joint deployment.However, crack propagation (joint deployment) seemed to have occurred fully 2 weeks after paving inthis test section. After joint deployment, a difference of 6.27 in./mile was observed. The RoLine in allcases exhibited a lower IRI value than did the triple laser. This difference justified the fact that thebridging of the texture asperities by a line laser may be more representative of a tire footprint that is notnecessarily affected by the texture asperities. Initially before sawing, RoLine showed an IRI difference of6.2 in./mile between textured and non-textured strips. After sawing, this difference became 6.43in./mile Crack deployment resulted in a difference of 3.37 in./mile Table 3-2 shows that the difference inIRI arising from sawing of the joints is almost insignificant in the RoLine but remarkable with the triplelaser. Examination of the actual IRI values showed that the triple laser started at 57 in./mile in the nontextured strip and decreased slightly to 56.47 in./mile after joints were sawed but changed to 57.8in./mile when the joints were deployed in the non-textured strip. These numbers are within the marginof error. In the textured strip, the triple laser started at 67.53 in./mile and decreased slightly to 63.97in./mile after joints were sawed but increased slightly to 64.07 in./mile when the joints were deployed.The RoLine started (presaw) at 57.0 in./mile in the non-textured strip and changed slightly to 57.5in./mile after joints were sawed but increased slightly to 63.93 in./mile when the joints were deployedin the non-textured strip. In the textured strip, the RoLine started (before sawing) at 63.2 in./mile andincreased slightly to 63.93 in./mile after joints were sawed and changed slightly to 62.17 in./mile whenthe joints were deployed. Figure 3-1 clarifies the information summarized in Table 3-2. Figure 3-2accentuates the IRI difference between textured and non-textured strips. The figure shows that lasertype and texturing were more influential to the changes than were the joints and the deployment.10
Table 3-1 Presaw and postsaw test results for Triple Laser and RoLineIRI (in./mile)Ride File NameTriple 064.001.60Mean67.5363.204.33Mean Difference (Textured -Non-textured)10.536.204.33mndotI35mid
The friction numbers derived from the Dynamic Friction Tester indicated a correlation between the non-textured and textured strip friction numbers in each of the 6 sections. This indicated that the finishing process before texturing continued to influence the microtexture even after the broom drag. This finding is limited to the texture types .