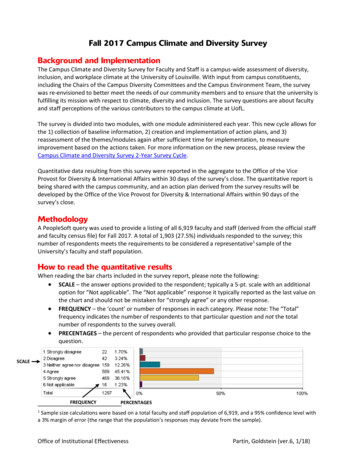
Transcription
Grant Agreement Number: 312251MIRRIMicrobial Resource Research InfrastructureSEVENTH FRAMEWORK PROGRAMMESP4-CapacitiesCombination of CP & CSAPREPARATORY PHASESFP7-INFRASTRUCTURES-2012-1Start Date of Project:Duration:01.11.201236 MonthsReport on MIRRI-User surveyVan Hauwenhuyse, F.; Hellemans, A.; Piessens, V.; Zuzuarregui, A.; Aznar, R.;Varese, G.C.; Perugini, I.; Prigione, V.; Le-Saux, M.; The MIRRI Consortium;
Report on MIRRI-User surveyTABLE OF CONTENTSTable of Contents . 21. Introduction. 42. Methodology . 53. Results . 63.1. Respondent profiles . 63.1.1. Country of origin (Q5). 63.1.2. Organization type (Q8-10) . 93.1.3. Field of Activity of the respondents (Q11: 1170 replies) . 103.1.4. Qualification level of user laboratory personnel (Q14-15) . 113.1.5. Quality Management Systems implemented by users (Q16) . 123.1.6. Use of Genetic Resources (Q12) . 143.1.7. Applications of genetic resources (Q13) . 173.1.8. Outsourcing of microbial analysis (Q17) . 183.2. Origin of the genetic resources used, and legal issues related to the CBD. 223.2.1. Origin of the genetic resources used (Q18) . 223.2.2. Awareness of and compliance with the Convention on Biological Diversity (CBD) (Q19-20,Q23) . 223.2.3. Problems in obtaining microbial/genetic resources (Q21-22) . 233.3. Use of the services currently offered by CCs . 273.3.1. Present and future use of services offered by CCs (Q24) . 273.3.2. Problems, gaps and shortcomings in the services currently offered by CCs (Q25-27) . 313.3.3. Training services (Q28) . 353.3.4. Information services (Q29-32) . 373.3.5. Collaborative projects with CCs (Q33-35) . 383.3.6. Comments of users on services (Q36) . 393.4. Commercial use of resources supplied by CCs . 403.4.1. Benefit sharing with CCs (Q37-38) . 403.4.2. Convention on biological Diversity (Q39-41) . 414. MAIN CONCLUSSIONS AND Recommendations . 445. References . 452
Report on MIRRI-User survey6. Annexes . 466.1. Annex 1: MIRRI-WP2 User questionnaire . 466.2. Annex 2: Statement on use, access and protection of collected data . 526.3. Annex 3: List of Culture Collections participating in the MIRRI preparatory phase project . 546.4. Annex 4: List of National Scientific Associations . 566.5. Annex 5: List of International Scientific Associations . 596.6. Annex 6: Overview “comments or other responses per question” (if applicable) . 606.6.1. Q11 “To which field of activity does your Laboratory unit belong ?” . 606.6.2. Q17 “Which microbial analyses does your laboratory unit outsource (to any third party,not necessarily to service Culture Collections) at present (the past five years), and/or intend tooutsource in the future (the next five years)? . 616.6.3. Q18 Where are the microbial/genetic resources that are used within your Laboratory unitsourced from? . 616.6.4. Q20 In case your Laboratory unit isolated microbial/genetic resources, did it ask PriorInformed Consent (PCI) from the appropriate authority in the country of origin of the sample,according to the CBD? . 626.6.5. Q22 Specify for each of the subjects in which you experienced problems in obtainingmicrobial/genetic resources, the nature of the problem. 656.6.6. Q23 Do you have additional comments to share about the origin of microbial/geneticresources that your Laboratory unit uses and/or legal issues related to the CBD ?. 836.6.7. Q24 Indicate which services you ordered from Culture collections in the past five years,and which ones you intend to order from Culture collections in the next five years. . 846.6.8. Q26 In case you have indicated ‘because of gaps’ for any of the services in the previousquestion, describe these gaps in a few words in the corresponding textbox(es). . 856.6.9. Q27 In case you have indicated “because of other shortcomings’ for any of the services,describe these shortcomings in a few words in the corresponding textbox(es). . 856.6.10. Q28 In case you would use the training service in the next five years, what kind oftraining program(s) would be useful for your laboratory unit? . 876.6.11. Q29 On which subjects do you expect to receive information from the CultureCollections, with respect to the biological material offer? . 876.6.12. Q31 In case the culture collection presents information on its biological material online,which tools would you like to see implemented ? . 876.6.13. Q32 What kind of information, linking the phenotype of the biological material to itsgenotype, is of relevance for your work?. 883
Report on MIRRI-User survey1. INTRODUCTIONObjectives of the survey: Gather information on current and potential users of mBRCsDefine users’ general needs and expectations regarding preservation of genetic resources1(GR), supply of GR of related data and servicesIdentify the problems encountered by users in depositing their GR and/or in obtaining GR,related data or servicesAssess potential gaps in the offer of GR, data or related services offered by public culturecollections (CCs)Assess the awareness of and compliance to the Convention on Biological Diversity and legalissues related to the Access to GR and the Sharing of Benefits resulting from their (commercial)useTarget groups of the survey: The current users of GR and/or associated data and services.The potential users of GR and/or associated data and -----Culturable organisms (e.g. micro-organisms, plant, animal and human cells), replicable parts of these (e.g.genomes, plasmids, viruses, cDNAs), viable but not yet culturable organisms, cells and tissues.Description taken from the OECD consensus report “Biological Resource Centres: underpinning the future of lifesciences and biotechnology” (OECD, 2001)14
Report on MIRRI-User survey2. METHODOLOGYAn online survey consisting of 41 questions was set up in English (Annex 1). To assist respondents,translated PDF versions of the questionnaire were also made available online in Spanish, Italian, Frenchand Russian, but responses were collected in English only. Respondents participating in the surveywere given the choice whether or not to answer the questionnaire anonymously, but they had to agreewith the terms laid down in the MIRRI Statement on Use, Access and Protection of Collected data(Annex 2).To reach the respondents, the MIRRI partners and collaborating parties (34 CCs from 17 countries,Annex 3), were asked to provide the link to the online questionnaire to their customers of at least thepast seven years. In addition, 69 national scientific associations in 31 European countries (Annex 4)and 7 international scientific associations (Annex 5) were asked to request their members to respondto the online survey. The European Federation of Biotechnology (EFB) was also involved to reachpotential users by including a link on the EFB homepage to the MIRRI webpage referring to the onlinequestionnaire.The online questionnaire was initially accessible for 42 days (April 9th until June 21st, 2013) during which1146 valid responses were received, i.e. the respondent answered a minimal number of questions.The questionnaire was then reopened (January 21st until June 27th) together with the launch of theInnovative Services survey. 48 additional responses from this second round brought the total numberof valid responses to 1194. The survey was fully completed by 870 respondents (72.8%), whereas 324of the replies (27.1%) were incomplete but valid and therefore taken into account for the analysis.Chapter 3 of this document presents a summary of the received responses.No data was gathered on the numbers of users reached by each distribution channel (mailings tocurrent CC users or members of microbiological associations, or the EFB or MIRRI website).Consequently, a total response rate and response rate per distribution channel could not be calculated.The general information section of the questionnaire (Annex 1), identifying the user, was skipped by894 respondents (74.9 %) and classified as anonymous replies, whereas 300 respondents (24.6 %)provided personal contact details and information on their function, organization, and laboratory unit.Hence, this latter group of users, 233 from the non-profit sector and 67 from the profit sector, can becontacted again for additional information on their laboratory unit’s needs and expectations, and torepresent the user community in the future development processes of MIRRI.5
Report on MIRRI-User survey3. RESULTSThe percentages given in this summary report are calculated based on the number of respondents perquestion and not the total number of respondents of the survey, unless stated otherwise.It is important to realize that respondents were given the opportunity to skip questions during thequestionnaire, which explains the different total number of respondents for different questions.If respondents were allowed to select several options that apply, this is indicated as “multiple answers”.3.1. Respondent profiles3.1.1. Country of origin (Q5)All respondents represented 61 different countries. The majority of these respondents (81%)originated from 29 European countries (including the Russian Federation), while 29% of the responsescame from 32 countries from outside Europe.Table 1 shows the distribution of the 967 respondents from the 29 European countries (including theRussian Federation). Of all respondents, 870 (72.9 %) originated from the host countries of one or moreCCs that participate in the MIRRI preparatory phase project as a full partner (bold) or as a collaboratingparty, and 95 (7.9 %) originated from thirteen other European countries without MIRRI partners orcollaborating parties.6
Report on MIRRI-User surveyTable 1. Number of respondents and list of CCs collaborating in MIRRI1 from European countries and theRussian Federation (1CCs that are full partners in MIRRI are in bold. See Annex 3 for full name and details ofCCs collaborating in the MIRRI preparatory phase.)Number of% of totalList of CCs collaborating in the MIRRICountryrespondents respondentspreparatory phase projectSpain27022.6CECTGermany13010.9DSMZ, SAGItaly877.2MUT, ICLC, ITEM, DBVPGPortugal826.9MUM, PYCCCIP-CRBIP, CIRM-BIA, CIRM-BP, CIRM-CF, CIRMFrance625.2CFBP, CIRM-LevuresUK524.4CABI, NCIMBThe Netherlands463.8CBSBCCM-LMG, BCCM-IHEM, BCCM-LMBP, BCCMBelgium433.6MUCLCzech sian Federation171.4VKM, 7VTTCCHungary70.6NCAIMTurkey70.6Poland70.6IAFB, PCMNorway60.5Greece60.5ACA-DC, bia10.1Latvia00.0MSCLResponses from 2996781.0countries7
Report on MIRRI-User surveyTable 2 shows the distribution of the 224 respondents (19 %) from 32 countries outside Europe: 98from Asia, 91 from the Americas, 14 from Africa, and 11 from Australia and Oceania.Table 2. Number of respondents from countries outside EuropeNon-EuropeanNumber of% of totalRegion or continentcountriesrespondentsrespondentsUnited AsiaAustralia90.8Australia & OceaniaSouth icaMexico50.4South-AmericaSingapore50.4AsiaNew Zealand30.3Australia & hile20.2South-AmericaEgypt20.2AfricaSaudi livia10.1South-AmericaCosta Rica10.1South-AmericaCôte .1AsiaIran10.1AsiaUnited ArabAsiaEmirates10.1Responses from2241932 countries8
Report on MIRRI-User survey3.1.2. Organization type (Q8-10)The non-profit sector accounted for 910 respondents (76.3 %), of which the majority were academics(60.3 %) or from research institutes (33.7 %), whether or not in combination with (an)other type(s)(Table 3) while control or Reference analyses laboratories (7.3 %), Hospitals (4.7 %), Schools (1.3 %)and Foundations (1.3 %) were less represented. Other organization types mentioned by therespondents were e.g. governmental and international research institutes, associations, and biologicalresource, education or technical centres.The profit sector accounted for 282 respondents (23.7 %), of which the majority represented small tomedium size enterprises, corresponding to 10.0 % of all respondents. Large enterprises and microenterprises represented 8.4 % and 5.1 % of all respondents, respectively.Table 3. Number of respondents per organization type (non-profit sector) or per size (profit sector)(multiple answers allowed)SectorNon-profitAnswered: 907ProfitAnswered: 282Number ofrespondents% withinsector% of allrespondents (N 1189)University54660.345.9Research Institute30533.725.7Control or Reference analyses 31.0Foundation121.31.0Small to Medium size enterprise (10-250employees)11942.210.0Large enterprise ( 250 employees)10135.88.5Micro-enterprise ( 10 employees)6222.05.2Organization type(s)1 (non-profit) or size ofthe enterprise (profit)9
Report on MIRRI-User survey3.1.3. Field of Activity of the respondents (Q11: 1170 replies)When asked for their respective field of activity, respondents were allowed to check multiple answersand most of the respondents made use of this option. Overall, the top five fields of activity of therespondents was (Figure 1):1.2.3.4.5.Research & education (56.8 %)Food & feed (19.9 %)Environment (18.5 %)Pharma & medical (16.0 %)Agronomy (12.2 %)A clear difference in the fields of activity was observed between non-profit and profit respondents.Within the non-profit user group, research & education (67.2 %) was the major field of activity,followed by environment (19.1 %) and food & feed (15.3 %). The veterinary and chemical fields wereleast represented with 5.1 % and 3.9 % of non-profit users, respectively. Other activities mentioned bythe non-profit respondents included e.g. (bio)engineering, biotechnology, epidemiology, genetics,water control, and statistics.Within the profit user group, activities were more diverse, but the most represented fields were food& feed (34.9 %) and pharma & medical (32.4 %). Other categories mentioned by the profit respondentswere e.g. cosmetics, nanotechnology, production, bio-deterioration, biotechnology, mining andminerals, gas and oil, and textile (Annex 6 gives an overview of all responses).Figure 1. Field of activity of the respondents (Q11)answered: 1170Multiple answersResearch & Education23,419,915,3Food & Feed18,519,116,216,010,9EnvironmentalPharma & MedicalAgronomyOther on56,867,234,932,412,211,315,1% within all respondents (N 1170)% within non-profit (N 892)% within profit (N 278)11,211,95,65,17,6Veterinary0102030405010607080
Report on MIRRI-User survey3.1.4. Qualification level of user laboratory personnel (Q14-15)In non-profit laboratory units, the GR are handled by staff with a university or a PhD degree (Figure 2).In profit laboratory units, the GR are handled mostly by staff with a University degree (Figure 2) orLaboratory technicians (Figure 2). In about half of laboratory units, both non-profit and profit, themain qualification level of the staff was a university degree (Figure 3).For 37.6 % of non-profit users, staff with a PhD degree was the largest group within the laboratoryunit, which is more than for profit, where staff with a PhD predominates in 20.9 % of laboratory units.Conversely, more profit users indicated that laboratory technicians make up the largest group withintheir unit (Figure 3). For both sectors only in few units the material is handled by personnel withouttraining in microbiology, and in virtually none of the units people without training in biologypredominate.Figure 2. What are the qualification level(s) in microbiology of thelaboratory staff handling the microbial/genetic material in yourlaboratory unit? (per sector) (Q14)Answered: 1167Multiple answersPhD degree76,982,758,379,379,977,5University degree58,456,963,4Laboratory technician% within non-profit (N 891)4,64,74,33,23,71,4No training in microbiologyOther (specify)020%within all respondents (N 1167)% within profit (N 276)40601180100
Report on MIRRI-User surveyFigure 3. Which one of the mentioned qualification levels dominatesin your laboratory unit? (per sector) (Q15)Answered: 1170Multiple answers48,548,349,1University degreePhD degree20,915,511,5Laboratory technician33,737,6% within all respondents(N 1170)% within non-profit (N 893)28,21,11,30,41,31,21,4Other (specify)No training in microbiology010% within profit (N 277)20304050603.1.5. Quality Management Systems implemented by users (Q16)In total, 739 respondents (67.0 %) declared to have a QMS in their laboratory unit (Figure 4) and mostof them related to activities in microbiology.The implementation of QMS differed greatly between sectors (Figure 5A). A higher proportion of nonprofit users did not have a QMS (39.1 %). For those that had one, GLP (30.9 %) was most common,followed by a QMS not assessed by a third party (14.4 %) and ISO 9001 (12.1 %). In contrast, only 13.9% of profit users did not have a QMS in place, and the standards applied mostly were ISO 9001 (39.7%), GMP (24.0 %) and GLP (20.2 %). Figure 5B illustrates the proportion of the different systems thatare related to activities in microbiology per sector. Other standards mentioned by respondents wereISO 13485 (9), ISO 15189 (3), ISO 22000 (2), and ISO 17043 (1).12
Report on MIRRI-User surveyFigure 4. Which quality management system (QMS) is in place at yourlaboratory unit? Is it related to activities in microbiology? (Q16)Answered: 1103multiple answersNo QMS in the laboratory33,022,6Good Laboratory Practice (GLP)23,3ISO 900118,811,2QMS not assessed by Third Party (nocertification or accreditation)28,314,111,1% in place11,49,2ISO 17025Good Manufacturing Practice (GMP)6,2ISO 140002,6% related to activities inmicrobiology9,75,30,30,2ISO Guide 3405101520253035Figure 5A. Which quality management system (QMS) is in place at yourlaboratory unit? (per sector) (Q16)Answered: 1103multiple answersNo QMS in the laboratory39,113,9Good Laboratory Practice (GLP)20,2QMS not assessed by Third Party (nocertification or accreditation)30,914,413,112,1ISO 90019,7ISO 1702539,72,2ISO 14000% within profit (N 267)16,95,1Good Manufacturing Practice (GMP)% within non-profit (N 836)24,015,00,40,0ISO Guide 340102030134050
Report on MIRRI-User surveyFigure 5B. Which quality management system (QMS) is related toactivities in microbiologie? (per sector) (Q16)Answered: 1103multiple answersNo QMS in the laboratory26,610,1Good Laboratory Practice (GLP)25,117,6QMS not assessed by Third Party (nocertification or accreditation)11,59,7ISO 170257,8ISO 90017,513,91,0ISO 14000% within profit (N 267)22,53,0Good Manufacturing Practice (GMP)% within non-profit (N 836)16,17,90,20,0ISO Guide 340510152025303.1.6. Use of Genetic Resources (Q12)Figure 6 shows the distribution of different types of GR used by respondents: mostly used in the pastfive years were bacteria (85.3 %), yeasts (42.3 %) and filamentous fungi (40.4 %). For these three GRtypes, respondents indicated a general decrease in use for the next five years, -17.8 % for bacteria and-5.9 % for both fungi and yeasts (Table 5). Also for other commonly used resources ( 15 %), such asgenomic DNA (-5.3 %), plasmids (-4.7 %), animal cell lines (-2.3 %) and human cell lines (-1.8 %), adecrease in use in the future was indicated by the respondents. The reason for this indicated declinewas not asked and therefore currently unknown.In contrast, for the less commonly used GR a slightly increased use was indicated for the future:Archaea ( 2.4 %), viruses (animal, plant, and human) ( 1.5 %), Cyanobacteria ( 1.2 %), and microalgae ( 0.5 %), Although these increases are small, a minor “shift” towards the less commonly usedGR types can be expected in the future based on these numbers.Other used GR mentioned by respondents were nematodes, plants, mites, and specific types of fungior bacteria (e.g. mycorrhiza, anaerobes, phyto- and mycoplasma, Actinobacteria).14
Report on MIRRI-User surveyFigure 6. Which kind of microbial/genetic resource(s) does yourlaboratory unit use at present, and/or might use in the future? (Q12)Answered: 1172Multiple 327,6YeastsFilamentous fungiGenomic 1,7Cell lines humanCell lines animalArchaeaPhagesMicro-algaeCyanobacteriaViruses humanViruses animalProtozoaViruses plantsHybridomas animalCell lines plantsLichensHybridomas human020% used in the past five years% intend to use in the next fiveyears40608015100
Report on MIRRI-User surveyTable 5 Change in use of genetic resource users over time (difference between use in the past five years andthe next five years)Difference between number of users atpresent and in the futureGenetic resourcenumber of users%Bacteria-209-17.8Filamentous fungi-69-5.9Yeasts-69-5.9Genomic DNA-62-5.3Plasmids-55-4.7Cell lines animal-27-2.3Cell lines human-21-1.8Hybridomas animal-6-0.5Protozoa2 0.2Phages3 0.3Viruses human4 0.3Lichens5 0.4Cell lines plants5 0.4Hybridomas human5 0.4Micro-algae6 0.5Viruses animal6 0.5Viruses plants7 0.6Cyanobacteria14 1.2Archaea28 2.416
Report on MIRRI-User surveyThe past five years, especially yeasts and fungi were used relatively more by profit than by non-profitsector, in contrast with genomic DNA, plasmids, Archaea and phages, which were used relatively moreby non-profit (Figure 7). Decreasing and increasing trends in use of the different GR over time wasmostly similar for both sectors (not shown).Figure 7. Which kind of microbial/genetic resource(s) does your laboratoryunit use at present (the past five years)? (per sector) (Q12)Answered: 1172multiple answers84,887,0BacteriaGenomic DNA24,2Yeasts43,638,837,3Filamentous fungiPlasmidsCell lines humanCell lines rotozoaViruses humanViruses animalViruses plantsHybridomas animalCell lines plantsLichensHybridomas human020% within non-profit (N 895)% within profit (N 277)4060801003.1.7. Applications of genetic resources (Q13)The applications for which the GR were used considerably differed between the non-profit and profitsector (Figure 8): for the non-profit sector, the main applications were fundamental research (76.5 %),R&D (61.6 %) and teaching or training (48.6 %), whereas the profit group applied GR mostly for R&D(72.0 %), quality control (45.5 %) and commercial applications (43.6 %).17
Report on MIRRI-User surveyFigure 8. For which application(s) does your laboratory unit use microbial/genetic resources at present,and/or might use in the future? (Q13)Answered: 1167Multiple answers3.1.8. Outsourcing of microbial analysis (Q17)Figure 9A shows the relative differences between both profit and non-profit respondents thatoutsource particular microbial analyses to any third party (not necessarily to a CC). The analyses mostlyoutsourced are DNA sequencing (65.5 % non-profit and 43.0 % profit) and identification (40.7 % nonprofit and 54.2 % profit). Other analyses outsourced by over 20 % of non-profit users were isolation ofpure cultures, microbial count, whole genome/gene sequence analysis, real-time PCR and phenotypiccharacterization. Most analyses are outsourced relatively more by non-profit users, except formicrobial count and isolation of pure cultures.Other outsourced analyses that were mentioned by respondents included fluorescence microscopy,cloning, sequencing of large DNA fragments, MLVA/MLST, G C content analysis, antibody production,and sensitivity testing (Annex 6, 6.6.2). These analyses may represent potential gaps in the analysismethods offered by service CCs.18
Report on MIRRI-User surveyFigure 9: Which microbial analyses does your Laboratory unit outsource at present, and/or intend tooutsource in the future? (Q17)19
Report on MIRRI-User surveyOverall, the respondents checked more analyses they outsourced in the past five years (N 4953),than they intend to outsource in the next five years (N 4300). For most of the analyses listed, thefigures generally show less outsourcing in the future for both sectors, with some exceptions. The nonprofit group indicated to increase outsourcing of RNA sequencing ( 2.4 %), whole genome sequencedata analysis ( 1.6 %), metabolite production ( 1.5 %) and –omics related services ( 0.5 %) (Table 6).In contrast to this trend in the non-profit sector, the profit sector indicated to decrease the outsourcingof whole genome sequence data analysis (-6.8 %) and RNA sequencing (-1.2 %) in the future. On the20
Report on MIRRI-User surveyother hand, profit users intend to increase outsourcing of enzyme production ( 3.2 %), –omics studies( 2.4 %), fatty acid profiling ( 2.0 %), DNA-DNA hybridization ( 1.2), pathogenicity tests ( 1.2 %),phylogenetic studies ( 0.8 %), plasmid profile analysis of bacteria ( 0.8 %) and metabolite production( 0.8 %).Table 6: Change in outsourcing of microbial analyses over time (difference per sector betweenoutsourcing in the past five years and the next five years)Outsourced analysesDifference in % of users at present and in the future% Non-profit users% Profit users(N 792)(N 249)RNA sequencing2.4-1.2Whole genome sequence data analysis1.6-6.8Metabolite production1.50.8-omics0.52.4Real-time PCR0.1-0.8Enzyme production-2.73.2Fatty acid profile (FAME-MIDI)-2.92.0DNA-DNA hybridization-4.21.2Pathogenicity tests-1.11.2Phylogenetic studies-2.10.8Plasmid profile analysis of bacteria-0.40.821
Report on MIRRI-User survey3.2. Origin of the genetic resources used, and legal issues related to the CBD3.2.1. Origin of the genetic resources used (Q18)Respondents indicated that the main source of GR used was the organization itself (rating average of2.3 between “about half” and “most”) (Table7). This was the case for both the non-profit and theprofit sector, although the profit users rated service collections nearly as important as isola
translated PDF versions of the questionnaire were also made available online in Spanish, Italian, French and Russian, but responses were collected n English onlyi . Respondents participating in the survey were given the choice whether or not to answer the questionnaire anonymously, but they had to agree
