Transcription
2018Energy PriceReport
2018ENERGY PRICE REPORTDirectorate:Energy Data Collection, Management and AnalysisCompiled by:Mr Modisane Motiang modisane.motiang@energy.gov.zaSupervised by:Mr Ramaano Nembahe ramaano.nembahe@energy.gov.zaPublished by:Department of EnergyPrivate Bag X96Pretoria0001Tel: (012) 406-7540192 Visagie Street, c/o Paul Kruger & Visagie Street, Pretoria, 0001Website: http://www.energy.gov.zaEnquiries: publications@energy.gov.zaEnergy Price Report - 20181
DEPARTMENT OF ENERGYDirector-General: Mr T ZuluENERGY POLICY AND PLANNING BRANCHActing Deputy Director-General: Mr T AudatENERGY PLANNING CHIEF DIRECTORATEActing Chief Director: Ms Z HarberENERGY DATA COLLECTION, MANAGEMENT AND ANALYSIS DIRECTORATEDirector: Ms V OlifantDISCLAIMER:WHEREAS THE GREATEST CARE HAS BEEN TAKEN IN THE COMPILATION OFTHIS PUBLICATION, THE DEPARTMENT OF ENERGY RELIES ON DATA PROVIDEDBY VARIOUS SOURCES AND DOES NOT HOLD ITSELF RESPONSIBLE FOR ANYERRORS OR OMISSIONS EMANATING AS A CONSEQUENCE OF PROVISION OFINACCURATE, INCORRECT OR INCOMPLETE DATA FROM SUCH SOURCES.COPYRIGHT RESERVED2Energy Price Report - 2018
FOREWORDIt gives me a great pleasure to introduce the 2018 edition of the Energy Price Reportfor South Africa. The Energy Price Report is based on the information collated fromgovernment departments, state-owned-entities, oil and gas industries. This publicationcovers a broad overview and analysis of the South African energy prices and aims to keepstakeholders informed about energy prices and key issues affecting the energy industry.This edition presents energy prices data in a format which provides an overall picture ofmonthly and annual trends for common energy carriers used in South Africa. In order toclearly present and analyse the energy pricing trends, this report is divided into four mainfocus areas: Petroleum; Natural Gas, Coal; and Electricity.I extend my most sincere thanks and appreciation to the Energy Data Collection,Management and Analysis Directorate for the hard work that went into the compilationof this publication. I would also like to express my appreciation to all the energy dataproviders who have helped us to accomplish what is set out in this report.This report only covers energy price data and analysis for 2017 as historical informationwill always be available in our previous editions respectively.The Department of Energy is working hard to reduce delays in the publishing of the EnergyPrice Report and hopes that the publication will become a standard work of referenceamong energy analysts in South Africa and abroad. Comments and inputs are welcomeand could be addressed to publications@energy.gov.za.Mr Thabane ZuluDirector General: EnergyDate:Energy Price Report - 20183
TABLE OF CONTENTSENERGY PRICE REPORT 2018.1DEPARTMENT OF Crude Oil.82.2Petroleum nating Paraffin.192.2.4Liquid Petroleum Gas (LPG).223.NATURAL GAS.254.COAL.294.1Local and export coal prices.305.ELECTRICITY.32REFERENCES.37APPENDIX B: FUEL PROPERTIES.38APPENDIX C: UNIT CONVERSIONS.39TABLE OF TABLESTable 2.1: 2017 Monthly Brent Crude Oil Prices and the Exchange Rate.9Table 2.2: 2017 Monthly Petrol ULP 93/95 Prices in Rands per litre.12Table 2.3: 2017 Petrol ULP 95 Monthly Levies, Taxes and Margins incents per litre.14Table 2.4: 2017 Monthly Diesel Wholesale Prices in Rands per litre.16Table 2.5: 2017 Diesel 0.05% Monthly Levies, Taxes and Margins in cents per litre.18Table 2.6: 2017 Monthly Illuminating Paraffin Prices in Rands per litre.20Table 2.7: 2017 Monthly Regulated Maximum Retail Prices for LiquefiedPetroleum Gas in cents per kilogram.23Table 3.1: 2017 Monthly Natural Gas Prices in Rand per GigaJoule.264Energy Price Report - 2018
Table 4.1: Annual average local and export coal prices in Rand per ton.30Table 5.1: Annual Average Eskom Prices by Customer Category in cents perkilowatt hour (2008/09 to 2017/18).33Table 5.2 Eskom’s Average Tariff Adjustment.34Table B.2: Calorific Values of Various Fuels.38Table C.3: Energy Unit Conversion Factors.39Table C.4: Unit Prefixes.39TABLE OF FIGURESFigure 2.1: 2017 Monthly Brent Crude Oil Prices and the Exchange Rate. 10Figure 2.2: 2017 Monthly Petrol ULP 93/95 Prices in Rands per litre. 13Figure 2.3: 2017 Petrol ULP 95 Monthly Levies, Taxes and Margins. 15Figure 2.4: 2017 Monthly Diesel Wholesale Prices in Rands per litre. 17Figure 2.5: 2017 Diesel 0.05% Monthly Levies, Taxes and Margins. 19Figure 2.6: 2017 Monthly Illuminating Paraffin Prices in Rands per litre. 21Figure 2.7: 2017 Monthly Regulated Maximum Retail Prices forLiquefied Petroleum Gas in cents per kilogram. 24Figure 3.1: 2017 Monthly Natural Gas Prices in Rand per GigaJoule. 27Figure 4.1: Annual Average Local (FOR) and Exports Prices (FOB) in Rand per ton. 31Figure 5.1 Annual Average Eskom Prices by Customer Category in centsper kilowatt hour (2008/09 to 2017/18). 34Figure 5.2: Annual Eskom Average Tariff Adjustment. 35Energy Price Report - 20185
ABBREVIATIONS AND ACRONYMS6BFPBasic Fuel PriceDSMLDemand-Side Management LevyDoEDepartment of EnergyIPIlluminating ParaffinIPPIndependent Power ProducerLPGLiquefied Petroleum GasLRPLead Replacement PetrolMRGPMaximum Refinery Gate PriceMRPMaximum Retail PriceMYPDMulti Year Price DeterminationOPECOrganization of the Petroleum Exporting CountriesNERSANational Energy Regulator of South AfricaRAFRoad Accident FundSADCSouthern African Development CommunitySARBSouth African Reserve BankULPUnleaded PetrolUS Dollar per barrelUSD/bblEnergy Price Report - 2018
1.INTRODUCTIONEnergy drives economic growth and social development around the world, thereforeaccess to energy is a prerequisite for economic and social development. The energysector is large and made up of the complex and inter-related network of companies thatare directly and indirectly involved in the production and distribution of energy needed topower the economy and facilitate the means of production and transportation.This report covers consecutive monthly prices as well as trend analysis of various energycarriers for the year 2017. In South Africa, electricity prices are reviewed once a year whilepetroleum products prices are changed once a month due to fluctuations in internationaloil prices (quoted in US dollars) and the Rand/US Dollar exchange rate.The report consists of the following sections: Section 2 covers prices of crude oil, and all major petroleum products (petrol, diesel,illuminating paraffin and liquid petroleum gas). Section 3 covers natural gas prices. Section 4 covers the prices of locally consumed and exported coal. Section 5 presents the national Eskom electricity prices. This does not include theprices of electricity sold by individual/various municipalities to end customers.Each section gives a brief introduction followed by a table of prices and graphs depictingthe price movements over time. Where possible, a brief analysis of possible reasons forprice fluctuations is provided.The purpose of this Report is to provide an overview of the latest energy pricing trends andanalysis for the major energy carriers in South Africa i.e. coal, natural gas and crude oil.Energy prices are significant indicators in the cost of providing services such as transportor electricity.Energy Price Report - 20187
2.PETROLEUMThis section covers the monthly international crude oil prices as well as the breakdown ofpetroleum products prices sold nationally for the year 2017. The main focus of the analysisin this section is on the price movements as well as related global and national events thatled to those movements.2.1Crude OilCrude oil is one of the most actively traded commodities in the world. Petroleum stillremains the primary energy source for transportation and manufacturing industries. Forthis reason, oil price movements may impose significant influence on economic situationin different countries. Oil prices are changing due to the interaction between supply anddemand forces on the international commodity markets.1Oil is a commodity, and as such, it tends to see larger fluctuations in price than more stableinvestments such as stocks and bonds. OPEC, or the Organization of Petroleum ExportingCountries, is the main influencer of fluctuations in oil prices. OPEC is a consortium madeup of 13 countries: Algeria, Angola, Ecuador, Indonesia, Iran, Iraq, Kuwait, Libya, Nigeria,Qatar, Saudi Arabia, the United Arab Emirates and Venezuela. OPEC controls 40% of theworld’s supply of oil. The consortium sets production levels to meet global demand andcan influence the price of oil and gas by increasing or decreasing production.As with any commodity, stock or bond, the laws of demand and supply cause oil pricesto change. When supply exceeds demand, prices fall and vise versa. Natural disasters,production costs and political instability are also other factors that can cause oil prices tofluctuate.2Since petroleum products prices are mainly influenced by global oil prices and the exchangerate between the South African Rand and the US Dollar; the narrative in this section willprimarily focus on the two and their impact on the petroleum prices on a monthly basis.The average monthly prices of Brent crude oil and the exchange rate for 2017 are depictedin Table 2.1. The crude oil prices are presented in US Dollar per barrel (USD/bbl) and theexchange in Rand per /iaeapfb/monthly-crude-oil-prices (accessed on 2018/02/08)https://www.investopedia.com/ (accessed on 2018/02/08)Energy Price Report - 2018
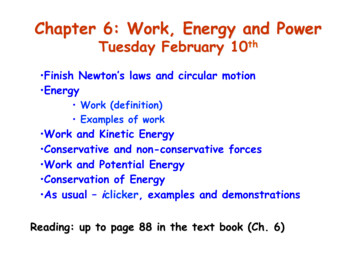
Table 2.1: 2017 Monthly Brent Crude Oil Prices and the Exchange stSeptemberOctoberNovemberDecemberBrent Crude .6262.5764.21Exchange 3.2313.1313.68Source: onthly-crude-oil-prices for Brent Crude oil andSouth African Reserve Bank (SARB) for Exchange RateCrude oil prices increased to 54.89 USD/bbl at the beginning of the year due to thefact that OPEC members agreed to cut production by 1.2 million barrels per day from 1January 2017 during their meeting that was held in Vienna, Austria, on 30 November 2016.Furthermore, Russia and other non-OPEC producers also agreed to cut production by 600thousand barrels per day.3 By the end of the first quarter, the crude oil market declineddespite indications that OPEC members increasingly favoured extended production cutsbut wanted the backing of non-OPEC oil producers. 4Towards the end of April, crude oil prices were slowly rebounding with refinery productionstarting to increase as the Northern Hemisphere summer driving season was approaching,which led to May prices settling at around 50 USD/bbl. During the same period the Randweakened against the US Dollar which contributed about 25 cents per litre on the fuelprice increases.5By the mid-year of 2017, oil prices declined to 48.69 USD/bbl after data showed an increasein U.S. crude inventories, fuelling concerns that markets remained oversupplied despiteefforts by top producers Saudi Arabia and Russia to cut output. Furthermore, OPEC andsome non-OPEC producers agreed to extend supply cuts of 1.8 million barrels per day untilthe end of March 2018 at a meeting in Vienna on 25th May 2017. While OPEC’s decisionwas expected, some oil market investors had hoped that the oil producers would agree345Information was sourced from DoE January 2017 Media statement on adjustment of fuel apfb/monthly-crude-oil-prices (accessed on 2018/02/08)Information was sourced from DoE May 2017 Media statement on adjustment of fuel pricesEnergy Price Report - 20189
to longer or deeper cuts to drain a global glut of crude supplies. The prices of petroleumproducts in the international markets decreased in line with lower crude oil prices thoughthe Rand strengthened against the US Dollar during the same period. 6Figure 2.1: 2017 Monthly Brent Crude Oil Prices and the ExchangeRate6513,913,7Brent crude oil13,55513,3exchange rate6013,15012,912,7JanFebMarAprMayJunExchange RateJulAugSepOctNovDec45Brent Crude OilSource: onthly-crude-oil-prices for Brent Crude oil andSouth African Reserve Bank (SARB) for Exchange RateThe oil prices increased since the beginning of September 2017, mainly due to, (a)Improved compliance on production freeze by OPEC countries, (b) Evidence that USdrilling activity and production is not rising as was expected, and (c) Evidence that stocksof crude oil in the US are falling faster than anticipated.7 The oil price increases continuedrelentlessly until December where they peaked at 64 USD/bbl.6710Information was sourced from DoE June 2017 Media statement on adjustment of fuel pricesInformation was sourced from DoE October 2017 Media statement on adjustment of fuel pricesEnergy Price Report - 2018
2.2Petroleum ProductsSouth Africa’s fuel prices are adjusted on a monthly basis, informed by international andlocal factors. International factors include the fact that South Africa imports both crudeoil and finished products at a price set at the international level, including shipping costs.Locally factors includes the exchange rate of the Rand against the US dollar as well as fuellevies and the Road Accident Fund (RAF) levy that are determined and adjusted annuallyby the Minister of Finance.Petrol 95 Octane Unleaded, Petrol 93 Unleaded, Petrol 95 LRP, Petrol 93 LRP, Diesel0.05% Sulphur, Diesel 0.005% Sulphur and Illuminating Paraffin are the products coveredby the calculation of the Basic Fuel Price (BFP). The BFP is based on an import parityprinciple. In other words, it is the cost that a South African importer of petrol incurs to buythe petrol from an international refinery, transport the product from that refinery, insurethe product against losses at sea and land the product on South African shores. TheBFP formula reflects the realistic cost of importing a litre of product from internationalrefineries with products of a similar quality compared to local South African specificationson a sustainable basis.The tables, graphs and analysis of main petroleum products for 2017 are illustrated andexpounded in the subsequent sections.2.2.1PetrolBy the second month of the year petrol prices soared by 29 cents per litre, due to theincrease in the prices of crude oil. The rationale behind crude oil price increases wasbased on the news that key crude exporters, including Saudi Arabia and Russia, werecutting production to reduce excess supply of crude. Furthermore, the U.S. inventory datashowed that the global market was tightening due to lower production by OPEC and otherexporters.88Information was sourced from DoE February 2017 Media statement on adjustment of fuel pricesEnergy Price Report - 201811
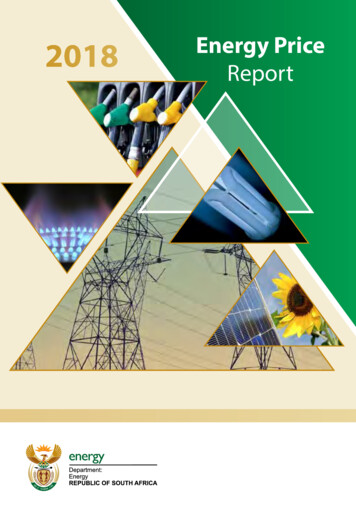
Table 2.2: 2017 Monthly Petrol ULP 93/95 Prices in Rands per litrePetrol (ULP) SeptemberOctoberNovemberDecemberPetrol (ULP) .0114.0514.76Source: Department of Energy (DoE)The month of April had traditionally been the difficult one for motorists as a result of theannual increases to the domestic levies and tariffs. However, even though the increase inRoad Accident Fund (RAF) and fuel levies were added to the final pump price there wasstill a decrease of petrol prices in the month. The negative effects of the domestic leviesand tariff increases on the final pump price was offset by the plunging in crude oil prices.The plunging of crude oil prices occurred as overall US commercial stocks increased by1.3 million barrels, as another sizable 5 million barrel crude stock build more than offseta 3.6 million barrel product inventory draw down putting downward pressure on prices.Libya’s oil production reached 700,000 barrels per day, recovering from a drop earlier inthe month caused by fighting at two key oil ports which also helped on putting downwardspressure on prices.9912Information was sourced from DoE October 2017 Media statement on adjustment of fuel pricesEnergy Price Report - 2018
Figure 2.2: 2017 Monthly Petrol ULP 93/95 Prices in Rands per litre1514,5Petrol ulp 93/95 prices1413,51312,512JanFebMarPetrol (ULP) 93AprMayPetrol (ULP) 93JunJulAugPetrol (ULP) 95SepOctNovDecPetrol (ULP) 95Source: Department of Energy (DoE)Motorists were not spared during the festive season with petrol prices increasing by awhopping 71 cents per litre (in December) which recorded the biggest increase of theyear. This also became the peak price of petrol for the year with ULP 95 inland and coastalprices rising to R14.76 and R14.27 per litre respectively, this increase was triggered bythe crude oil prices hitting a two-year high well above 60 USD/bbl, partly because of therenewed tensions and uncertainties in the Middle East, with and partly due to buoyantglobal demand expectations and the strong likelihood that OPEC was going to extend itsoutput cuts programme well into the coming year.10The elements that make up the price of unleaded petrol 95 are depicted in Table 2.3 below.The difference between the retail price of ULP 93 and ULP 95 in the inland region of around15 c/l on average is mainly due to the 10 c/l Demand-Side Management Levy (DSML)charged on ULP 95 as well as quarterly adjustments of octane/grade zone differentials.10Information was sourced from DoE December 2017 Media statement on adjustment of fuel pricesEnergy Price Report - 201813
0.000.33154.00 35.20 0.0035.60 41.00 10.00 0.00-0.40Apr-17Pump Rounding176.40 285.00 0.00Equalisation Fund levy612.87 4.00DMSL-0.40Mar-17Wholesale Margin35.60 41.00 10.00 0.00Slate levy35.60 41.00 10.00 0.00154.00 35.20 0.00Service cost recoveries154.00 35.20 0.000.33RAF levyPetroleum Pipeline levy0.330.00Incremental transportrecover levy0.00176.40 285.00 0.00Fuel Levy176.40 285.00 0.00620.87 4.00Dealers margin591.87 4.00Custom & Excise dutyJan-17Feb-17PeriodBFPIP Tracer levyZone differential in GautengTable 2.3: 2017 Petrol ULP 95 Monthly Levies, Taxes and Margins incents per litre-0.40548.67 4.00176.40 315.00 0.000.000.33163.00 35.20 0.0035.60 41.50 10.00 0.000.30May-17 597.67 4.00176.40 315.00 0.000.000.33163.00 35.20 0.0035.60 41.50 10.00 0.000.30Jun-17572.67 4.00176.40 315.00 0.000.000.33163.00 35.20 0.0035.60 41.50 10.00 0.000.30Jul-17504.67 4.00176.40 315.00 0.000.000.33163.00 35.20 0.0035.60 41.50 10.00 0.000.30Aug-17523.67 4.00176.40 315.00 0.000.000.33163.00 35.20 0.0035.60 41.50 10.00 0.000.30Sep-17586.07 4.00181.00 315.00 0.000.000.33163.00 35.20 0.0035.60 41.50 10.00 0.000.30Oct-17615.07 4.00181.00 315.00 0.000.000.33163.00 35.20 0.0035.60 41.50 10.00 0.000.30Nov-17619.07 4.00181.00 315.00 0.000.000.33163.00 35.20 0.0035.60 41.50 10.00 0.000.30Dec-17686.17 4.00187.20 315.00 0.000.000.33163.00 34.50 0.0034.00 41.50 10.00 0.000.30Source: Department of Energy (DoE)To identify the contribution of each component to the final retail price of petrol, all thecomponents are illustrated in Figure 2.3 with their percentage contributions. During the2017 budget speech, the Minister of Finance announced adjustments to the taxes leviedper litre of fuel to motorists by government at the filling stations which came into effect onthe 5th of April. The two levies involved are fuel and RAF levy; which were raised by 30and 9 cents respectively. Both levies (fuel and RAF levy) contributed 22% and 12% to thefinal retail price of petrol respectively.The Basic Fuel Price (BFP) and fuel levy had a larger portion in the final retail price ofPetrol ULP 95 in 2017, contributing 43% and 13% respectivelyThe road transport tariffs in the applicable road transport pricing zones, as well as fortransporting fuels by road from pipeline draw-off points to supply depots were determinedand effected on the 5th ofApril 2017 into the price structures of petrol, diesel and IlluminatingParaffin ranging from 0.2 to 8.5 cents per Litre.14Energy Price Report - 2018
Figure 2.3: 2017 Petrol ULP 95 Monthly Levies, Taxes and MarginsService costrecoveries3%Fuel Levy22%RAF levy12%Wholesale Margin3%Dealers margin13%Other7%Zone differenDal inGauteng3%BFP43%DMSL1%Source: Department of Energy (DoE)In line with the application of the Regulatory Accounts System the Minister of Energy hasapproved a net increase of 3.9 cents per Litre in the annual margin adjustments on petroland a net increase of 0.7 cents per litre on secondary storage and secondary distributionmargins.2.2.2DieselAt the beginning of the year 0.05% Sulphur diesel prices for inland and coastal regionswere priced at R11.42 and R11.03 per litre respectively. This was succeeded by a prickly21 cents increase per litre in February due to the weakening of the Rand against the USDollar and the increase in crude oil prices. By the end of the first quarter diesel prices hadinsignificantly dropped by a measly 2 cents per litre as the Rand strengthened against theUS Dollar from R13.56 to R13.20.Energy Price Report - 201815
Table 2.4: 2017 Monthly Diesel Wholesale Prices in Rands per litreDiesel 0.05% SulphurPeriodDiesel stSeptemberOctoberNovemberDecemberSource: Department of Energy (DoE)During the period under review (i.e June), oil prices reached their lowest point for theyear as light sweet crude supplies particularly from the US as well as Libya and Nigeria(unbound by the OPEC cut agreement) continue to rise. Brent crude oil prices declined toa seven-month low and the U.S. crude settled at its cheapest level since September 2016,after increased supply from several key producers overshadowed compliance by OPECand non-OPEC oil producers with a deal to cut global output. These led to a massive dropof diesel prices by 60 cents per litre in the month of July.111116Information was sourced from DoE July 2017 Media statement on adjustment of fuel pricesEnergy Price Report - 2018
Figure 2.4: 2017 Monthly Diesel Wholesale Prices in Rands per litre13,5Diesel Wholesale Prices13,012,512,011,511,010,5JanFebMarDiesel 0.05% Sulphur CoastAprMayJunJulAugDiesel 0.05% Sulphur InlandSepOctNovDecDiesel 0.005% Sulphur InlandSource: Department of Energy (DoE)The fourth quarter was characterised by the sustained increases in diesel prices which forthe first time traversed the twelve Rand mark in the inland risen to R12.12 per litre. Thereasons for the price increases was mainly the result of higher crude oil prices. Thoughthe petrol prices were very strong through August due to impact of Hurricane Harvey,the diesel prices rose faster than the prices of petrol due to the sharp decrease in dieselstocks in the US.12The elements that make up the final price of 0.05% Sulphur Diesel are depicted on Table2.5. Unlike petrol, certain components that comprise the final petrol price are not applicableto diesel, like the dealers margin, since diesel is regulated up to the wholesale level.12Information was sourced from DoE October 2017 Media statement on adjustment of fuel pricesEnergy Price Report - 201817
Zone differential inGautengWholesale 70.000.000.010.33154.0035.200.0067.6641.00Slate levyService cost recovery4.004.00IP Tracer levy569.63590.63Fuel levyJan-17Feb-17PeriodBFPRAF levyPetroleum pipelinelevyIncremental InlandTransportCustom & ExcisedutyTable 2.5: 2017 Diesel 0.05% Monthly Levies, Taxes and Margins incents per e: Department of Energy (DoE)To identify the contribution of each component to the diesel wholesale price, all thecomponents are shown in Figure 2.5. In 2017, the BFP was the largest contributor tothe total wholesale price of diesel with 49%. The second largest contributor to dieselwholesale price was fuel levy contributing 25%, followed by Road Accident Fund (RAF)levy at 14%, wholesale margin and zone differential’s contributions amounting to 6% and3% respectively. The rest of the components contributed a negligible amount towards thefinal pump price.18Energy Price Report - 2018
Figure 2.5: 2017 Diesel 0.05% Monthly Levies, Taxes and MarginsService cost recovery3%RAF levy14%Fuel levy25%Wholesale margin6%Other12%BFP49%Zone differenDal inGauteng3%Source: Department of Energy (DoE)2.2.3Illuminating ParaffinParaffin is an alkane hydrocarbon that has a variety of practical uses in industries suchas medicine, agriculture and cosmetics. In centuries past, before electricity was invented,paraffin was used in lamps and lanterns as the main source of lighting. Today, paraffinis still used in less developed countries as the main fuel for cooking. Liquid paraffin canbe used as a lubricant for machinery. Lubricants can help to extend the life of expensivemachinery and equipment by reducing friction, binding and wear. Paraffin can also beused as a coolant for electrical systems, as hydraulic fluid and as a solvent for greasesand insecticides. Liquid paraffin also has medicinal properties. It is commonly used totreat dry skin, constipation, and eczema. Paraffin wax is also used as a water-harvestingsoil treatment to supply runoff water to dry areas, as an adhesive and as a water-proofingagent.Paraffin can be extracted from coal, wood and oil shale, but it is primarily obtained from thedistillation of petroleum, which was first distilled in 1807 by geologist Abraham Gesner. Thecost of producing paraffin was high, however, when new sources of paraffin and cheapermethods of refining were later discovered, it lead to lower prices of the fuel. Paraffin, whenfound in solid form, is called paraffin wax, while the liquid form is referred to as paraffinoil. Liquid paraffin oil is a mineral oil that comes in two forms, either heavy liquid paraffinoil or light liquid paraffin oil. Paraffin is clean burning and maintains a high heat -paraffin-and-what-are-its-uses/ (accessed on 2018.02.09)Energy Price Report - 201819
The Single Maximum National Retail Price for Ill
Energy Price Report - 2018 1 Energy Price Report 2019 2018 ENERGY PRICE REPORT Directorate: Energy Data Collection, Management and Analysis Compiled by: Mr Modisane Motiang modisane.motiang@energy.gov.za Supervised by: Mr Ramaano Nembahe ramaano.nembahe@energy.gov.za Published by: Department of Energy Private Bag X96 Pretoria 0001 Tel: (012 .