Transcription
May 2018"Research on Initial Career Paths to Promote Active Participation"Results of the panel survey on the transition of consciousness andaction for the first three yearsNational Women's Education Center, JapanAbout the researchResearch objectiveWork environments that new graduates face influence their later career formation and lifestyle for both men andwomen. In order to raise women's career consciousness and promote empowerment, it is considered necessary toencourage them to start developing themselves in the early days of their work career. The National Women'sEducation Center is conducting a panel survey to track fresh recruits (college and graduate school graduates) whobecame full-time employees of private-sector companies in 2015, for the purpose of understanding the transition ofconsciousness and growth of men and women in their early days of career path. The first survey, the second surveyand the third survey were conducted in 2015, 2016 and 2017 respectively (in October every year).※Advantages of a panel survey : B y repeating the "same questions" to the "same individuals" each year, panel surveyenables in-depth analysis of the "transition" of consciousness and environments aswell as the "factors of the transition"About the surveySurvey contentsConsciousness survey on the present state of employment, foresight/future prospects, life plan, and so on.Survey procedure① Survey subjects: Subjects of the first survey are 2,137 (836 women and 1,301 men) newly graduates (college andgraduate school) who joined 17 cooperating companies in 2015. The 17 cooperating companies are big business establishments with more than 3,000 full-time employees (10companies), more than 1,000 and less than 2,999 employees (4 companies), and more than 800 and less than 999employees (3 companies), including one finance company, one construction company, one consultant company, sevenservice companies, one trading/wholesale company, two communications/software companies, and fourmanufacturing companies (15 companies have their headquarters in Tokyo, one company in Saitama, and one inOsaka).② Survey method: Web questionnaire survey③Number of valid respondents:1st survey (first year of employment) 1,255 (474 women and 781 men)2nd survey (second year of employment) 975 (393 women and 582 men)3rd survey (third year of employment) 1,090 (409 women and 681 men)※ In the 2nd and the 3rd survey, those who had left their employment at the time of the surveys were excludedSurvey research membersThe“Survey Research on Men and Women's Initial Career Paths to Promote Active Participation”Review Committeeconsisting of outside experts and the members of the Office of Research and International Affairs of the NationalWomen's Education Center was organized to conduct the survey research. Outside experts (Position titles as of March 31, 2018)Toru Anzai (Professor of Gunma Prefectural Women's University) ※Present post: professor of Mejiro UniversityNami Otsuki (Professor of University of the Sacred Heart, Director of the Career Guidance Center)Mizue Oyama (Chief of the Political & Social Affairs Bureau, Keidanren)Tomohiro Takami (Researcher of the Japan Institute for Labour Policy and Training)Akiko Nagai (Associate professor of Japan Women's University) National Women's Education Center Hiroe Nakano (Director of the Office of Research and International Affairs, National Women's Education Center)Naoko Shima (Researcher of the Office of Research and International Affairs, National Women's Education Center)Miho Watanabe (Researcher of the Office of Research and International Affairs, National Women's Education Center)1 National Women's Education Center, Japan
summary Job satisfaction/realization of growth/motivation for contributionWhile the degree of job satisfaction declines year by year in both men and women, the decline rate becomes relativelyslow in the second and the third year. Every year, men are more "satisfied" than women (Chart 1). While selfevaluation of "knowledge and skills for conducting job assignments" becomes higher each year in both men andwomen, men evaluate themselves higher than women in the second and the third year (Chart 2). While 70 to 80% ofboth men and women are conscious about "contribution to corporate objectives" every year, more men answered "yes"than women (Chart 3). Desire for career change20 percent of both men and women showed a "desire for career change throughout the three years". 35 percent ofwomen and 30 percent of men have "no desire for career change throughout the three years" (Chart 4).Reasons for career changeCompared to those who have "no desire for career change throughout the three years" both men and womenwho have a "desire for career change throughout the three years" answered their job unchallenging (Chart 5) andare concerned with their ability to excute current job (Chart 6). Also, they do not feel that their bosses supportand encourage their career development (Chart 7) and they feel there are not enough education/trainingopportunities (Chart 8). And they feel they have too much overtime work (Chart 9). Desire for a managerial position35 percent of women and 80 percent of men have a "desire for a managerial position throughout the three years"(Chart 10).Comparison between women who have a "desire for a managerial position throughout the three years" and thosewho had a "desire for a managerial position in the first year but lost it in the second or the third year".In the first year, there is relatively little difference in job satisfaction, self-evaluation of knowledge and skills forconducting job assignments, plan proposal, frequency of overtime work, and competence as a leader.In the third year in which some lose the desire for a managerial position while some keep it, women who had a"desire for a managerial position but lost it" are low in job satisfaction, give themselves a low evaluation for theirknowledge and skills, do not offer plan proposal, and work overtime frequently. A relatively high percentage saysyes to "men are more suited for a leadership position than women" (Chart 11 to 15).Comparison of women and men who have a "desire for a managerial position throughout"Self-evaluation of knowledge and skills is higher among women in the first year, but it becomes higher amongmen in the third year (Chart 16). There is not much difference in men and women in the second year regardingthe speed of growth expected, but men feel it "fast" in the third year (Chart 17). While the frequency of overtimework is higher among men in the first and the third year, the difference between men and women becomeslarger in the third year (Chart 18).※Since numerical numbers (%) are rounded off to one decimal place, the total of a breakdown may not become100%.【Contact】Office of Research and International Affairs,National Women's Education Center, Japan728 Sugaya, Ranzan-machi, Hiki-gun, Saitama 355-0292, JapanTEL 81-493-62-6437 FAX 81-493-62-9034Naoko Shima (shima@nwec.jp)2 National Women's Education Center, Japan
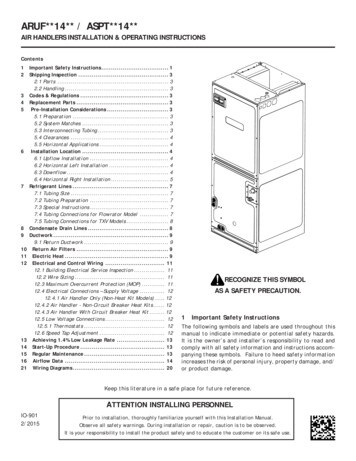
detailsJob satisfaction/realization of growth/motivation for contribution※Subjects of analysis: 229 women and 346 men who responded to all surveys for three years. While the degree of job satisfaction ( "satisfied" "somewhat satisfied") declines yearly in both menand women, the decline rate becomes relatively slow in the second and the third year.Every year, men are more "satisfied" with their job than women (Chart 1).Chart 1: Job 620.110.98.71st year2nd year3rd year Satisfied5.517.311.829.761.140Men Somewhat satisfiedJob 19.711.61st year2nd year3rd year Somewhat dissatisfied Dissatisfied Self-evaluation of "knowledge and skills for conducting job assignments" becomes higher each year forboth men and women.Men evaluate themselves higher than women in the second and the third year (Chart 2).Chart 2: Self-evaluation of knowledge and skills for conducting job .11.31.81st year8.314.045.03.12nd year3rd year Have sufficient knowledge and skillsHave knowledge and 2.01st year To some extent48.65.28.12nd year3rd year Somewhat insufficient Insufficient Overall, 70 to 80% of both men and women answered that they act consciously to contribute towardcorporate goals. More men answered so than women (Chart 3).Chart 3: Act consciously to contribute toward corporate 71st year2nd year3rd year4.44.86040200 YesConscious of contributionto corporate objectives(%)100 Rather 81st year2nd year3rd year Rather no No3 National Women's Education Center, Japan
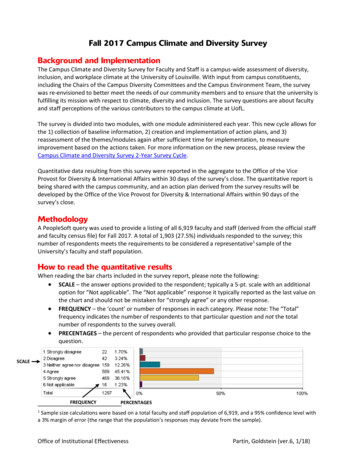
Desire for career change※Subjects of analysis: 229 women and 346 men who responded to all surveys in three years after joining a company.Transition of desire for career changeHave a desire for career change throughout: "Those who wished to change their jobs throughout the three years"Women 20.1% Men 19.7%Have no desire for career change throughout: "Those who didn't wish to change their jobs during the three years"Women 35.4% Men 30.4%Chart 4: Transition of desire for career change1st year2nd yearDesire forcareer changeNo desire forcareer change3rd re forcareer changethroughoutNoNoYesNoYesNoNo desire forcareer changethroughoutNoBackgrounds of desire for career change: Unchallenging job/concerned with abilityCompared to those who have "no desire for career change throughout", both men and women who have a "desire forcareer change throughout" find their job unchallenging (Chart 5), and they are concered with their abilities (Chart 6).Also, among those who have a "desire for career change throughout", women increased concern for their ability whilemen decreased (Chart 6).Chart 5: Find my job challenging(Comparison by gender between "desire for career change throughout" and "no desire for career change 313.049.451.91.27.454.337.01st year 2nd year 3rd year 1st year 2nd year 3rd yearDesire for careerchange throughoutNo desire for careerchange throughout Yes Rather .81.03.80.011.445.70.04.835.249.560.047.641.01st year 2nd year 3rd year 1st year 2nd year 3rd yearDesire for careerchange throughout Rather noNo desire for careerchange throughout NoChart 6: Concerned with my ability to continue current job(Comparison by gender between "desire for career change throughout" and "no desire for career change .032.143.238.237.09.818.520.91st year 2nd year 3rd year 1st year 2nd year 3rd yearDesire for careerchange throughoutNo desire for careerchange throughout Yes4 Rather 41st year 2nd year 3rd year 1st year 2nd year 3rd yearDesire for careerchange throughout Rather noNo desire for careerchange throughout No National Women's Education Center, Japan
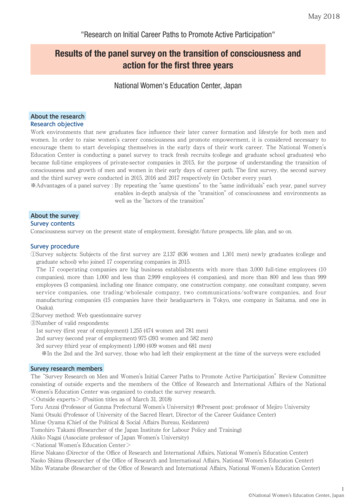
Backgrounds of desire for career change: Lack of boss's zeal for developing people/training opportunitiesCompared to those who have "no desire for career change throughout", both men and women who have a "desire forcareer change throughout" give low evaluations to "boss's zeal for developing people" (Chart 7) and "opportunities ineducation/training" (Chart 8) every year. More men than women answered, "yes" to both "boss's zeal" and"opportunities in education/training" (Chart 7 and 8).Chart 7 boss's supports and encourages career development(Comparison by gender between "desire for career change throughout" and "no desire for career change 1.229.635.322.125.01st year 2nd year 3rd year 1st year 2nd year 3rd yearDesire for careerchange throughoutNo desire for careerchange throughout YesMen2.50.02.934.362.945.746.71.915.247.635.21st year 2nd year 3rd year 1st year 2nd year 3rd yearDesire for careerchange throughout Rather yes1.95.7 Rather noNo desire for careerchange throughout NoChart 8: Have good education/training opportunities in the workplace(Comparison by gender between "desire for career change throughout" and "no desire for career change .725.022.11st year 2nd year 3rd year 1st year 2nd year 3rd yearDesire for careerchange throughoutNo desire for careerchange throughout 252.427.61st year 2nd year 3rd year 1st year 2nd year 3rd yearDesire for careerchange throughout Rather yes1.95.7 Rather noNo desire for careerchange throughout NoBackgrounds of desire for career change: Too much overtime workCompared to those who have "no desire for career change throughout", both men and women who have a "desire forcareer change throughout" work overtime more frequently every year (Chart 9).Chart 9: Frequency of overtime work(Comparison by gender between "desire for career change throughout" and "no desire for career change 1st year 2nd year 3rd year 1st year 2nd year 3rd yearDesire for careerchange throughout Almost every dayNo desire for careerchange throughout 3 to 4 days a .020.018.133.340.032.431.424.818.11st year 2nd year 3rd year 1st year 2nd year 3rd yearDesire for careerchange throughout 1 to 2 days a weekNo desire for careerchange throughout Almost no overtime work5 National Women's Education Center, Japan
Aspiration for a managerial position※ Subjects of analysis: Women and men who responded to all surveys for three years excluding those who are in a jobcategory not assumed to hold a managerial position; 211 women and 344 men.Transition of aspiration for a managerial positionHave an aspiration for a managerial position throughout: "Wishing to be in a managerial position"throughout the three years.Women 35.1% Men 79.1%Had an aspiration for a managerial position but lost it: "Wished" to be in a managerial position in the firstyear but "no longer wish" in the second or the third year.Women 26.6% Men 12.2%Chart 10: Transition of a desire for a managerial position1st year2nd year3rd yearYesYesAspiration fora 0%No28.4%2.6%Had an aspiration fora managerial positionbut lost itYesNoYesNoMen(344)35.1%NoNoNo aspiration fora managerialpositionWomen(211)Aspiration for a managerialposition throughout Comparison among women: "Have an aspiration for a managerial position throughout" vs. "Had anaspiration for a managerial position but lost it".Job satisfaction/self-evaluation of knowledge and skills In the first year, there is relatively little difference in job satisfaction (Chart 11) and self-evaluation of knowledge andskills for conducting job assignments ( percentage of "Have sufficient knowledge and skills" "To some extent")(Chart 12). In the third year in which some lose the desire for a managerial position while some keep it, women who had a"desire for a managerial position but lost it" are low in job satisfaction (Chat 11) and give themselves a low evaluationfor their knowledge and skills (Chart 12).Chart 11: Find my job challenging(Comparison between women who "have a desire for a managerial position throughout" and those who "had a desire for a managerial position but lost it".)(%)10080604001st year4.11.85.447.346.448.746.4Have a desire fora managerialposition throughoutHad a desire fora managerialposition but lost it Yes3rd year1.816.114.943.2Yes200.04.1 Rather yes58.937.823.2Have a desire fora managerialposition throughout Rather noHad a desire fora managerialposition but lost it NoChart 12: Self-evaluation of knowledge and skills for conducting job assignments(Comparison between women who "have a desire for a managerial position throughout" and those who "had a desire for a managerial position but lost it".)(%)1008040200624.346.027.02.7Have a desire fora managerialposition throughout3rd year8.135.733.930.40.0Had a desire fora managerialposition but lost it Have sufficient knowledge and skillsHave knowledgeand skills601st year14.340.551.844.66.8Have a desire fora managerialposition throughout To some extent33.90.0Had a desire fora managerialposition but lost it Somewhat insufficient Insufficient National Women's Education Center, Japan
Plan proposal/frequency of overtime work/competence as a leader In the first year, there is relatively little difference in plan proposal ( percentage of "Yes" "Rather yes") (Chart 13),frequency of overtime work ( percentage of "Almost every day") (Chart 14), and competence as a leader (Chart 15). In the third year in which some lose the desire for a managerial position while some keep it, women who had a"desire for a managerial position but lost it" do not offer plan proposal (Chart 13), and work overtime frequently(Chart 14). Also, a relatively high percentage says yes to "men are more suited for a leadership position thanwomen", suggesting that they are in a work environment that makes them think that "men are most suited to aleadership position" (Chart 15).Chart 13: Propose ideas and plans voluntarily(Comparison between women who "have a desire for a managerial position throughout" and those who "had a desire for a managerial position but lost it".)(%)100803rd year6.859.5025.78.128.63.6Have a desire fora managerialposition throughoutHad a desire fora managerialposition but lost it Yes8.933.844.640206.823.2Propose ideasand plans601st year Rather yes53.647.333.912.23.6Have a desire fora managerialposition throughout Rather noHad a desire fora managerialposition but lost it NoChart 14: Frequently of overtime work(Comparison between women who "have a desire for a managerial position throughout" and those who "had a desire for a managerial position but lost it".)1st 8Have a desire fora managerialposition throughoutHad a desire fora managerialposition but lost it Almost every day 3 to 4 days a week5.412.516.225.037.8Almostevery day403rd year35.733.846.429.7Have a desire fora managerialposition throughout 1 to 2 days a weekHad a desire fora managerialposition but lost it Almost no overtime workChart 15: Men are more suited for a leadership position than women(Comparison between women who "have a desire for a managerial position throughout" and those who "had a desire for a managerial position but lost it".)(%)10080402003rd year32.132.433.940.537.524.32.726.81.813.51.4Have a desire fora managerialposition throughoutHad a desire fora managerialposition but lost itHave a desire fora managerialposition throughout I think so I tend to think so48.739.336.5 I tend not to think so17.910.7Had a desire fora managerialposition but lost itMen are more suited601st year I don’t think so7 National Women's Education Center, Japan
Comparison between men and women: "Have an aspiration for a managerial position for 3 years"Self-evaluation of knowledge and skills/speed of growth expected/frequency of overtime work Self-evaluation of knowledge and skills is higher among women in the first year, but it becomes higher among menin the third year (Chart 16). There is not much difference in men and women in the second year regarding the expected speed of growth, butmen feel it "fast" in the third year (Chart 17).※ The 1st year survey does not ask about the "expected speed of growth". Responses in the 2nd and the 3rdyear are compared. Frequency of overtime work is higher among men in the first and the third year, and the difference between menand women becomes larger in the third year (Chart 18).Chart 16: Self-evaluation of knowledge and skills for conducting job assignments(Comparison between women who have a "desire for a managerial position throughout" and men who have a "desire for a managerial position throughout")806020024.33rd year29.446.044.127.02.724.32.2Women who have a desirefor a managerialposition throughoutHaveknowledgeand skills401st yearInsufficient(%)100Men who have a desirefor a managerialposition throughout Have knowledge and skills To some extent8.19.240.531.650.044.66.89.2Women who have a desirefor a managerialposition throughoutMen who have a desirefor a managerialposition throughout Somewhat insufficient InsufficientChart 17: Expected speed of growth is fast(Comparison between women who have a "desire for a managerial position throughout" and men who have a "desire for a managerial position throughout")(%)10080602002nd year20.318.847.351.128.427.2Women who have a desirefor a managerialposition throughout Rather yes2.921.028.4Men who have a desirefor a managerialposition throughout Yes3rd year5.42.9Yes404.152.644.621.623.5Women who have a desirefor a managerialposition throughoutMen who have a desirefor a managerialposition throughout Rather no NoChart 18: Frequency of overtime work(Comparison between women who have a "desire for a managerial position throughout" and men who have a "desire for a managerial position en who have a desirefor a managerialposition throughout Almost every day8Men who have a desirefor a managerialposition throughout 3 to 4 days a week7.419.116.220.332.733.8Almostevery day4037.83rd yearAlmost noovertime work1st year(%)10040.829.7Women who have a desirefor a managerialposition throughout 1 to 2 days a weekMen who have a desirefor a managerialposition throughout Almost no overtime work National Women's Education Center, Japan
About the survey Survey contents Consciousness survey on the present state of employment, foresight/future prospects, life plan, and so on. Survey procedure ①Survey subjects: Subjects of the first survey are 2,137 (836 women and 1,301 men) newly graduates (college and graduate school) who joined 17 cooperating companies in 2015.