Transcription
ARTICLE IN PRESSTourism Management 27 (2006) 943–956www.elsevier.com/locate/tourmanThe destination image of Russia: From the online induced perspectiveSvetlana Stepchenkovaa, Alastair M. Morrisonb, aDepartment of Hospitality and Tourism Management, Purdue University, 154 Stone Hall, 700 W. State Street, West Lafayette, IN 47907-2059, USADepartment of Hospitality and Tourism Management, College of Consumer and Family Sciences, Purdue University, 111A Stone Hall, 700 W. State StreetWest, Lafayette, IN 47907-2059 USAbReceived 1 May 2005; accepted 3 October 2005AbstractWith the Internet becoming a prominent means of destination marketing and promotion, this study compared US and Russian websitematerials related to travel to Russia to determine whether the two sides differed in: (1) most frequently mentioned places within thecountry; and (2) descriptions of Russia as a travel destination. These different perspectives can contribute to a better understanding ofthe induced component of Russia’s destination image in the online environment and their analysis resulted in important marketingimplications. The research approach for this study was to view every website as a case in the selected sample of the whole population ofUS and Russian websites. Two software programs, CATPAC II and WORDER, were applied to analyze the content of website materialsand solve the technical issues of destination counting. This study clearly suggests that US tour operators are narrowly positioning Russiaas mainly being a historic and cultural destination, with a relatively tight geographic emphasis on the western portion of the country.Technically and content-wise, the Russian websites require the greatest improvements. They tend to be loaded with information and notparticularly well targeted to specific countries of visitor origin or market segments by travel interests.r 2005 Published by Elsevier Ltd.Keywords: CATPAC; Content analysis; Destination image; Induced image; Russia; WORDER1. Introduction1.1. Russian inbound tourism and the US componentStarting in the early 1990s and to date, Russia hasundergone changes in its political, economic, and socialspheres that have had a huge impact on inbound tourism.While in the former Soviet Union international travelershad limited tourist options to choose from, todaynumerous tourist companies offer exciting and diverseRussian tourism products. The openness of Russia as atravel destination and rising quality of its tourism offer hasbeen reflected in the growing numbers of tourist arrivals forthe last 10 years. WTO estimates Russian tourism potentialas 47 million international travelers by 2020 (WorldTourism Organization (WTO), 2003). According to Russia’s Federal State Statistics Service (Rosstat, former Corresponding author. Tel.: 1 765 494 7905; fax: 1 765 496 1168.E-mail addresses: svetlana@purdue.edu (S. Stepchenkova),alastair@purdue.edu (A.M. Morrison).0261-5177/ - see front matter r 2005 Published by Elsevier Ltd.doi:10.1016/j.tourman.2005.10.021Goskomstat), a total of 22.51 million people visited Russiain 2003, or 8.15 million people without counting thearrivals from the CIS countries (Rosstat, 2004). The US isone of the most important countries for inbound tourismto Russia: in 2003, 281,000 US residents visited Russia, thefifth largest share of visitors (not including arrivals fromthe former Soviet republics) (Russia’s Federal StateStatistics Service (Rosstat), 2004). Given the size of theUS market and the fact that American pleasure travelersare the world’s leading travel spenders (World TourismOrganization (WTO), 2004), this segment is very attractivefor the Russian tourism industry from an economicstandpoint.However, the positioning of the country for the USconsumer segment is problematic without a thoroughunderstanding of how Russia as a vacation destination isperceived by potential US pleasure travelers (Ahmed, 1991;Hunt, 1975). The lack of information is evident: thedestination image literature reviewed by Pike (2002) for theperiod of 1973–2000, found only one out of 142 articlesthat dealt with Russia’s image. Moreover, that study by
ARTICLE IN PRESS944S. Stepchenkova, A.M. Morrison / Tourism Management 27 (2006) 943–956Pizam, Jafari, and Milman (1991) reflected the old,‘‘Soviet’’ image of the country. While a comprehensivestudy of Russia’s destination image remains to be done,this research attempted to gain initial insights into whatimage of Russia is transmitted by American and Russiantour operators in the online environment.The comparative analysis of destination images is ofinterest from at least two perspectives. First, it would bereasonable to propose that US tour operators know moreabout US tourists and what they are seeking. Therefore, tosee how Russia is presented by the tour operators of one ofthe largest tourist markets in the world should be useful toboth the Federal Tourism Agency of the Russian Federation (FTA) and Russian travel providers. It should behelpful to better understand the demand for the Russiantourism product and, if needed, in countering negative orinaccurate information. Second, Russian tour operatorsshould know more about the destinations within Russia.Thus, the Russian perspective should make US touroperators more aware of the travel opportunities withinRussia that they are missing. Therefore, the primaryobjectives of this study were to:1. Identify destinations within Russia mentioned mostfrequently by US and Russian tour operator websites.The comparative analysis of frequencies will shed lighton the awareness levels of attractions and places ofinterest within Russia among US tour operators.2. Pinpoint the most frequent meaningful words (thesemight include ‘‘Moscow’’, ‘‘Kremlin’’, ‘‘church’’) whentour operators offer Russia as a destination and touncover the common themes in their descriptions ofRussia. The most frequent meaningful words wereinterpreted as the induced image variables and wereused to compare the US and Russian perspectives onRussia as a travel destination.1.2. Destination image and its induced componentAlthough an exact meaning of the term ‘‘destinationimage’’ is difficult to define (Echtner & Ritchie, 1991;Pearce, 1988), there is a general agreement among scholarsthat destination image is a multi-faceted, compositeconstruct, which consists of interrelated cognitive andaffective evaluations woven into overall impressions(Assael, 1984; Baloglu & McCleary, 1999; Gartner, 1993;MacKay & Fesenmaier, 1997). Some researchers emphasized the influence of destination image on destinationchoice and argued that the image construct follows thethree-element attitude model from psychology, whichincludes cognitive, affective, and behavioral elements(Breckler, 1984; Pike & Ryan, 2004; White, 2004). Echtnerand Ritchie (1991, 1993) suggested that the destinationimage construct consists of three dimensions: attributeholistic, functional-psychological, and common-unique.Images can be shared by groups of people (Lawson &Baud-Bovy, 1977) and, as such, encompass stereotypesabout a destination (Jenkins, 1999). According to Echtnerand Ritchie (1993), ‘‘holistic and unique images areparticularly important in determining how a particulardestination is categorized (stereotype holistic impressions)and differentiated (unique attractions, auras) in the mindsof the targeted markets.’’Destination image is formed by processing informationfrom various sources over time (Assael, 1984), which arecategorized into organic and induced (Gartner, 1993;Gunn, 1972). The organic sources (books, school curriculum, news, movies, actual destination visits, etc.) do nothave a vested interest in promoting a destination, while theinduced sources (travel brochures, advertisements, posters,videos, and, most recently, the Internet) are a means ofcommunicating marketing messages of the destination andsuppliers to a chosen travel audience. As Morgan andPritchard (2001, p. 275) pointed out, a country’s ‘‘clichédidentity can y be reshaped and given greater complexitythrough effective and consistent marketing.’’ Messagestransmitted by the induced sources contribute to theformation of the induced component of destination images,since, as Gartner (1989, p. 16) argued, ‘‘because ofeconomic and time cost, vacation travel to a distantdestination will usually be undertaken only after anextensive information search. In the absence of actualvisitation, destination images are formed through inducedagents.’’1.3. Internet as tourism marketing mediumThe Internet is becoming a prominent medium intourism marketing (O’Connor & Murphy, 2004; Oh,Kim, & Shin, 2004). It has been actively used by hotels(Baloglu & Pekcan, 2006; Fam, Foscht, & Collins, 2004;Scharl, Wöber, & Bauer, 2004), airlines (Chu, 2001), travel agencies (Ozturan& Roney, 2004), convention and visitorsbureaus (Yuan, Gretzel, & Fesenmaier, 2003) and otherdestination marketing organizations (Doolin, Burgess, &Cooper, 2002; Stamboulis & Skayannis, 2003). Travel andtourism services appear to be especially well suited forInternet marketing because of their intangibility as well ashigh price, risk, and involvement levels. On the demandside, an increasing number of people are using the Internetfor information search because the World Wide Webprovides more in-depth materials and richer contentcompared with conventional promotional agents (Govers& Go, 2003; Heung, 2004).The websites of American and Russian tour operatorsproviding travel to Russia were chosen as induced imageagents since: (a) the popularity of the Internet as a meansof advertising, promoting, and selling destinations isgrowing in both countries and; (b) coordinated efforts bythe Russian government and tour operators to promoteRussia have begun relatively recently, and Russian-madeprinted materials are scarce (‘‘Izvestia’’, March 11, 2003).Currently, the Internet is the least expensive and fastest
ARTICLE IN PRESSS. Stepchenkova, A.M. Morrison / Tourism Management 27 (2006) 943–956way for Russian officials and tour operators to reach theinternational traveler.2. Methodology2.1. Sample selectionRussia-related texts from 212 websites of US andRussian tour operators, official sources, and travel guideswere collected and stored for further content analysis as212 plain text documents. These files were regarded as asample from a population of all US and Russian websitespromoting trips to Russia. Due to the global nature of theInternet, there were cases that were difficult to classify aseither US or Russian, for which a new category of‘‘Partnership’’ was employed. The classification into US,Russian, or Partnership websites is described below: A company operating from the US with a website in the.com domain was considered a US company. The USsample included the websites of the US Tour OperatorAssociation (23), American Society of Travel Agents(13), cruise lines (18), top 50 travel agencies (6), as wellas 19 ‘‘independent’’ websites, and 24 Internet travelguides. All these websites with the exception of the‘‘independent’’ category were included into the sampleby going through the comprehensive lists obtainedthrough the associations’ websites or through the Yahoosearch engine.Websites on travel to Russia with English languagecontent in the .ru domain were considered Russian.Unfortunately, a complete list of the Russian companiescatering to international travelers could not be obtained.Websites were found through the search engines, as wellas from the websites of such organizations as TheMoscow Times, Moscow International Travel & Tourism Exhibition, official Moscow city website, Yellowpages, etc. Websites on travel to Russia in the domains.com, .net, and .org were considered Russian if aRussian company owned them, had a Russian postaladdress, and a predominantly Russian staff. TheRussian sample included 84 tour operator websites, 6websites of Russian official sources, and 13 travelguides.Websites that belonged to companies with officesboth in the US and Russia (and elsewhere in the world)with Russian staff were considered Partnerships (e.g.,White Nights: www.wnights.com). Companies withoffices in the US, Russian people on staff, and Russianagents in Russia specializing in travel to Russia werealso considered Partnerships (e.g., Sokol Tours: www.sokoltours.com).In the SPSS file, every website was coded as US, Russian,or Partnership; tour operator, official source, or travelguide; and by file length.9452.2. Proposed approach for destination image measurementof textual dataThe composite nature of the destination image constructpresents great challenges for its measurement. In addition,destination image measurement techniques are dependenton the original data format. Strong preference has beengiven to structured methods of image measurement whendata were obtained as answers to closed-ended surveyquestions (Echtner & Ritchie, 1991; Pike, 2002). Whilestructured methodologies have a number of advantagesover qualitative methods, they focus on particular destination attributes and generally neglect the holistic, or overall,aspect of destination image. Qualitative studies, on thecontrary, are advantageous to measuring the holisticaspect, but do not facilitate statistical and comparativeanalyses of destination images (Jenkins, 1999). Among thestudies dealing with content analysis of textual and/orpictorial materials are those by Andsager and Drzewiecka(2002), Dann (1996), Echtner (2002), Echtner and Ritchie(1993), MacKay and Fesenmaier (1997), Reilly (1990), andTapachai and Waryszak (2000). These researchers employed sorting and categorization techniques to identify thefrequencies of certain words, concepts, objects, or people,which for ease of further reference are referred to as‘‘meaningful words.’’ The most frequent meaningful wordsin these and other qualitative studies were treated as imagevariables, or dimensions, of the destination image construct. This study proposes a new approach for contentanalysis of textual data using the combination of long-onthe-market CATPAC II software (Woelfel, 1998) and thenewly developed WORDER program (Kirilenko, 2004),which allows effective identification of destination imagevariables and clustering them into image themes of moreholistic nature.The CATPAC II software ‘‘is a self-organizing artificialneural network that has been optimized for reading text.CATPAC identifies the most important words in a text anddetermines patterns of similarity based on the way they areused in text’’ (Woelfel, 1998, p. 11). CATPAC has beenused to conduct content analysis of political speeches,focus groups interviews, and marketing studies (Doerfel &Marsh, 2003; Schmidt, 1998), as well as in tourism-relatedresearch (Jeon & Morrison, 2003; Kim, Xiang, &Fesenmaier, 2005). However, CATPAC works with onlyone file at a time, which makes it unsuitable for analyzingmultiple individual responses or large samples of textualdata, like the websites in this study. WORDER, incontrast, is able to count the frequencies of up to 1000specified words in up to 1000 specified files in one run withtable-formatted output transferable to an SPSS file.To attain the first objective, a master list of 344destinations within Russia was compiled based on thestandard division of Russia into 13 recreational regions(Goskomstat, 2000). These destinations were counted inevery file of the sample using the WORDER softwareprogram and their frequencies were entered into SPSS.
ARTICLE IN PRESSS. Stepchenkova, A.M. Morrison / Tourism Management 27 (2006) 943–956946New integrated regional variables were computed byaggregating the original destinations by region, e.g., theFar East or Central integrated variables. Then t-tests wereconducted to compare frequencies of the regional integrated variables for the American and Russian samples.With regard to the second objective, the US and Russianfiles were combined into two respective groups and contentanalyzed by CATPAC, which resulted in the list of themost frequent words used in the textual data. The task ofthe researchers was to choose the most meaningful words,or image variables, setting aside such auxiliaries as articles,prepositions, pronouns, and/or words related to organizingtours (the auxiliary words were easily excluded fromcounting by placing them into an Exclude file). The finalset of image variables contained nouns, verbs, anddescriptors (i.e., adjectives and adverbs), since nouns areused to focus attention on attractions (e.g., museum,Baikal), verbs describe actions or tourism types (e.g.,rafting, sightseeing), and descriptors (e.g., ancient, exciting)create atmosphere (Echtner, 2002).Then WORDER obtained a response from every websitein the sample on the selected image variables. SinceCATPAC does not cope well with files of substantialsize—dendograms, which are supposed to show how theimage variables cluster into meaningful concepts, look‘‘like a mitten instead of a glove’’ (Woelfel, 1998, p. 25)—clustering the image variables into image themes was doneusing factor analysis. It was run on the combined sample todetermine the main aspects of the induced Russian image.2.3. Solving special issues of content analysisA laborious ‘smoothing out’ process regarding themeaningful words should be performed on the textual dataprior to using the CATPAC program (Schmidt, n.d.). Thecombination of CATPAC and WORDER software canefficiently solve the following issues of content analysis:1. Making spelling of the key words (i.e., destinations andimage variables) consistent in all text files. Even within asingle website the spelling may be inconsistent (e.g.,Saint-Petersburg vs. Sankt-Petersburg); across all thewebsites the issue is of enormous proportion.2. Changing multi-word concepts, e.g., ‘‘Peter the Great’’,into a one-word format for further counting. If not, itwould be difficult to distinguish how many times theword ‘‘great’’ referred to Peter the Great and how oftenit was counted with the meaning of ‘‘magnificent’’ or‘‘splendid.’’3. Changing plural nouns into the singular form (e.g.,‘‘palaces’’ into ‘‘palace’’) and counting synonyms as oneword (e.g., ‘‘monastery’’, ‘‘cloister’’, ‘‘convent’’, and‘‘abbey’’ were counted as ‘‘monastery’’) to reinforce theconcept.To indicate how to ‘‘smooth out’’ the original data, a listof key words was constructed. It included destinations,which were very likely to have different spellings, andimage variables as indicated by the initial CATPACanalysis of the original data. Table 1 gives an examplefrom the list of the key words. Every row corresponds to acertain key word with all its various forms. When either ofthese forms was encountered in the analyzed text, it wassubstituted by the spelling specified in the first column andcounted as such. In the counting process, WORDERcreates a new file where the specified substitutions are madeand does not change the original data.A number of tests were run to ensure that the results ofcounting by WORDER were consistent with that fromCATPAC II. The small inconsistencies encountered mighthave been due to the various approaches to counting ofspecial cases arising when converting different Web textencodings to a MS Word file, then to a .txt file. Otherwise,it was found that the results were generally consistent. Theoverall research design is depicted in Fig. 1.2.4. List of destinationsTo compile a master list of the destinations withinRussia to be counted, the accepted division of Russia into13 recreational regions as illustrated in Fig. 2 was followed.The main tourist destinations in every region, as indicatedby: (a) the Goskomstat reports (Goskomstat, 2000); (b) theofficial website of the Federal Tourism Agency of theRussian Federation; (c) UNESCO; (d) websites of administrative entities of the Russian Federation; and (e) theresearchers, were included.The master list of the destinations contained: (a) capitalsof federal entities; (b) large industrial centers; (c) oldRussian cities, architectural and historical places;(d) centers of Russian folk art; (e) cities along the mainwaterway systems; (f) major ports; (g) places connectedwith famous Russian people; (h) resorts and spas; (i) placesof famous battles; (j) famous railways and major citiesalong them; (k) biggest rivers, cruise and white water;(l) mountain regions and peaks; (m) nature reserves; (n)lakes; (o) UNESCO World Heritage List sites; (p) uniquelocations; and (q) destinations in neighboring countries,Table 1Sample from the list of terhoffRed SquareConcertPetergofConcertsPetergoffShowShows
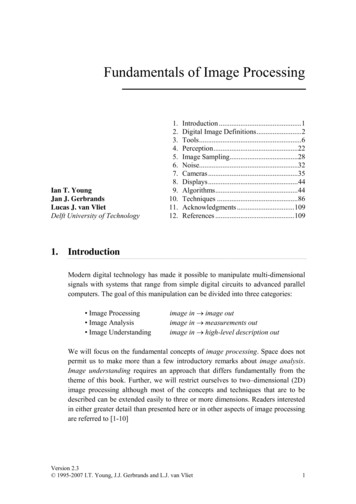
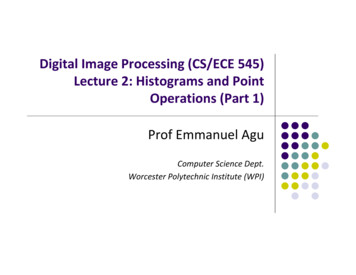
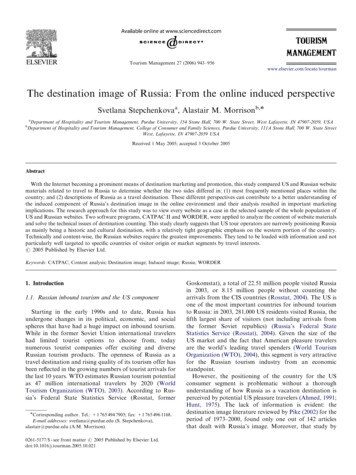
ARTICLE IN PRESSS. Stepchenkova, A.M. Morrison / Tourism Management 27 (2006) 943–956Originalfiles: textfromWebsitesList oftext files947List of keywords:most frequentwords to describeRussiaList ofkeywordsWORDER:Text SmoothingFunction:CATPACConsistent spellingExcludefileSynonymsSmoothed out sian/Partnership,affiliation, filesizeDestinationCounting FunctionData Analysis:Comparisons ofU.S./Russian destinationfrequenciesT-tests of integrateddestination variablesSPSSFactor Analysis of Russianinduced image variablesFig. 1. Research design.(e.g., ‘‘cruise’’) were also specified for counting byWORDER in every one of 212 files in order to betterinterpret the destination frequency results. These wordswere given the title of ‘‘help words.’’ Since manydestinations in the master list provided different forms oftourism, the help words gave a clearer indication of theprevalent tourism types, e.g., high mean frequencies ofYaroslavl, Uglich, Kostroma, and Samara destinationsalong with those of such help words as ‘‘cruise’’, ‘‘ship’’and ‘‘river’’ indicated that the cruises along the Volga riverwere being offered.3. ResultsFig. 2. Russian recreational regions. 1: Western; 2: North-Western; 3:Central; 4: Southern; 5: Povolzhje; 6: Urals; 7: Azov-Black Sea; 8:Caucasus; 9: Ob’-Altai; 10: Yeniseisky; 11: Baikal; 12: Far Eastern; and13: Northern.which are frequently included by tour operators intocombined tours, cruises, or railway journeys. The totalnumber of destinations selected was 344, many belongingto several categories. It is well known that after the RussianRevolution in 1917, many ancient Russian cities wererenamed after prominent communist figures, and startingat the end of the 1980s, the original names were given backto many of these locations. Nowadays, these cities aresometimes referred to by using both names together, e.g.,‘‘Vyatka, former Kirov.’’ To avoid double counting, thecurrent name was retained for the analysis. When alocation had equally used names, e.g., Zagorsk/SergiyevPosad, it was decided to count both occurrences but toassign them to one variable, in this case, Zagorsk.2.5. List of help wordsBesides the 344 destinations, 30 words, which indicatedtourism activities (e.g., ‘‘hunting’’, ‘‘rafting’’), main naturefeatures (e.g., ‘‘river’’, ‘‘mountain’’), and types of travel3.1. Estimation of richness of the destination poolAfter the text smoothing process, the frequencies of allspecified destinations were counted by WORDER andentered in SPSS. Out of 344 destinations, 43 had zerofrequencies, 45 destinations appeared in only one website,34 in only two websites. The destinations with zerofrequencies can be roughly divided into three main types: Industrial cities or administrative centers, which offervery little to the international traveler in terms ofarchitecture, arts, and scenery.Places with historical, religious, and/or cultural importance, far from main transportation centers and/orlacking in infrastructure.Local parks, which cannot compete with the well-knownnature reserves of Caucasus, Altai, Baikal, etc.It is natural to assume that not all the destinations thatare mentioned in the sampled websites were actuallyincluded into the master list for counting. To estimate therichness of the destination pool and to see how manydestinations might have ‘‘slipped through’’ undetected, the
ARTICLE IN PRESSS. Stepchenkova, A.M. Morrison / Tourism Management 27 (2006) 943–956948larger in Russian websites, which might indicate moreextensive destination coverage. For destinations commonto both lists, the standard deviation for the US websiteswas smaller for all destinations except Peterhof. Thismeans that the US tour operators gave a more balanceddescription of the main Russian places of interest. Therewas more agreement among US tour operators as to whatwere the best places in Russia to visit. The large standarddeviations of destination variables in the Russian websitesreflected the specialization of the Russian tour operatorson one or another destination or set of destinations. It isespecially evident with the Baikal–Irkutsk–Listvyanka–Olkhon destination set around Lake Baikal, and also true forKamchatka, Novosibirsk, Petrozavodsk, Vladivostok, Altai and Solovki, all of them being Siberian, Far Eastern, orNorthern destinations. However, there were relatively largestandard deviations in the US list for Kamchatka,Sakhalin, and the Amur River (Russian North and FarChao and jackknife statistical methods of extrapolatedrichness were used (Chao, 1987; Oksanen, 2002). Chao’sextrapolation of destination richness gave 330.78 destinations; first- and second-order jackknife methods gave345.78 and 356.78 destinations, respectively. Overall, thespecified pool of 344 destinations was considered to be avery good scope.3.2. Destination frequenciesThe top 25 destinations for 79 US and 84 Russian touroperator websites are given in Table 2; help words whichwere also counted in order to identify the dominanttourism types are also shown in italics. In round numbers,the average length of Russian-related texts on US websiteswas 5000 words with a standard deviation of 6700 words,while for Russian websites these parameters were 9700 and13,400, respectively. The destination means were generallyTable 2Top 25 destinations for US and Russian tour operator US—79 sitesMeanSDSt. dalSakhalinaBaikalZagorskTrans-SibaKostromaGolden RingFar 93.832.302.064.910.723.300.683.96Destinations that did not make Russian Top 25 list.Destinations that did not make US Top 25 sian—84sitesMeanSDMoscowSt. atkaFishingRaftingSkiingNature vkibGeyserUralsbBarnaulbValaambGolden 5.867.835.394.51
ARTICLE IN PRESSS. Stepchenkova, A.M. Morrison / Tourism Management 27 (2006) 943–956East) indicating that these destinations were described andpromoted by some US websites more heavily. A close lookinto the data revealed that several US tour operators, infact, specialized in travel to Russian Far East, and theirwebsites had very extensive coverage of the region and itsnatural resources.Two capitals, Moscow and St. Petersburg, were at thevery top of both lists with St. Petersburg having theabsolute largest mean in the US sample. Moscow, being theRussia’s official capital and main transportation center,was reflected by the largest mean in the Russian sample. Inthe US list, Helsinki and Finland appeared, whichconfirmed that the US tour operators offered many toursto Russia as part of longer itineraries and cruises. Thewords ‘‘cruise’’, ‘‘ship’’ and ‘‘Volga’’ along with destinations of Kizhi, Yaroslavl, Uglich, Kostroma, and Kazan,that are located along the main waterways, showed thatcruises and river tours were very popular with US touroperators. Peterhof, Pavlovsk and the number 26 destination of Tsarskoye Selo in the US list are all day-tripdestinations from St. Petersburg. They were especiallypopular with US tour operators, as well as Zagorsk, a daytrip destination from Moscow.There seems to be a consensus on both the US andRussian sides as to what are the best Russian cities fromthe historical and architectural standpoint. They are the socalled Golden Ring cities of Suzdal, Vladimir, Yaroslavl,Zagorsk, and Kostroma, as well as Novgorod. However,Vladimir’s results were most definitely inflated, since it wasimpossible to separate the city’s name from a widely usedRussian personal first name. Vladimir and Suzdal aregeographically close and often mentioned together, soVladimir’s true frequency should be closer to that ofSuzdal.The Trans-Siberian Railway (Trans-Sib) and the citiesalong it—Yaroslavl, Novosibirsk, Irkutsk, Vladivostokand, possibly, Kazan (strictly speaking, Kazan is not onthe Trans-Sib but there are tourist train routes which gothrough Kazan because of its beauty and historicalimportance)—also made the US top 25 list. In the US list,the number 34 destination was Beijing, which indicates thatsome US tour operators offered the combined TransSiberian and Trans-Mongolian journey, when from LakeBaikal a train goes to Beijing through the steppes ofMongolia to make this epic journey even more exotic.While the mentioned cities were also in the Russian list, thevariable Trans-Sib was only number 45 there.From this short list, it can also be concluded that theRussian side actively promoted hunting and fishing as wellas adventure travel, which was indicated by such destinations as Baikal, Kamchatka, Altai, and the
Tourism Management 27 (2006) 943-956 The destination image of Russia: From the online induced perspective Svetlana Stepchenkovaa, Alastair M. Morrisonb, aDepartment of Hospitality and Tourism Management, Purdue University, 154 Stone Hall, 700 W. State Street, West Lafayette, IN 47907-2059, USA bDepartment of Hospitality and Tourism Management, College of Consumer and Family Sciences, Purdue .