Transcription
Key Performance IndicatorsFall2021InstitutionalEffectiveness
ContentsP.1P.7P.10P.13Access, Opportunity & SuccessFacultyProductivityFinances
Section 1Access, Opportunity & nrollmentRetention RatesGraduation RatesNet PriceFirst Generation & Minority
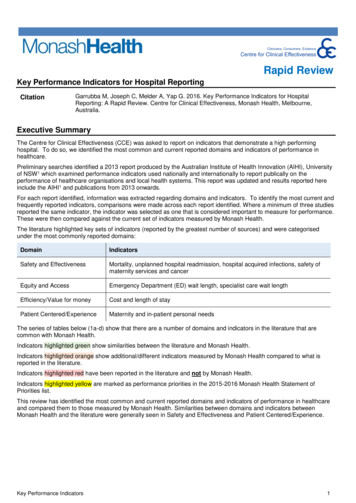
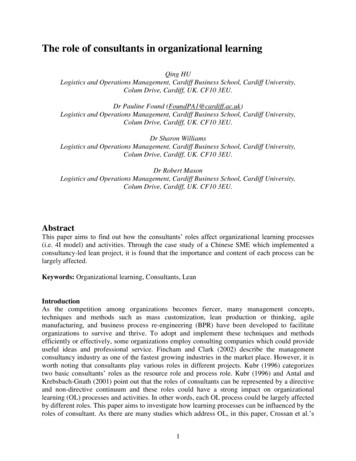
Applications, Acceptances & Yield RatesApplications and Acceptances8,1207,4398,1217,4307,0451,4431,305Fall 2017Fall 2018Completed Apps6,7037,2171,7481,826Fall 2019Fall 2020Admitted StudentsCompleted AppsAdmitted StudentsMatriculatesAcceptance RateFreshman Yield8,061Acceptance & Yield Rates7,21892%87%6,9031,69619%19%Fall 2021Fall 2017Fall 2018Matriculates96%90%90%26%25%25%Fall 2019Fall 2020Fall 2021Acceptance RateFreshman YieldFall 2017Fall 2018Fall 2019Fall 2020Fall 25%96%25%1
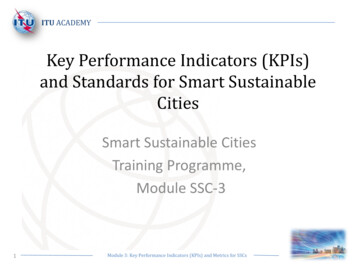
Total 6,5426,493285257239227243Fall 2017Fall 2018Fall 2019Fall 2020Fall 2021All StudentsUndergraduatesGraduate Students2
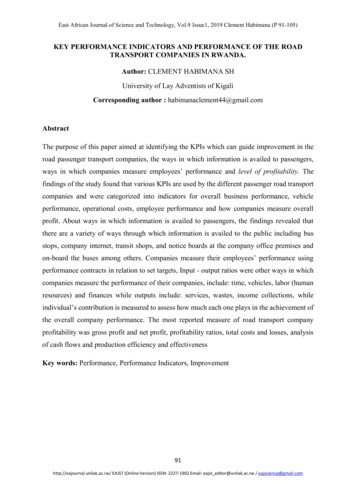
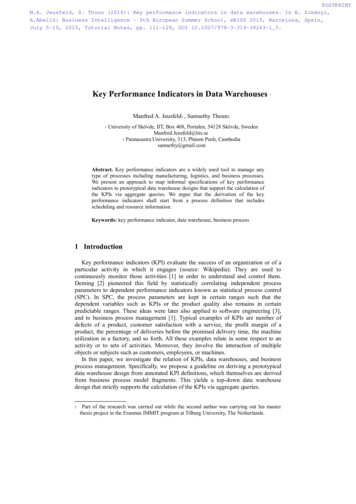
Retention Rates85.4%63.2%Fall 201187.3%86.9%88.7%67.5%71.0%69.0%70.5%Fall 2012Fall 201383.7%Fall 2014Fall 2015Full-time freshmen Fall to Spring Retention85.8%88.4%66.0%67.8%Fall 2016Fall 201788.4%89.1%71.5%68.6%81.1%62.1%Fall 2018Fall 2019Fall 2020Freshman to Sophomore Retention3
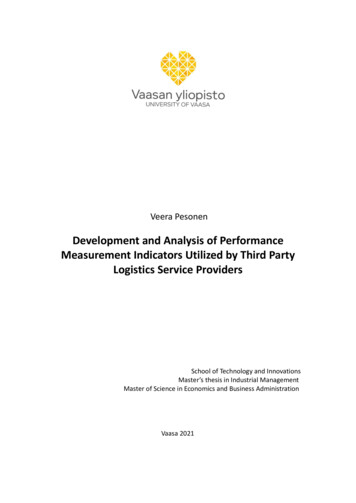
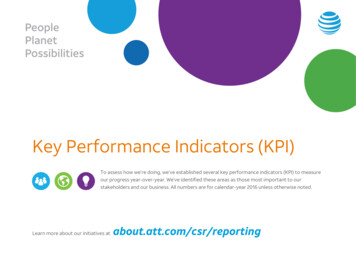
Six-Year Graduation Rates for Full-time Freshmen41.0%40.7%Fall 2006Fall 200742.9%Fall 200841.7%Fall 200944.2%43.8%Fall 2010Fall 201148.1%49.9%50.1%50.9%Fall 2012Fall 2013Fall 2014Fall 20154
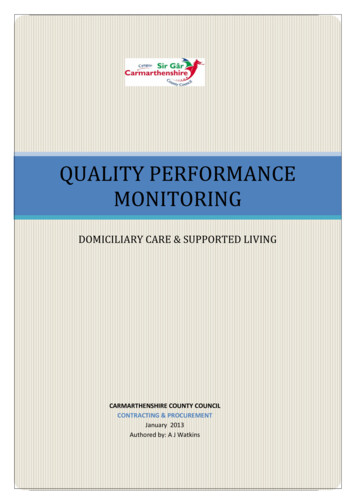
Net Price 29,530FY 2016 31,484 31,269FY 2017FY 2018 32,111FY 2019 28,568FY 2020The HEA defines institutional net price as “the average yearly price actually charged to first-time, full-time undergraduate studentsreceiving student aid at an institution of higher education after deducting such aid.” Essentially, net price moves beyond an institution’s“sticker price” and provides students and families with an idea of how much a first-time, full-time undergraduate student who wasawarded aid pays to attend a particular institution after grant or scholarship aid is subtracted from the published cost of attendance.5
First Generation & Minority Students36%38%42%17%16%17%Fall 2017Fall 2018Fall 2019Minority Students47%48%20%19%Fall 2020Fall 2021First Generation Students6
Section 2FacultyP.7 Faculty CountsP.8 Student/Faculty RatiosP.9 Tenure Status
Faculty 6Fall 2017Fall 2018Fall 2019Fall 2020Fall 2021Total FacultyPart-time FacultyFull-time Faculty7
Student/Faculty RatiosStudent to Full-time Faculty RatiosFall 2017Fall 2018Fall 2019Fall 2020Fall 202127:125:127:126:127:1Full-time Faculty to FTE Student RatioFall 2017Fall 2018Fall 2019Fall 2020Fall 202112:112:112:112:113:18
Tenure Status18518965174174168615753512228283327Fall 2017Fall 2018Fall 2019Fall 2020Fall 2021TenuredTenure-trackNot Tenured9
Section 3ProductivityP.10 Class SizeP.11 Credit Hours/Faculty RatiosP.12 FTE Enrollment
Total Average Class Size17.9418.03Fall 2017Fall 201818.7618.4618.80Fall 2019Fall 2020Fall 202110
Credit Hours to FT and FTE FacultyCredit Hours to Full-time FacultyFall 2017Fall 2018Fall 2019Fall 2020Fall 2021372:1346:1375:1369:1369:1Credit Hours to FTE FacultyFall 2017Fall 2018Fall 2019Fall 2020Fall 2021170:1168:1170:1175:1175:111
FTE 6,186239207186195205Fall 2017Fall 2018Fall 2019Fall 2020Fall 20216,648UndergraduateGraduateTotal12
Section resTuition Share of Core RevenueLong Term Investments per FTEInstitutional AidLoan Default Rates
Total Revenues 254,847,572 214,384,430FY 2016 196,458,100FY 2017FY 2018 179,353,531 189,751,154FY 2019FY 202013
Total Expenditures 200,392,396 197,515,208 186,802,780 184,801,806 184,832,996FY 2016FY 2017FY 2018FY 2019FY 202014
Tuition Share of Core Revenue89%87%92%78%69%FY 2016FY 2017FY 2018FY 2019FY 202015
Long Term Investments Per FTE 44,965 43,319 42,637FY 2018FY 2019FY 2020 35,010 26,183FY 2016FY 201716
Total Unrestricted Institutional Aid 62,470,067 50,856,311 35,760,427 35,129,068 36,037,836FY 2017FY 2018FY 2019FY 2020FY 202117
Loan Default Rates9.1%9.4%FY 2013FY 20148.9%FY 20159.4%9.2%FY 2016FY 20173 Year Default Rate18
Institutional EffectivenessFA21Key Performance Indicatorsabout.colum.edu/effectiveness
Access, Opportunity & Success P.6 First Generation & Minority P.4 Graduation Rates. . Fall 2015 Fall 2016 Fall 2017 88.7% 85.8% 67.8% 88.4% Fall 2018 71.5% Fall 2019 68.6% 89.1% Fall 2020 62.1% . receiving student aid at an institution of higher education after deducting such aid." Essentially, net price moves beyond an institution's