Transcription
C REDIT R ISK 2020 & B EYOND:ANSWERS TO C RITICALQUESTIONSDr. David M. KohlProfessor Emeritus, Agricultural and Applied EconomicsMember of Academic Hall of Fame, College of Agriculture & Life SciencesVirginia Tech, Blacksburg, VA(540) 961-2094 (Alicia Morris) (540) 719-0752 (Angela Meadows) sullylab@vt.eduMacro Clinic Video Blog: www.compeer.com/educationDecember 12, 2019Road Warrior of Agriculture: www.cornandsoybeandigest.comAg Globe Trotter: www.northwestfcs.comDave’s GPS & Dashboard Indicators: www.farmermac.com
Low Margin Era technology- supply exceeds demandworldwide- new resources in productionweather and climate changesbase hits vs. home run profits & cash flowmanaging expectationsfocus on fiduciary fundamentals2
Volatility of Profits/Cash Flow trade negotiations and expectationsweather/African swine flupolitical uncertaintyconsumer demand shiftsstructural changes in industry3
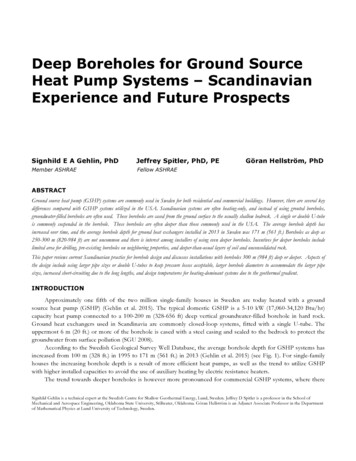
Generational Financial Performance ComparisonsSuper Cycle & Post Super Cycle2012Financial MetricSuper CycleMedian10 to 40 YearsUnder 10 years2018Post SuperCycle Median10 to 40 yearsUnder 10 yearsNumber of Farms2,8817442,451836Net Farm Income 197,828 90,865 30,752 TO45.355.321.535.9Working Capital/Revenue39.9%27.6%19.0%19.8%Term Debt Coverage3.373.180.941.63Debt/Asset Ratio35%54%38%58%NFI 13,162 17,891 16,013 28,728Family Living 53,536 36,959 49,987 32,996Capital Expenditures 126,770 69,333 49,000 28,705Machinery/Equip. Invest Per Acre 558 290 670 231Term Debt/EBITDA1.10:1.01.11:1.02.59:1.01.63:1.0Source: FINBIN, https://finbin.umn.edu/4
Super Cycle & Post Super CycleGame Critique – Youth Vs. ExperienceExperienced Farmers/RanchersYounger Farmers/Ranchers term debt to EBITDAincreased dramatically maintain operating margins have stronger assetturnover ratios preserve working capital have much stronger termdebt coverage ratio postsuper cycle more off farm income less family living withdrawals have half as muchmachinery investment peracre refinance losses and term debtdecrease EBITDAVS. have much stronger equityposition, debt to asset ratio,under 40% representsresiliency capital expenditures strong,good times have twice as muchmachinery investment peracre5
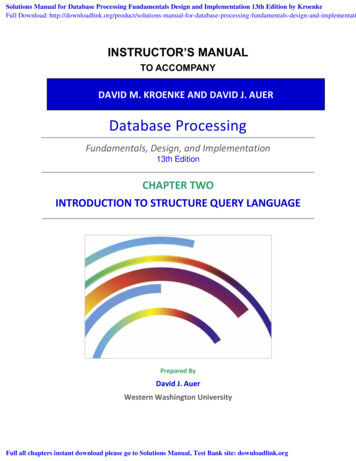
Business IQ:Spectrum of Performance PossibilitiesHigh CollateralHigh WorkingCapitalCode YellowCode Green20-34 B. IQLow Profits &Cash FlowProactiveCode RedLow Equity &Low EfficiencyB. IQ Business IQ35 B. IQReactive 20 B. IQHigh Equity &High EfficiencyHigh Profits &Cash FlowCode OrangeLow Collateral20-40 B. IQLow WorkingCapital6
Paddling - Upper Right Quad.Code Green - Disciplined Growthstrong business IQ score of 35 proactive manager 60% equityterm debt to EBITDA 2.5:1operating expense/revenue ratio (excludinginterest and depreciation) 75% working capital to expenses 30% 7
Treading Water- Upper Left Quad.- Limited Growthmoderate business IQ score of 20-3470% equityworking capital to expenses 20%operating expenses/revenue ratio (excludinginterest and depreciation) 80% competitive issues in industry 8
Paddling or Bailing Water – Lower Rt.Code Orange - Excessive GrowthPaddling towards Green business IQ score 38 ROA averages 6% 50% equity modest family livingexpenses dimensional revenuestreams earns and turnsBailing towards Red business IQ score of 28 profit issues- ROAaverages 1% 50% equity high living costs specialized revenuestreams lack earns & turns9
Bailing Water -Lower Left Quad.Code Red- Partial or Total Liquidation poor business IQ score of 20reactive manager 40% equityworking capital is negativeoperating expense to revenue over 90%excessive family living expensesvictims & “know-it-alls”10
Financial Trip Points split lines of credit 10 lines term debt/EBITDA 6 to 1 or more 3 to 5 years earnings on average burn rate on core equity 2.0 years operating expense/revenue ratio excludinginterest & depreciation above 95% (three yearaverage) with no non-farm income victim, know it all attitude concerning businessimprovement11
Business IQ: Management FactorsCritical Questions for Crucial ConversationsCustomer ChecklistGreen (3-4 points*)Yellow (2 points)Red (1 point)1.Knows cost of productionWrittenIn headNo idea2.Knows cost of production by enterpriseWrittenIn headNo idea3.Goals- business, family & personalWrittenIn headNo idea4.Record keeping systemAccrualSchedule F (one & done)No idea5.Projected cash flowWrittenIn headNo idea6.Financial sensitivity analysisWrittenIn headNo idea7.Understand financial ratios, break evensWrittenIn headNo idea8.Work with advisory team and lenderYesSometimesNever9.Marketing plan written and executedYesSometimesNever10.Risk management plan executedYesSometimesNever11.Modest lifestyle habits, family living budgetYesSometimesNon existent12.Written plan for improvement executed &strong people managementYesSometimesNon existent13.Transition plan/Business Owner planYesWorking on planNon existent/controversy14.Educational seminars/coursesYesSometimesNever a Points: Progressive Business may receive 4points for #2,6,7,8,14 Struggling Business attemptingturnaround may receive 4 points for#3,5,8,11,12ScoreOverall Analysis35-50Strong management rating & viability20-34Moderate risk & viability; will most likely show previous refinancing 20High risk & lack of long term viability12
Recent Business IQ ScoresGroupScoreTEPAP38.5Crop Insurance29.5Farm Credit Associations36.5Median Score32FSA22Bank Sponsored Events3613
Trouble Shooting MatrixInsufficient Repayment CapacityCut Business CostReduce Four Largest Expenses: Crop, Feed, Labor, ?Non-Farm RevenueJob Stability/Availability, Job CostJob Earnings, Skills, Time ManagementIncrease IncomeSell Capital Assets, Deferred Taxes,Increase Production, Increase PriceCut Living WithdrawalsPurchase Financial Software, Small Cost ContainmentRestructure DebtLonger Term, Interest Only,Principal/Interest DeferredCapital InfusionEquity Capital, Family Capital,Supplemental Cash FlowBankruptcyVoluntary, Involuntary,Chapter 7, 11, 12, 13
The Burn Rate – Working CapitalAdversity vs. OpportunityDefensive “Adversity Oriented”Current Assets: 2,000,000Offensive “Opportunity Oriented”Current Assets: 1,200,000-Current Liabilities: 1,000,000-Current Liabilities: 500,000 Working Capital: 1,000,000 Working Capital: 700,000Projected Loss: 500,000Opportunity: Buy a farm with 300,000working capital leaves 400,000 workingcapital.Working Capital # of yearsProjected Loss 1,000,000 2 years 500,000Red 1.0 Year VulnerableYellow 1.0-3.0 Years ResilientGreen 3.0 Years AgileDebt Service (Existing & New)Payments: 100,000Working Capital # of yearsTotal Debt Service Payments 400,000 4 Years 100,000Red 2.5 Years VulnerableYellow 2.5-5.0 Years ResilientGreen 5.0 Years Agile
Burn Rate on Core EquityAdversity vs. Opportunity(Assume 500,000 Earnings Loss & 20% land value decline)Assets- tionRemainingPrincipalEquity ExcessReserves1. 6,000,000 4,800,000XX70%70% 4,200,000 3,360,000- 2,000,000 1,160,0002. Intermediate 3,000,000X60% 1,800,000- 800,000 1,000,0003. Current 1,650,000X80% 1,320,000- 860,000 460,000Long Term(20% Decline onLand) 2,200,000 2,200,000Burn Rate: Land & Long Term Equity Reserves Excess Reserves 2,000,000 4.0 YearsEarnings Loss¹ 500,000Earnings Loss¹ 500,00020% DeclineBurn Rate: Land & Long Term Equity Reserves Excess Reserves 1,160,000 2.32 Years¹ Assume Earnings Loss of 500,000Red 4.0 Years VulnerableYellow 4.0-7.0 Years ResilientGreen 7.0 Years Agile16
Bridge or Pier Concept before: Term Debt 1,000,000 4 to 1EBITDA 250,000after:Term Debt 1,250,000 5 to 1EBITDA 250,000no improvement in EBITDArefinancing using land equitydebt levels higherowner equity loss, more debt servicewater is deeper near the end of pierthe longer the pier, then the narrower the pier17
Worst Lending Experiences fraud: missing grain, livestock and/or machineryexcessive family living based upon good timesattempting to bash an existing customerdidn’t follow the plancontinued refinances, switched lendershidden account payablesdidn’t use line of credit properlyrumors that were verifiedinherited business debt free/next generationbroke18
Best Lending Experiences family business, transition old to young- lender transition at thesame time young producer FSA/bank now 10 years later, million in equity 5-4550 program successfully developed and executed marketing plan followed a business plan, very successful advocate for otherproducers used financial benchmarking as a tool to improve the business developed a young producer educational program- investmentpaying off a decade later assist a customer work out of the business without losing all theequity19
Dr. David M. Kohl. Professor Emeritus, Agricultural and Applied Economics. Member of Academic Hall of Fame, College of Agriculture & Life Sciences. Virginia Tech, Blacksburg, VA (540) 961-2094 (Alicia Morris) (540) 719- 0752 (Angela Meadows) sullylab@vt.edu . December 12, 2019
![No, David! (David Books [Shannon]) E Book](/img/65/no-20david-20david-20books-20shannon-20e-20book.jpg)