Transcription
Key Performance Indicators (KPI)To assess how we’re doing, we’ve established several key performance indicators (KPI) to measureour progress year-over-year. We’ve identified these areas as those most important to ourstakeholders and our business. All numbers are for calendar-year 2016 unless otherwise noted.Learn more about our initiatives atabout.att.com/csr/reporting
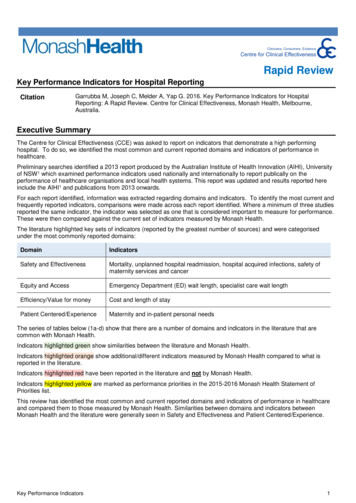
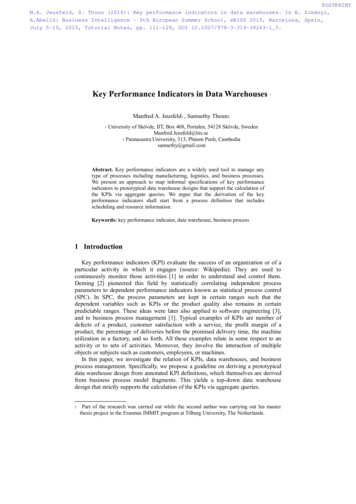
20122013201420152016Nearly 20B 21.2B 21B 21B 22.4B 1.3M 4MNearly 6M 7.5M 15MInvestment in Network Disaster Recoveryprogram — cumulative since 1992 600M 600M 600M 600M 600MWorking hours spent on Network DisasterRecovery — cumulative since 1992125,000135,000 135,000 140,000 145,0001.1M1.2M1.1M1.2M1.1M5555535049Percent retention of total 50-stateworkforce: Women8786888590Percent retention of total 50-stateworkforce: People of color8888908892PeopleNetwork ReliabilityNetwork ReliabilityInvestment in wired and wireless networksResponsible Use of TechnologyPromoting SafetyCumulative pledges to keep eyes on theroad and not on the phone through the ItCan Wait campaignDisaster ResponseDisaster RecoveryWorkforceEmployee Health & WelfareNumber of employees, retirees anddependents afforded health and welfarebenefitsProvide Quality JobsPercentage of union-representedemployeesEmployee Retention RateAT&T 2016 Annual Sustainability Update Key Performance Indicators2
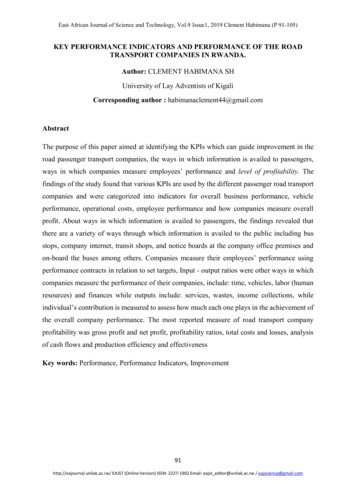
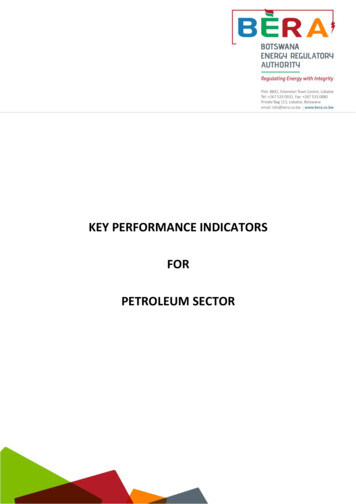
20122013201420152016Amount invested in direct employee trainingdevelopment programs;development reviews 280M 280M 250M 230M 250MAmount invested in tuition assistance for bothmanagement and non-management employeesNearly 27MNearly 25M 30M 31M 34MPercent of employees receiving regularperformance and career development reviews100100100100100Percent completion rate on Code of BusinessConduct training for all en(Percent of total U.S. workforce)3836353332People of color(Percent of total U.S. workforce)3940414243Women(Percent of total U.S. management)3837373735People of color(Percent of total U.S. management)3233353437Spend with minority, women, service-disabledveteran and LGBT business enterprises 12.8B 15.5B 16.5B 13.7B 14.2BPercent of total spend with minority, women,service-disabled veteran and LGBT yee TrainingEmployee SafetyAT&T’s OSHA total recordable occupationalinjury and illness rate (per 100 employees)Workforce DiversitySupply ChainSupplier Diversity1Excluding content & programming, spend with minority, women, and service- disabled veteran and LGBT business enterprises is 24.30%.AT&T 2016 Annual Sustainability Update Key Performance Indicators3
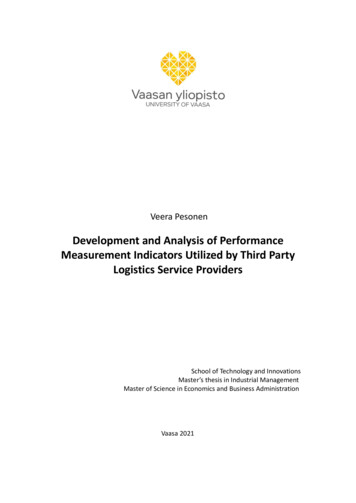
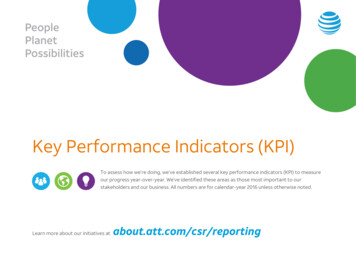
20122013201420152016Average number of patents (U.S. andforeign) received per business day 3 3 4 5 5Cumulative investment in development ofnew ideas generated through TheInnovation Pipeline, cumulative since 2009 35M committed 38M committed 44M committed 44M committed 45M committedCumulative number of app prototypesdeveloped at AT&T Hackathons 450 1,000 1,500 1,000 1,0006263 70 ons CO2-e/ million revenue69.9371.1870.3259.0554.20mtons CO2-e/Petabyte of novationSupply ChainSupply Chain ScorecardAverage score of top suppliers on thebalanced C&S Scorecard (percent)Greenhouse Gas (GHG) EmissionsCarbon FootprintDomestic company-wide greenhouse gas(GHG) emissions (metric tons CO2equivalent)Domestic and international company-widegreenhouse gas (GHG) emissions (metrictons CO2-equivalent)GHG IntensityAT&T 2016 Annual Sustainability Update Key Performance Indicators4
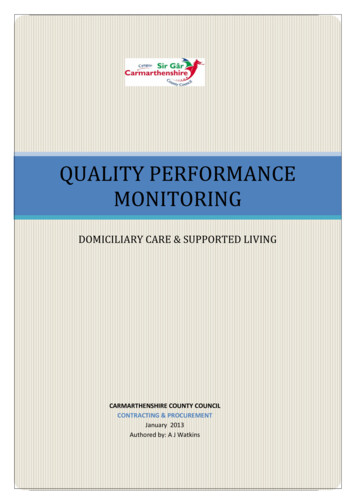
5,225WaterWater FootprintGallons of water used for domesticoperationsWater IntensityGallons/ thousand revenueGallons/Petabyte network traffic2FleetFleet OperationsPercent decrease in AT&T fleet greenhousegas emissions (2008 baseline)312PaperPaperless BillingApproximate total number of paperlessbilled customers18.7M20M20.9M21.2M26.6MWeight of paper purchased for AT&T MailingSolutions (pounds)26.2M22.9M21.4M19.2M25.7MPercent decrease in weight of paperpurchased for AT&T Mailing Solutions from2010 baseline34.84346.852.350.3Paper Consumption2Prior to 2015, AT&T reported as Gallons/Terabyte network traffic.In 2016, AT&T re-focused its strategy to include a new goal to lower AT&T fleet emissions by 30% by 2020 from our 2008 baseline. Moving forward, we are now tracking emissions reductions related tofleet rather than total alternative fuel vehicles by type. Please see our Company Fleet and Transportation issue brief for more details.3AT&T 2016 Annual Sustainability Update Key Performance Indicators5
20122013201420152016Pounds of network “scrap” materials kept outof landfills47.3M48.7M48M54M 51.1MPercent of operational waste handled by theInvestment Recovery Center that is recycled 94 95.696 96 96Tons of office activity material (paper,cardboard, glass, aluminum, plastic) divertedfrom landfill24,45520,75029,29636,87426,411Percent of non-hazardous office wastediverted from landfills2128 292629.5Tons of waste managed by the AT&TResource Recovery Center (includinguniversal and hazardous waste)12,70014,00024,30013,00034,542Percent of such waste recycled 70 51786986Number of computers, monitors, servers andother equipment that were donated, recycledor reused77,000 79,000 91,000 100,000 68,000Number of cell phones reused or recycledApprox. 3.1MApprox. 4.5MApprox. 4.3MApprox. 7.3MApprox. 6.98MWasteSolid Waste from Network Infrastructureas Managed by Global Supply ChainSolid Non-Hazardous Waste from OfficeActivityRegulated WasteE-wasteNumber of U-verse set-top boxes (STBs)reused or recycledApprox. 2.8MNumber of STBs (DIRECTV) refurbished 9MNumber of STBS (DIRECTV) recycledApprox. 2.7MAT&T 2016 Annual Sustainability Update Key Performance Indicators6
20122013201420152016Intensity of data carried on our network (MWhelectricity/Petabyte network traffic)281233186145139Energy intensity (MWh electricity/ olar fuel cell capacity (MW)1119.822.525.939.9Solar fuel cell production (kWh)68.3M134.6M154.3M187.8M298MEnergy projects implemented5,6004,5003,90015,05025,000Annualized energy savings from energyprojects 65M 40M 84M 119.1M 101M14.7M15.0M15.1M15.1M15.4MEnergyEnergy Intensity4Alternative EnergyEnergy ProjectsElectricityTotal electricity use (MWh)4The values in this table for 2014 and 2015 are restated Energy Intensity values, which previously read 189 MWh/Petabyte and 129 MWh/Petabyte respectively. This is due to U-verse estimationmethodologies and data sources that have evolved from providing very coarse estimates, since inception and through 2015, to use of the IP Analytics portal in 2016. As of January 2016, U-verse data is nowmore accurate than it has ever been, though it is actually much lower than anticipated. The improved U-verse TV traffic data methodology has now been used regressively to recalculate the EnergyIntensity that would have been reported from January 2014 to present. Some portions of the traffic data volume are measured, while others must be estimated. As AT&T continually works to transformand innovate its networks, so to, the methods for measuring and estimating traffic data volume have evolved and improved. This more accurate view of network traffic data volume is the reason that wesee the 2016 Energy Intensity value not comport to the same trajectory as in prior years.AT&T 2016 Annual Sustainability Update Key Performance Indicators7
g in Our CommunitiesAmount of corporate, employee, social investment and foundation givingArts and Culture 7.8M 7.8M 4.9M 6.5M 6.2MCivic and Community 25.4M 19.4M 21.5M 29M 34.1MEducation 64.3M 64M 68.9M 87M 67.9MHealth and Human Services 33.9M 38.9M 31.6M 34.1M 31.1MTotal 131.4M 130M 126.9M 156.6M 139.3MNumber of hours volunteered throughemployee and retiree volunteer programs 5.8M 5.3M 5.6M 5.4M 5.4MDollar amount associated with volunteerism5 129M 118M 126M 124M 129M 33M 35M 36.4M 37.45M 40.8MVolunteerismActivate Employees to VolunteerEmployee GivingAmount of employee giving pledged throughannual Employee Giving CampaignThe financial equivalent is determined by using 23.07 per volunteer hour, which is based on the 2015 industry standard from Independent Sector, a leading nonprofit organization that determines thefinancial equivalent for a variety of volunteer initiatives.5AT&T 2016 Annual Sustainability Update Key Performance Indicators8
Key Performance Indicators (KPI) To assess how we're doing, we've established several key performance indicators (KPI) to measure our progress year-over-year. We've identified these areas as those most important to our stakeholders and our business. All numbers are for calendar-year 2016 unless otherwise noted.