Transcription
Creating Reports inTOPdeskumTech100 Administration Bldg., Memphis, TN 38152Phone: 901.678.8888Email: umtech@memphis.eduumTech Website7/6/2022
Table of ContentsGetting Started . 3Creating Reports . 3Method 1. 3Method 2. 4Scheduling a Report. 12Under the General tab . 12Under Recipients tab . 13Creating a Duration Report . 15Call the ITS Service Desk (901.678.8888) any day of the week! . 22Email umTech . 22Important Links . 22umTech Pa g e 1
PurposeThis training material highlights how to create reports in the TOPdesk ticket system.AudienceUniversity of Memphis staff responsible for entering and managing incident andservice requests with in TOPdeskumTech Pa g e 2
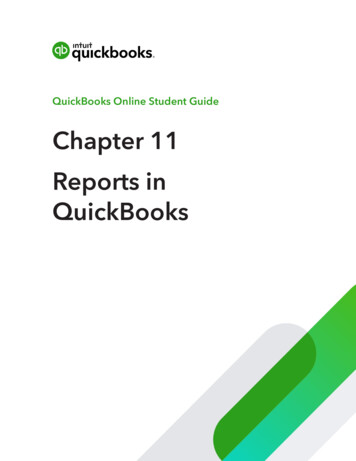
Getting StartedCreating ReportsThere are two methods of creating reports.Method 11. From the TOPdesk menu, Select New.2. Then select Report.3. Choose Incidents.umTech Pa g e 3
Method 21. From main pages, select Dashboard.umTech Pa g e 4
2. From the Navigator, select Incident Management.3. Select Report: incidents.umTech Pa g e 5
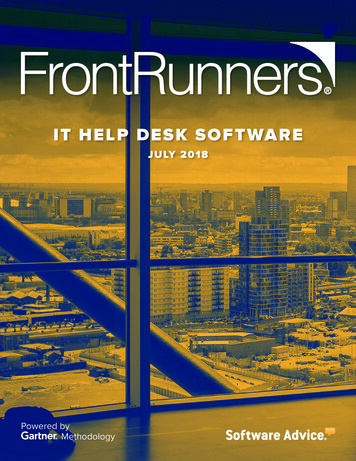
This will open the Report Wizard. There are 5 steps involved when using the ReportWizard.4. Once opened, the Report Wizard automatically takes you to Step 1 of 5:Filters to:A. You can choose from built in (A) Selections or the (B) Date Filter.umTech Pa g e 6
B. Options when choosing the (B) Date Filter.After you make your selection, click Next.umTech Pa g e 7
5. In Step 2 of 5: Fields, choose the fields you wish to report; choose from thefollowing selections: Number, Services, Time Spent, Duration, Costs, andFeedback.Click the drop-down arrow beside them to reveal choices from each.umTech Pa g e 8
umTech Pa g e 9
Make your selections and click Next.6. In Step 3 of 5: Groups, choose the groups to filter in Group 1, 2, and 3.Note: For each group you can also choose how the data is sorted.Choose how each filter is sorted and click Next.umTech Pa g e 10
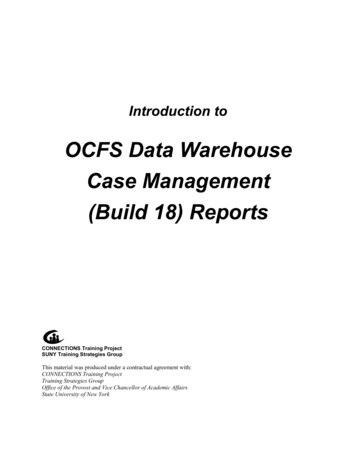
7. In Step 4 of 5: Display Options, choose the method to display from the icons.Choose from: Table, Table with details, Dynamic Table, Pie Chart, Bar Chart, orLine Graph. Click Preview to view how the data will look.Note: Each chart is interactive and can be drilled down in views.umTech Pa g e 11
8. Next, save your report. Create a name, description, and in “To be used by”,choose the permission level of your report. Click Save. Once the report is savedyou can view it on your dashboard. You will need to add the Report/KPI widget toyour Main Pages. (See Adding Widgets section)umTech Pa g e 12
Scheduling a ReportScheduling a report will allow you to email a report in an Excel or PDF document.Under the General tab1. Click Schedule, choose the report you want to email, choose who the email will besent from.2. Choose output type (Excel or pdf).3. Choose a subject title for the email and type your message.4. Choose who to send the report to. Under Execute, choose the radial button tosend the report to a particular operator or yourself (recipient). Note: Reports canbe sent to anyone in the TOPdesk system who is an operator.umTech Pa g e 13
5. Choose the schedule for the emailed report where you will choose the interval andthe run.Under Recipients tab1. Next, click on the Recipients tab.2. Choose which Persons or Operators will receive the report.3. When choosing Operators, you can use the Links Wizard to choose who to sendthe report to.Note: The Links Wizard allows you to search the system for the operator youwish to send the report.umTech Pa g e 14
4. Once you find the person to send the report to, click Link.A message will appear on screen that tell you a person has been linked toscheduled report.5. Click OK.umTech Pa g e 15
Creating a Duration ReportThere are also two types of New reports implemented with this version of TOPdesk,The Duration Report and the Distribution Report. These can be accessed through theDashboard Incident Management.1. For a Duration Report, click the Duration Report widget. This will open a new tabfor the Duration Report.umTech Pa g e 16
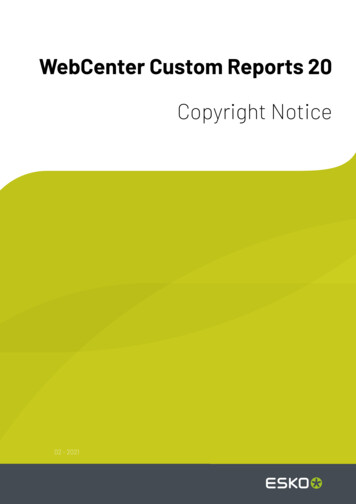
2. Here you select the period, filter tasks, and define the duration of the report.1. Select period: Tasks options are Created in,Completed in, and Closed in. Period options are Year, Quarter,and Month.Note: If you select Quarter or Month,another drop-down menu will appear foryou to choose which Quarter/Month. Year options are the last twoyears.2. Filter tasks: Branches options are the UofMcampuses. Call Types options are Issue,Request, and Question. Categories options are the sameas Incident categories. Priorities options are Critical.High, Medium, Low, and LongTerm.3. Define Duration: Statuses options are the same asIncident status options.umTech Pa g e 17
3. Click Create Report.You will see a report with the criterion you selected in a graph and in a table. Youcan drag your cursor over the results on the graph to display the correspondinginformation in the table.4. From here, you can change the selections you made. If you change the criterion,click Create Report again and you will see a report with the updated information.Note: If you change the criterion you will no longer see the report youpreviously created.umTech Pa g e 18
Creating a Distribution Report1. For a Distribution Report, click the Distribution Report widget. This will open anew tab for the Distribution Report.umTech Pa g e 19
2. Here you select, the period, filter tasks, define duration, and choose the grouping(Status or Operator Group) of the report.1. Select Period: Year options are the last twoyears.2. Filter Tasks: Branches options are the UofMcampuses. Call Types options are Issue,Request, and Question. Categories options are thesame as Incident categories. Priorities options are Critical.High, Medium, Low, and LongTerm.3. Define Duration: Statuses options are the sameas Incident status options. Operator Groups options arethe same as Incident OperatorGroups.4. Choose grouping: Selecting Status or OperatorGroup determines how theinformation in the report ispresented.umTech Pa g e 20
3. Click Create Report.You will see a report with the criterion you selected displayed in a graph, a table,and a legend. You can drag your cursor over the results in the graph to display thecorresponding information in the table.4. From here, you can change the selections you made. If you change the criterion,click Create Report again and you will see a report with the updated information.Note: If you change the criterion, you will no longer see the report youpreviously created.umTech Pa g e 21
Locating Help ResourcesumTech offers support to faculty, staff, and students. Upon completing the trainingcovered in this course, faculty, staff, and students can receive additional training helpand resources. Such help can be located as follows:Service Desk RequestSubmitting a Ticket Login URL:o Here is a link to our service desk ticketing systemo After logging in, choose the link Request Help or Services.o Choose Request Help or Services.Call the ITS Service Desk (901.678.8888) any day of the week!(Excluding Some Holidays) The ITS Service Desk hours will be as follows:o Monday – Friday 8:00 am – 8:00 pmo Saturday 10:00 am – 2:00 pmo Sunday 1:00 pm – 5:00 pm You can contact the Service Desk for assistance with technical login problems orissues. Incoming calls after hours will be handled by voicemail services. If yourequire assistance after 8:00 p.m., please leave a message or submit a servicerequest. Messages will be checked regularly and receive priority response the followingbusiness day. You may also email umTech, umtech@memphis.edu (using this emailwill automatically generate a help desk ticket).Important Links Explore the umTech Website Search Our Solutions PageumTech Pa g e 22
Scheduling a report will allow you to email a report in an Excel or PDF document. Under the General tab 1. Click Schedule, choose the report you want to email, choose who the email will be sent from. 2. Choose output type (Excel or pdf). 3. Choose a subject title for the email and type your message. 4. Choose who to send the report to.