Transcription
Zhu et al. Nutrition & Metabolism(2020) EARCHOpen AccessThe polyphenol-rich extract fromchokeberry (Aronia melanocarpa L.)modulates gut microbiota and improveslipid metabolism in diet-induced obese ratsYue Zhu, Jia-ying Zhang, Yu-long Wei, Jing-yi Hao, Yu-qing Lei, Wan-bin Zhao, Yu-hang Xiao and Ai-dong Sun*AbstractThe gut microbiota plays a critical role in obesity and lipid metabolism disorder. Chokeberry (Aronia melanocarpa L.)are rich in polyphenols with various physiological and pharmacological activities. We determined serumphysiological parameters and fecal microbial components by using related kits, liquid chromatography-massspectrometry (LC-MS) and 16S rRNA gene sequencing every 10 days. Real-time PCR analysis was used to measuregene expression of bile acids (BAs) and lipid metabolism in liver and adipose tissues. We analyzed the effects ofdifferent Chokeberry polyphenol (CBPs) treatment time on obesity and lipid metabolism in high fat diet (HFD)-fedrats. The results indicated that CBPs treatment prevents obesity, liver steatosis and improves dyslipidemia in HFDfed rats. CBPs modulated the composition of the gut microbiota with the extended treatment time, reducing theFirmicutes/Bacteroidetes ratio (F/B ratio) and increasing the relative abundance of Bacteroides, Prevotella, Akkermansiaand other bacterial species associated with anti-obesity properties. We found that CBPs treatment graduallydecreased the total BAs pool and particularly reduced the relative content of cholic acid (CA), deoxycholic acid(DCA) and enhanced the relative content of chenodeoxycholic acid (CDCA). These changes were positivelycorrelated Bacteroides, Prevotella and negatively correlated with Clostridium, Eubacterium, Ruminococcaceae. In liverand white adipose tissues, the gene expression of lipogenesis, lipolysis and BAs metabolism were regulated afterCBPs treatment in HFD-fed rats, which was most likely mediated through FXR and TGR-5 signaling pathway toimprove lipid metabolism. In addition, the mRNA expression of PPARγ, UCP1 and PGC-1α were upregulatedmarkedly in interscapular brown adipose tissue (iBAT) after CBPs treatment. We confirmed that CBPs could reducethe body weight of HFD-fed rats by accelerating energy homeostasis and thermogenesis in iBAT. Finally, the fecalmicrobiota transplantation (FMT) experiment results demonstrated that FMT from CBPs-treated rats failed to reducethe weight of HFD-fed rats. However, FMT from CBPs-treated rats improved dyslipidemia and reshaped gutmicrobiota in HFD-fed rats. In conclusion, CBPs treatment improved obesity and complications by regulating gutmicrobiota in HFD-fed rats. The gut microbiota plays an important role in BAs metabolism after CBPs treatment,and BAs have therefore emerged as major effectors in microbe-host signaling events that influence host lipidmetabolism, energy metabolism and thermogenesis.Keywords: Chokeberry, Gut microbiota, Lipid metabolism, Obese rats* Correspondence: adsun@bjfu.edu.cnCollege of Biological Sciences and Technology, Beijing Forestry University,Beijing 100083, China The Author(s). 2020 Open Access This article is licensed under a Creative Commons Attribution 4.0 International License,which permits use, sharing, adaptation, distribution and reproduction in any medium or format, as long as you giveappropriate credit to the original author(s) and the source, provide a link to the Creative Commons licence, and indicate ifchanges were made. The images or other third party material in this article are included in the article's Creative Commonslicence, unless indicated otherwise in a credit line to the material. If material is not included in the article's Creative Commonslicence and your intended use is not permitted by statutory regulation or exceeds the permitted use, you will need to obtainpermission directly from the copyright holder. To view a copy of this licence, visit http://creativecommons.org/licenses/by/4.0/.The Creative Commons Public Domain Dedication waiver ) applies to thedata made available in this article, unless otherwise stated in a credit line to the data.
Zhu et al. Nutrition & Metabolism(2020) 17:54IntroductionObesity, a state of chronic subclinical inflammation, isthe key element associated with the development ofvarious metabolic disorders [1, 2]. Lipid metabolismdisorders is intimately present in obesity, which areaccompanied by symptoms of dyslipidemia that include exceeding serum levels of total cholesterol(TC), triglyceride (TG), low density lipoprotein cholesterol (LDL-C), and lower level of high density lipoprotein cholesterol (HDL-C). These symptoms areinduced by the dysregulation of hepatic lipid metabolism [3, 4]. In addition, white adipose tissue (WAT) isthe vital site of lipid metabolism. Once the balancebetween lipogenesis and lipodieresis is broken, adipocyte hypertrophy will lead to dysfunctional endocrinesignalling resulting in an increased risk of obesity andrelated metabolic diseases [5]. As hydroxy - methyl glutaryl - coenzyme A (HMG-CoA) reductase inhibitors, statins are widely applied to the treatment ofdyslipidemia through lowering TC and LDL-C levels[6, 7]. However, statins therapy is associated withsome adverse effects including myotoxicity, diabetesmellitus, central nervous system complaints and hepatotoxicity [8, 9], which limits effectiveness in thetreatment of patients with cardiovascular diseases.In recent years, with the increasing interest in thestudy of gut microbiota, it has been found that gutmicrobiota plays an important role in human healthand disease. More and more researches have indicated that gut microbiota participates in host nutrient acquisition, energy regulation, lipid metabolismand immunity [10, 11]. Dysbiosis of gut microbiotais associated with various diseases, including obesity,type 2 diabetes and inflammatory bowel disease[12–14]. High-fat diet (HFD) has become a standardmodel for development of obesity in rats by alteringand remodeling the composition of gut microbiota[15, 16]. Obesity and associated metabolic disorderscan be induced through increasing in the abundanceof Firmicutes or the ratio of Firmicutes to Bacteroidetes (F/B ratio) in HFD-fed rats [13, 14]. Nevertheless, the exact mechanisms that link betweenaltering in the composition of the gut microbiotaand the development of obesity remain obscure as aresult of the complexity of the pathologies.Chokeberry (Aronia melanocarpa L.), known as“superberries”, is a member of the Rosaceae family,which originates from the eastern parts of North America and East Canada [17]. Chokeberry is rich in nutritious ingredients including dietary fiber, organic acids,sugar, fat, protein, minerals and vitamins [18, 19]. Specifically, the polyphenols content of chokeberry is higherthan those of other berries (blueberry, cranberry andlingonberry crops), which exhibits various physiologicalPage 2 of 15activities such as antioxidant, anti-inflammatory, antidiabetic, anti-cardiovascular diseases and so on [20–23].Based on abundant phenolic substances content andvarious physiological effects of chokeberry, the aim ofour study was to evaluate the impact of the polyphenolsextract from chokeberry (CBPs) on improvement obesityand associated lipid metabolism disorders in HFD-fedrats, as well as comprehensive investigating the role ofthe gut microbiota in mediating the effects of the CBPson host metabolism.Materials and methodsEthical approvalThe experiments adhered to the China Institutional Animal Care Use Committee and were licensed by the Ethics Committee of Beijing Laboratory Animal ResearchCenter (Qualified number: BLARC-2018-A033).Extraction of polyphenols from chokeberry and structureanalysisThe polyphenols were extracted in accordance with ourprevious research. Briefly, frozen chokeberries (10 kg)were crushed using a beater for 3 min. Then, materialswere extracted with a 13:7 (v/v) ethanol/water solutionat 45 C for 90 min (simultaneous with 30 min ultrasonicextraction). The solution was centrifuged at 4000 r/minfor 20 min. The supernatant was collected, and ethanolwas removed from the supernatant through rotatoryevaporation under vacuum at 40 C. The CBPs wasfreeze-dried and stored at 80 C. The structure of polyphenols in the chokeberry used in this study is describedin our previous research [24]. The polyphenols profile ofthe chokeberry extract is available in Table 1.Animals and experimental designMale wistar rats (aged 6 weeks and weighing 220 20 g)were purchased from the Beijing Vital River LaboratoryAnimal Technology Co., Ltd. under specific pathogenfree (SPF) conditions and were housed under 12 h-light/12 h-dark cycle, 24 C, 60% humidity. All rats were adaptively raised a week and randomly divided into twogroups: (1) normal diet group (control group, n 10),fed with a control diet (10% kcal from fat, 20% kcal fromproteins, 70% kcal from carbohydrates). (2) high fat dietgroup, fed with high fat diet (45% kcal from fat, 20% kcalfrom proteins, 35% kcal from carbohydrates). After 2months of continuous feeding, the obese rats model wasestablished successfully. High fat diet group rats wererandomly divided into 3 groups: (1) HF group (n 8),continually fed with HFD and administered intragastrically normal saline with 2 mL/kg body weight once daily.(2) AM group (n 10), continually fed with HFD andadministered intragastrically CBPs with 1000 mg/kgbody weight once daily. (3) SV group (n 10),
Zhu et al. Nutrition & Metabolism(2020) 17:54Page 3 of 15Table 1 Chemical characterisation of the polyphenols extract from chokeberryExtract content (mg/100 g fresh weight)Daily intakea (mg/kg body weight)Total polyphenols2209.2522.09( ) - catechin4.340.04( ) - epicatechin45.280.45Chlorogenic s932.159.32Procyanidin B19.180.092Procyanidin B263.250.63Procyanidin ide chloride285.352.85Cyanidin 3-monoarabinoside90.240.90Cyanidin 3-Xyloside14.590.15Cyanidin 3-O-glucoside chloride16.570.17a: Daily intake was calculated based on the 1000 mg of chokeberry polyphenols extract/kg of body weight dose orally given to mice for 40 dayscontinually fed with HFD and administered intragastrically simvastatin with 5 mg/kg body weight once daily.All animals had free access to food and water. Thesetreatment lasted for 40 days. Throughout the duration ofthe trial, body weight of rats were monitored weekly.Feces and blood samples were collected every 10 days.The collected fecal samples were immediately placed inliquid nitrogen and stored at 80 C. The blood samplewere collected via posterior ophthalmic venous plexus ofrats and serum was separated and stored at 80 C forlater analysis of serum biochemical parameters. At theend of the experimental period, the liver, kidney, spleen,heart, lung, pancreas, testicle, epididymal adipose tissue(eWAT), inguinal adipose tissue (iWAT), perirenal adipose tissue (pWAT) and interscapular brown adiposetissue (iBAT) were collected after rats were killed by carbon dioxide inhalation. Viscera organizations and adipose tissues wet weight were measured using a precisionbalance.Biochemical analysisSerum TC, TG, HDL-C, LDL-C, hepatic TC and TGwere determined using the commercially available kitsfrom Nanjing Jiancheng Bioengineering Institute (Nanjing, China). Serum bile acids were analyzed using thepreviously published procedure with some minor modifications [25]. The serum was melted on ice for 30–60min. 100 μL serum was added in 300 μL methanol. Vortex for 10 min. Extracts were centrifuged at 12000 g, 4 Cfor 30 min. Supernatants were then transferred samplevial for UPLC-MS analysis. A Thermo U3000 ultra performance LC system (Thermo Fisher Scientific Inc. Waltham, MA USA) was used throughout. The massspectrometer was a Thermo Q Exactive instrument withan ESI source (Thermo Fisher Scientific Inc. Waltham,MA USA). The entire LC-MS system is controlled byXcalibur 2.2 SP1.48 software. All chromatographic separations were performed with an ACQUITY UPLC HSST3 C18 1.7 μm 100 2.1 mm (Waters Inc. Massachusetts, USA). The elution pattern was set to gradient elution and was listed in Supplementary Table 1. Chemicalsand Reagents HPLC grade acetonitrile and methanolwere purchased from Thermo Fisher (Thermo FisherScientific Inc. Waltham, MA USA). Formic acid was obtained from Sigma-Aldrich Inc.(St. Louis, MO, UnitedStates). All the bile acid standards were purchased fromSteraloids Inc. (Newport, RI USA).Histopathological analysisLiver and adipose tissues were fixed in 4% paraformaldehyde at room temperature for 24 h, which were dehydrated with a sequence of ethanol solutions andembedded in paraffin. Tissue sections (5–6 mm thick)were cut and stained with hematoxylin and eosin (H&E)staining. Sections were observed by a Nikon EclipseE100 microscope (Nikon, Japan) under 400 magnification for liver and 200 magnification for adipose tissues.DNA extraction from fecal samplesTotal genome DNA from samples was extracted fromrats feces using Magen Hipure Soil DNA Kit accordingto manufacturer’s protocols. DNA concentration wasmonitored by Qubit3.0 Fluorometer.PCR amplification and Illumina MiSeq sequencing20 ng DNA was used to generate amplicons. V3 and V4 hypervariable regions of prokaryotic 16S rDNA were selectedfor generating amplicons and following taxonomy analysis.
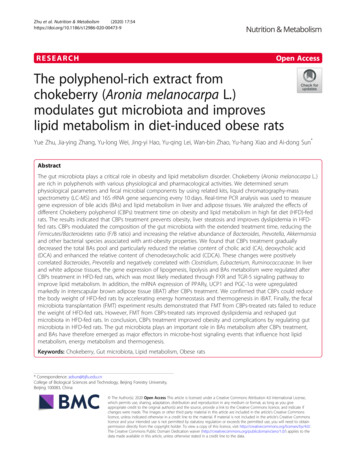
Zhu et al. Nutrition & Metabolism(2020) 17:54The V3 and V4 regions were amplified using forwardprimers containing the sequence “CCTACGGRRBGCASCAGKVRVGAAT” and reverse primers containing the sequence “GGACTACNVGGGTWTCTAATCC”. At thesame time, indexed adapters were added to the ends of the16S rDNA amplicons to generate indexed libraries readyfor downstream NGS sequencing on Illumina Miseq. PCRreactions were performed in triplicate 25 μL mixture containing 2.5 μL of TransStart Buffer, 2 μL of dNTPs, 1 μL ofeach primer, and 20 ng of template DNA. DNA librariesconcentration were validated by Qubit3.0 Fluorometer.Quantify the library to 10 nM, DNA libraries were multiplexed and loaded on an Illumina MiSeq instrument according to manufacturer’s instructions (Illumina, SanDiego, CA, USA). Sequencing was performed using PE250/300 paired-end; image analysis and base calling were conducted by the MiSeq Control Software (MCS) embedded inthe MiSeq instrument.The QIIME data analysis package was used for 16SrRNA data analysis. The forward and reverse reads werejoined and assigned to samples based on barcode andtruncated by cutting off the barcode and primer sequence. Quality filtering on joined sequences was performed and sequence which did not fulfill the followingcriteria were discarded: sequence length 200 bp, noambiguous bases, mean quality score 20. Then the sequences were compared with the reference database(RDP Gold database) using UCHIME algorithm to detectchimeric sequence, and then the chimeric sequenceswere removed.The effective sequences were used in the final analysis.Sequences were grouped into operational taxonomicunits (OTUs) using the clustering program VSEARCH(1.9.6) against the Silva 132 database pre-clustered at97% sequence identity. The Ribosomal Database Program (RDP) classifier was used to assign taxonomic category to all OTUs at confidence threshold of 0.8. TheRDP classifier uses the Silva 132 database which hastaxonomic categories predicted to the species level.Sequences were rarefied prior to calculation of alphaand beta diversity statistics. Alpha diversity indexes werecalculated in QIIME from rarefied samples using for diversity the Shannon index, for richness the Chao1 index.Microbiota-based biomarker analysis was performedwith LEfSe using the online analysis software: l id lefseupload.Real-time PCR analysisTotal RNA was isolated from liver, eWAT, iWAT andiBAT through Trizol (SinoGene Biotech co., Ltd. China)in accordance with the manufacturer’s protocols andthen treated with DNase I. The reverse transcription wasimplemented with the Thermo First cDNA Synthesis KitPage 4 of 15(SinoGene Biotech co., Ltd. China). Real-time PCR wasperformed with StepOnePLUS Real-Time PCR System(Thermo Fisher Scientific Inc. Waltham, MA USA). βactin gene was applied as reference. Primer sequenceswere listed in Supplementary Table 2.Fecal microbiota transplantation (FMT)Male wistar rats (aged 6 weeks and weighing 210 20 g)were randomly divided into 2 groups: (1) FMT-HFgroup (n 8) and (2) FMT-AM group (n 9), fed with ahigh fat diet (45% kcal from fat, 20% kcal from proteins,35% kcal from carbohydrates). The HF and AM groupsrats were considered as donor rats and their fecal samples were collected for 37–40 days after treatment withsimvastatin and CBPs. Fecal samples (5 g) from donorrats were resuspended in sterile saline (25 mL) andmixed using benchtop vortex. Then, the samples werecentrifugated at 3500 g and the microbiota supernatantswere transplanted into the recipient rats (FMT-AMgroup rats and FMT-HF group rats) by clysis way every2 days. Fresh transplant material was prepared on thesame day of transplantation. Gut microbiota transplantation test lasted for 30 days. Body weight of rats weremonitored and feces, blood samples were collected every10 days. After 30 days transplantation, animals were euthanatized by carbon dioxide inhalation. Liver, kidney,spleen, eWAT, iWAT, pWAT and iBAT were collected.Statistics analysisStatistical analysis was performed by using Prism version7.0 (Graph-Pad Software, USA). One-way ANOVA wereused to analyze significance to the differences by Tukey’spost hoc test for multiple comparisons. The significantdifferences between the groups were analyzed by twoway repeated measures ANOVA when data was measured with the change of time. P values of 0.05 or lesswere considered significant. All data are expressed as themean SEM.ResultsCBPs prevents obesity, liver steatosis and improvesdyslipidemia in HFD-fed ratsAfter 2 months of continuous feeding high fat diet, thebody weight of rats in high fat diet group and controlgroup were 594 47.73 g and 476.72 32.95 g, respectively. There was significant difference between the twogroups, which indicated that the obesity model of rats wassuccessfully established. The body weight of AM grouprats decreased continuously during CBPs treatment.Weight gain of AM group rats has a significant differencecompared with HF group rats (P 0.001) (Fig. 1a, b). Notedly, the body weight of HF and SV group rats increasedslowly, and weight gains were 5.29 and 2.72%, respectively,with significant difference (P 0.05) (Fig. 1b). Compared
Zhu et al. Nutrition & Metabolism(2020) 17:54Page 5 of 15Fig. 1 Polyphenols of Aronia melanocarpa treatment prevented obesity and improved hyperlipidemia in HF diet-fed rat. a Body weight (g), bWeight gain (%), c Liver Weight (g), d Adipose tissue weight (g), e Hepatic and adipose tissues morphology shown at 400 or 200magnification, f-i Serum concentrations of TC, TG, HDL-C and LDL-C (mmol/L), g-k Hepatic concentrations TC and TG (mmol/L). Values are means SEMs. *P 0.05, **p 0.01 and ***p 0.001with the HF group rats, the weight of visceral adipose tissues (eWAT, pWAT and mWAT), subcutaneous adiposetissue (iWAT) and liver reduced in AM group rats and SVgroup rats (except eWAT) (Fig. 1c, d). There were no significant differences in weight of iBAT, heart, kidney,spleen, lung, pancreas and testicle among the three groups(Fig. 1d and Supplementary Fig. 1). Overall, CBPs treatment tended to prevent weight gain by reducing theweight of liver, visceral and subcutaneous adipose tissuesin HFD-fed rats. Simvastatin treatment also inhibitedweight gain slightly in HFD-fed rats. However, its effect ofimproving obesity was inferior to CBPs treatment. Therewere significant difference in liver TC and TG concentration of AM and HF group rats (p 0.05) (Fig. 1g, k). Similarly, H&E staining of liver and adipose tissues alsoshowed obese rats treated with CBPs significantly reducedthe hepatic fat droplets and adipocyte size compare withHF group rats (Fig. 1e). Simvastatin treatment could decreased liver TC concentration, whereas it had no effecton reducing liver TG concentration in HFD-fed rats (Fig.1g, k). Besides, simvastatin treatment also improved thefat accumulation and reduced adipocyte size in liver andadipose tissues, which was less effective than CBPs treatment (Fig. 1e).The serum TC, TG and LDL-C increased significantlyand the serum HDL-C decreased in HF group ratscompared with the control group rats (P 0.001) within40 days of HFD feeding (Fig. 1f-i), suggesting that ratsfed with high-fat diet could be induced to develophyperlipidemia. During the CBPs treatment, serum TC,TG and LDL-C decreased gradually and there were significant differences compared with HF group after 20, 30and 20 days, respectively (Fig. 1f-h). Serum HDL-C increased gradually within 40 days of CBPs treatment,which was a significant difference between AM groupand HF group after 30 days (Fig. 1i). The results manifested that CBPs treatment could improve hyperlipemiaby reducing serum TC, TG, LDL-C and increasingHDL-C concentrations in HFD-fed rats. Simvastatintreatment could also significantly improve hyperlipidemia, which was more effective to reduce serum TC andLDL-C than CBPs treatment. There were significant differences in serum TC and LDL-C between SV and HFgroup rats after 10 days (Fig. 1f, h). However, the effectof CBPs treatment on reducing serum TG and increasing HDL-C were better than that of simvastatin treatment in HFD-fed rats (Fig. 1g, i).CBPs alters gut microbial composition in HFD-fed ratsWe analyzed the fecal microbial composition of HF,AM, SV group rats after 10, 20, 30 and 40 days. ACE,Chao1, shannon and simpson indexes were examined
Zhu et al. Nutrition & Metabolism(2020) 17:54for the richness and alpha-diversity of the gut microbiota. The HF group rats revealed significantly higherACE and Chao1 indexes after 20 days. There was no significant differences of shannon and simpson diversity indexes in HF group within 40 days (Table 2). Meanwhile,the ACE, Chao1, shannon and simpson indexes were nosignificant differences after treatment with CBPs andsimvastatin (Table 2).CBPs supplementation had a greater effect on gut microbial composition. At the phylum level, the relativeabundance of Bacteroidetes reduced and the relativeabundance of Firmicutes, F/B ratio increased in HFgroup rats, which were no significant change after 20days (Fig. 2a). Conversely, the relative abundance of Bacteroidetes and Verrucomicrobia were gradually increasedin the AM group rats within 40 days, while the relativeabundance of Firmicutes and F/B ratio were suppressedmarkedly (Fig. 2a). The relative abundance of Proteobacteria decreased significantly within 20 days in HF grouprats, which was no significant variation after 20 days. InSV group rats, except for Proteobacteria, there were nosignificant change in relative abundance of Bacteroidetes,Firmicutes, Verrucomicrobia and F/B ratio within 40 days(Fig. 2a).At the genus level, the gut microbial compositionshowed similar trends to the phylum level. The relativeabundance of Firmicutes phylum (LachnospiraceaeNK4A136 group, Lachnoclostridium), Proteobacteriaphylum (Desulfovibrio) were decreased and the relativeabundance of Bacteroidetes phylum (Bacteroides, Prevotella), Firmicutes phylum (Romboutsia), Verrucomicrobiaphylum (Akkermansia) were increased gradually in AMgroup rats within 40 days (Supplementary Fig. 2). However, the relative abundance of Firmicutes phylum (Lachnospiraceae NK4A136 group, Clostridium) were higherand Bacteroidetes phylum (Bacteroides, Prevotella), Verrucomicrobia phylum (Akkermansia) were lower in HFgroup rats compared with AM group rats after 40 days(Supplementary Fig. 4). Except for the increasing in therelative abundance of genus Clostridium, there was nosignificant change in other genus within 40 days of simvastatin treatment (Supplementary Fig. 2). Furthermore,the linear discriminant analysis (LDA) effect size (LEfSe)was used to identify the biomarkers with significant differences between the two groups. After 40 days, compared with the AM group rats, the relative abundance ofFirmicutes phylum (Romboutsia, Ruminococcaceae, Turicibacter, UBA1819, Anaerotruncus) and Actinobacteriaphylum (DNF00809) were altered significantly in HFgroup rats. However, the the relative abundance of Bacteroidetes phylum (Bacteroidia, Bacteroidales, Muribaculaceae, Bacteroidaceae, Bacteroides, Prevotella) andProteobacteria phylum (Alphaproteobacteria, Rhodospirillales) had significant differences in AM group ratsPage 6 of 15compared to HF group rats (Fig. 2c). Simultaneously,LEfSe analysis elucidated the genus level differences suchthat HF group rats was more abundant in species ofChristensenellaceae compared with SV group rats,whereas there was only one genus (Paenalcaligenes) hadsignificant differences in SV group rats compared withHF group rats (Fig. 2d).CBPs changes serum BAs pool, which is related in gutmicrobial compositionBAs synthesis is an important pathway for catabolismof cholesterol and is closely regulated by complexmechanisms that are not completely understood. BAswere considered as mediators of metabolism, alteration the BAs homeostasis will cause many diseasessuch as obesity, diabetes, nonalcoholic fatty liver disease and hyperlipemia [26]. We anticipated that CBPstreatment could shift the BAs pool in HFD-fed rats.As can be seen from Fig. 3a, the total serum BAscontent of AM group rats increased 20 days ago andthen decreased gradually after 20 days. Nevertheless,within 40 days of high-fat diet feeding, the total serumBAs content increased continuously in HF group rats.These results suggested that CBPs can significantlyimprove the shift of BAs pool which induced by HFDin obese rats. The total serum BAs content of SVgroup rats increased continuously and decreasedslightly after 30 days. Furthermore, the relative content of cholic acid (CA), deoxycholic acid (DCA) andtaurohyodeoxycholic acid (THDCA) were decreasedgradually in AM group rats, while the relative contentof chenodeoxycholic acid (CDCA), hyodeoxycholicacid (HDCA), ursodeoxycholic acid (UDCA) and βmuricholic acid (β-MCA) were enhanced in AMgroup rats (Supplementary Fig. 3). Compared withAM group rats, the relative content of CA and DCAwas higher and relative content of β-MCA and HDCAwere lower in HF group rats after 40 days. Inaddition, the relative content of UDCA increasedslightly and the relative content of TUDCA andTHDCA decreased in SV group rats within 40 days.Correlation coefficients between the relative content ofserum BAs and the relative abundance of gut bacteria atgenus-level were shown in Table 4. Several BAs correlated with specific bacterial genera. Bacteroides was positively correlated with CDCA, HDCA and negativelycorrelated with DCA, GCA. Similarly, Prevotella waspositively correlated with CDCA, HDCA, β-MCA andnegatively correlated with DCA, GCA, TUDCA. Interestingly, Acetitomaculum and Prevotella have the sametrend of association with BAs. In addition, β-MCA positively correlated with Akkermansia. On the contrary,Desulfovibrio was negatively correlated with β-MCA andCDCA.
3SV4SV0.97 0.010.98 0.010.98 0.016.81 0.190.97 0.016.81 0.380.98 0.016.88 0.330.98 0.016.69 0.440.97 0.016.47 0.340.97 0.016.68 0.270.97 0.016.72 0.350.98 0.016.81 0.360.97 0.016.83 0.24Simpsom 0.95 0.03index6.52 0.406.62 0.25609.66 25.04a 614.82 27.76 611.92 31.67 607.16 39.07 566.10 46.86 564.87 51.55 595.56 36.61 580.88 31.95 591.88 37.172SV6.02 0.40590.93 40.91SV1SVShannonindex603.32 23.034 AM528.70 46.48b 591.05 16.66a 594.38 37.21a 623.40 23.03a 614.35 27.95 607.70 36.86 613.21 35.94 571.70 48.78 570.79 62.95 601.71 37.46 588.21 30.88 597.42 35.21a3 AM535.22 45.03a2 AMChao1bAM4HF1 AM3HF1HF2HFHFACESampleTable 2 The ACE, Chao1, Shannon and Simpsom index in HF, AM and SV group rat at day 10, day 20, day 30, day 40 after diet interventionZhu et al. Nutrition & Metabolism(2020) 17:54Page 7 of 15
Zhu et al. Nutrition & Metabolism(2020) 17:54Page 8 of 15Fig. 2 CBPs treatment improved gut microbiota in HFD-induced rat. a Microbiota compositions at the phylum level, b Microbiota compositionsat the genus level in HF, AM and SV group at day 10, day 20, day 30, day 40 after diet intervention. The linear discriminant analysis (LDA) effectsize (LEfSe) was used to identify the biomarkers with significant differences between the two groups: c 4HF vs 4 AM and d 4HF vs 4SV. Values arepresented as mean SEM. *P 0.05; **P 0.01; ***P 0.001; ns P 0.05CBPs regulates gene expression in liver and adiposetissues of HFD-fed ratsTo further explore the molecular mechanism of CBPs improving obesity in HFD-fed rats, we evaluated the gene expression of lipogenesis, lipolysis and BAs metabolism inliver and adipose tissues. In the liver tissue, compared withHF group rats, AM group rats significantly enhanced themRNA expression of peroxisome proliferator-activated receptor α (PPARα), peroxisome proliferator-activated receptor γ (PPARγ), small heterodimer partner (SHP), Gprotein-coupled bile acid receptor (TGR5), fibroblastgrowth factor 15 (FGF15), fibroblast growth factor 4(Fgfr4), bile salt export protein (BSEP) and downregulatedthe mRNA expression of cholesterol-7a-hydroxylase(CYP7A1) (Fig. 3c). The results indicated that CBPs treatment could alleviate the disorder of hepatic BAs metabolism and fat accumulation. Simvastatin treatment alsopartially improved hepatic BAs metabolism by upregulating SHP and TGR5 gene expression (Fig. 3c).In the eWAT, CBPs treatment markedly downregulatedthe mRNA expression of PPARα, PPARγ, acetylcoenzyme A carboxylase 1 (ACC1), sterol regulatory element bindi
fed with a control diet (10% kcal from fat, 20% kcal from proteins, 70% kcal from carbohydrates). (2) high fat diet group, fed with high fat diet (45% kcal from fat, 20% kcal from proteins, 35% kcal from carbohydrates). After 2 months of continuous feeding, the obese rats model was established suc