Transcription
Chilled Water System Analysis Tool(CWSAT)Version 2.1USER’S MANUALOctober 2005Developed in Cooperation with:The University of Massachusetts College of EngineeringDepartment of Mechanical & Industrial EngineeringThe University of Massachusetts Industrial Assessment Centerfunded by the U.S. Department of EnergyThe Center for Energy Efficiency & Renewable Energy
TABLE OF CONTENTSGetting Started . 3Program Overview . 4Introduction Screen. 5Data Source Screen . 6Input Screen . 7System Graphic Screen . 14Operating Schedule Screen . 15Loading Schedule Screen. 17Output Screen. 18Current Chiller Details Screen . 19Current Tower Details Screen. 20Current Pump Details Screen. 21Operating Cost Reduction Opportunities Screen. 22Chiller Sequence Screen . 24New Input Screen. 25New Operating Schedule Screen . 27New Loading Schedule Screen . 28New Output Screen . 29Energy and Costs Screen . 30Proposed Chiller Details Screen . 32Proposed Tower Details Screen . 33Proposed Pump Details Screen . 342
Getting StartedWelcome to the Chilled Water System Analysis Tool!This program was created at the University of Massachusetts - Amherst with funding fromthe U.S. Department of Energy.The files required to run CWSAT Version 2.1 are:CWSAT21.exeThe application file created with MS Visual Basic 6. Double click tolaunch the program.Weather folderThe folder in which weather data is stored. The program reads fromthis folder. It must be placed in the same directory asCWSAT21.exe. The program will create a new file if it does notexist.msvbvm60.dllThe support file required to run VB6 programs. It should already belocated in the System directory of your hard drive.Your feedback will be used in the development of future upgrades. We are interested inyour comments as to the usefulness of the program and suggestions for changes in the nextversion.This manual is intended to document the screens and data entry procedures encounteredwhile using the program. While program navigation is intended to be intuitive, this manualmay be useful for first-time users.I hope you find the tool to be beneficial. Good luck!Questions, suggestions, errors encountered, etc., can be sent to:Michael StockiCenter for Energy Efficiency & Renewable EnergyMechanical & Industrial EngineeringUniversity of Massachusetts160 Governors DriveAmherst, MA 01003-9265413-577-4726cwsat@ceere.org3
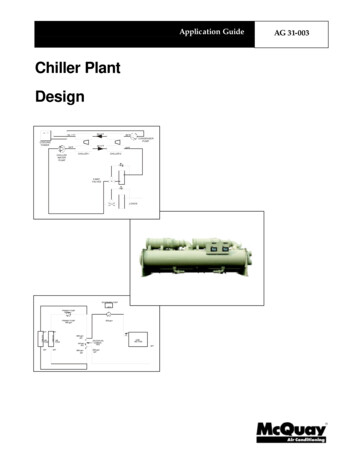
Program OverviewThe tool uses graphical screens to provide information to and extract information from you,the program user. The details of the analysis routines (how the program uses the input datato generate output values) are not covered in this manual. However, some technical notesare provided where appropriate as guidance.The program requests information about the existing chilled water system equipment andoperation. The program calls upon several routines to generate energy consumptionestimates and provides this information to you. After viewing this information, you maywish to alter the equipment specifications or apply one of several operating cost reductionmeasures. The program calculates the energy consumption of the proposed system andcompares these results with those generated for the existing system. In this way, youreceive information about the net benefit of the specific measures proposed. The flowchartbelow provides an overview of the various program screens and the order in which you willview them.IntroductionScreenData SourceScreenUser ScheduleInput ScreenTemperatureData ScreenSystemGraphic ScreenOperatingScheduleScreenCurrent ChillerDetails ScreenCurrent TowerDetails ScreenCurrent PumpDetails ScreenARI ScheduleLoadingScheduleScreenOutput ScreenCost ReductionOpportunitiesScreenNew InputScreenUser ScheduleNew OperatingScheduleScreenChillerSequenceScreenEnergy & CostScreenSame ScheduleProposedChiller DetailsScreenARI ScheduleNew LoadingScheduleScreenSystemGraphic ScreenNew OutputScreenSavingsSummaryScreen4ProposedTower DetailsScreenProposedPump DetailsScreen
Note that invoking “Alt-Print Screen” copies to the Windows clipboard the active window,which can then be pasted into a Word or other document for printing.Introduction ScreenThe introduction screen identifies the name, version, and release date of the software, andrequests feedback in the form of comments, suggestions, or problem descriptions.Options:ENTEREXIT5
Data Source ScreenThis screen allows the user to choose between using previously-saved data and inputtingnew data. If no data file is available in the home directory from a previous run, the programwill simply proceed to the Input Screen; else it will first open the file entitled outputdata.txtand populate the Input Screen with those data.Options:USE DATA SAVED IN FILEINPUT NEW DATA6
Input ScreenThe purpose of this screen is to collect specifications and operational information for theexisting chilled water system. The screen is divided into “frames” to simplify the data inputprocess. Each frame collects several input values and, after the user has reviewed andaccepted the frame contents by clicking on an OK command button, the next relevant frameappears. The frames used on the Input Screen include Basic System Data, Air-CooledData, Water-Cooled Data, Tower Data, Pump Data, Current Chiller Data, and Energy CostData. It is noted that the Air-Cooled Data frame and the Water-Cooled Data frame are notsimultaneously visible. Further, if the system is air-cooled, the Tower Data frame and someobjects within the Pump Data frame are not visible.Options:GO TO OPERATING SCHEDULE SCREENRESTART (Clear all values from the screen and begin data entry process again)SHOW SYSTEM SCHEMATICHELP (Contextual; click on area of interest to invoke)EXIT (Close all screens and end the program)7
The information required on the Input Screen is described on the following pages, and isorganized by the name of the frame in which the variable menu appears.1) System Basics FrameNumber of Chillers Select the Number Of Chillers in the current chilled water systemby selecting a value from the pull-down menu. The allowable value ranges from 1 to 5.Chilled Water Supply Temperature (ºF) Select the Chilled Water Supply Temperatureby selecting a value from the pull-down menu. The allowable value ranges from 35 to 55degrees Fahrenheit.Geographic Location The name of the chilled water system location is used to sortambient temperature data. Ambient temperature is one of the factors used to determinechilled water system energy consumption. The location name can be any string of up to20 characters. A typical name would be MA-Boston. Select the name of the closestlocation from the pull-down menu. If you wish to enter temperature data for a newlocation, press the EDIT command button to open the Temperature Data Screen.Method Of Cooling Chillers require cooling of the chiller condenser as part of therefrigeration cycle. The condenser is typically cooled by a fan-driven air stream(Air-Cooled) or water flowing through a heat exchanger (Water-Cooled). All chillers inthe system are assumed to use the same condenser cooling method. Select the method ofcooling from the pull-down menu.Clicking the Basic System Data OK command button locks in the above values and makeseither the Air-Cooled Data frame or the Water-Cooled Data frame appear. The input valuesrequired in each of these frames are described below.2) Air-Cooled Data Frame (appears if the Method of Cooling is “Air-Cooled”)Outdoor Air Design Temperature (ºF) The outdoor air design temperature is thedry-bulb temperature during full load operation anticipated by the chiller designer. Whenmanufacturers rate air-cooled chillers, they subject them to full load testing using coolingair held at a specific temperature. This is termed the design temperature. It is assumed tobe the “worst case scenario” for chiller operation, and is used as the basis for specifyingthe chiller size at the time of purchase. Select the Outdoor Air Design Temperature fromthe pull-down menu. The standard industry value is 95 (as specified in Standard 550/590of the Air-Conditioning and Refrigeration Institute). The allowable value ranges from 80to 110 degrees Fahrenheit. The value input affects the calculated efficiency of the chilleras a function of the outside operating temperature.Cooling Air Source The air used to cool the chiller condenser may come from inside or,for remote condensers, from outside of a building. If outdoor air is used, the cooling airtemperature will fluctuate with ambient conditions. If indoor air is used, the temperaturewill be relatively steady because it is controlled by the building’s climate control system.8
Any changes in cooling air temperature will affect chiller performance, and areconsidered in the analysis. Select either “Inside” or “Outside” from the pull-down menu.If the Cooling Air Source is “Inside”:Average Indoor Air TemperatureThe Average Indoor Air Temperature is theaverage annual temperature of the air cooling the chiller condenser. The expectedchiller efficiency, and hence energy consumption, is adjusted for differences betweendesign temperature and actual operating conditions. Select the Average Indoor AirTemperature from the pull-down menu. The allowable value ranges from 60 to 90degrees Fahrenheit.Or if the Cooling Air Source is “Outside”:CT follows ambient dry-bulb plus ºFThis value is called the followingtemperature differential, and is the difference between the temperature achieved insidethe chiller condenser and the air used to cool the condenser. If the cooling air issupplied from outside the building, chiller performance will be affected by the outdoortemperature conditions. The closer the condenser temperature approaches the coolingair temperature, the more efficiently the chiller will operate. Select the followingtemperature differential from the pull-down menu. Typical values are 15 to 20 degreesFahrenheit, and the allowable range is 5 to 20.If you are satisfied with the selections, click the OK command button to lock in the valuesand make the Pump Data frame appear.3) Water-Cooled Data Frame (appears if the Method of Cooling is “Water-Cooled”)Is CW temperature constant?Water-cooled chilled water systems typically use acooling tower to remove heat from the chiller condenser and reject it to the atmosphere.Towers may operate to maintain a constant condenser cooling water temperature or allowthe temperature to vary with the ambient conditions. If the condenser water temperatureentering the chiller is held constant, select “Yes” from the pull-down menu. If thecondenser water temperature is allowed to vary, select “No”.If the CW temperature is constant:What is the CWT?The condenser water temperature, or CWT, is the constant coolingwater temperature maintained by the cooling tower and supplied to the chiller. Select theconstant temperature value from the pull-down menu. A typical value is 85 degreesFahrenheit. The allowable range is 70 to 90 degrees Fahrenheit.Or if the CW temperature is not constant:CWT follows ambient wet-bulb plus ºFThis value is called the followingtemperature differential, and is the difference between the condenser cooling water9
temperature achieved and the wet-bulb temperature of the air entering the cooling tower(the analysis assumes the condenser temperature achieved is equal to the cooling watertemperature supplied to the chiller). The closer the condenser water temperatureapproaches the air wet-bulb temperature through evaporation in the cooling tower, themore efficiently the chiller will operate. Select the condenser following temperaturedifferential from the pull-down menu. Typical values are 7 to 10 degrees Fahrenheit, andthe allowable range is 5 to 20.If you are satisfied with the selections, click the OK command button to lock in the valuesand make the Tower Data frame appear.4) Tower Data Frame (appears only if the Method of Cooling is “Water-Cooled”)Tower Type Select the Tower Type from the pull-down menu. Seven options aresupported. The supported towers are “1-Cell with 1-Speed Motor”, “1-Cell with 2-SpeedMotor”, “2-Cell with 1-Speed Motors”, “2-Cell with 2-Speed Motors”, “3-Cell with 1 Speed Motors”, “3-Cell with 2-Speed Motors”, and “Tower with Variable SpeedMotor(s)”. By choosing one of the first six options, the number of cells per tower isautomatically specified as 1, 2, or 3, where a cell is the number of identical zones (i.e.fans) operating within a cooling tower. If the seventh option is selected, an additionalmenu appears at the bottom of the screen to specify the number of cells per tower. It isbelieved that these seven options will cover the majority of cooling tower systemsencountered.Number of TowersThe Number of Towers is the number of cooling towers (operatingin parallel) required to serve the chilled water system. Select the Number of Towersvalue from the pull-down menu. The allowable range is 1 to 5.Size Tower by The towers can be sized by tonnage or fan hp. Note that a chiller ton isequal to 12,000 BTU/hr, while a tower ton is equal to 15,000 BTU/hr. The differenceaccounts for the additional heat generated by inefficiencies in the chiller that must berejected by the tower. The appropriate match for a 100-ton chiller is a 100-ton tower.TonsFan TypeSpecify the tower rating in tons. The choices range from 20 to 3,000 tons.The fan type can be specified as axial, centrifugal, or unknown.Fan Motor Size (hp)The Fan Motor Size is the rated size of the fan motors installedin each cooling tower cell. The program assumes that all cells are identical. Select theFan Motor Size from the pull-down menu. The allowable range is 1 to 100 horsepower,with common motor sizes supported.If the Tower Type is “Tower with Variable Speed Motor(s)”:Number of Cells Per Tower The menu for the Number of Cells Per Tower appearsupon the selection of the “Tower with Variable Speed Motor(s)” tower type. A cell is10
the number of identical, independent zones (i.e. fans) within a given cooling tower.Select the Number of Cells Per Tower from the pull-down menu. The allowable rangeis 1 to 3.If you are satisfied with the selections, click the OK command button to lock in the valuesand make the Pump Data frame appear.5) Pump Data FrameThe Pump Data frame contains menus for both chilled water pumps and condenser waterpumps for water-cooled systems, and for chilled water pumps alone for air-cooled systems.The following values apply for both pump types.Variable Flow?Some chillers are designed to operate with variable chilled and/orcondenser water flow rates. At reduced load conditions, the pump flow rate may bereduced to save energy. Select “Yes” from the pull-down menu if the pump flow varieswith chiller load, and select “No” if the pump flow rate is constant under all loadingconditions. Most applications operate with constant pump flow.Flow Rate [gpm/ton]The pump flow rate is generally specified as a function of thechiller capacity in tons. For constant flow systems, this value specifies the pump flowrate under all conditions. For variable flow systems, this value specifies the pump flowrate coinciding with full chiller load. Even in variable flow systems, however, the pumpflow rate generally remains at 50% of the rated flow or above. Select the pump flow ratefrom the appropriate pull-down menu. Typical values are 2.4 gpm per ton for chilledwater pumps and 3.0 gpm per ton for condenser water pumps. The allowable range forchilled water pumps is 1.6 to 3.0, and the range for condenser water pumps is 2.0 to 4.0.Motor Size (hp)The pump motor size can be specified or declared to be unknown. Ifthe size is specified, that information will be used to calculate pump energy use.Otherwise, typical system parameters, including the other inputted data will be used forthat purpose. If there are multiple pumps running simultaneously, input their combinedhorsepower.Pump Efficiency [%]The energy consumed in a given pump application is a functionof the efficiency of the pump in converting mechanical energy into hydraulic energy.Select the approximate pump efficiency from the pull-down menu. In a properlydesigned system, a typical value is 88%. The allowable range is 70 to 100.Motor Efficiency [%]The energy consumed in a given pump application is a functionof the efficiency of the motor in converting electric energy into mechanical energy.Select the approximate motor efficiency from the pull-down menu. In a properlydesigned system, a typical value is 94%. The allowable range is 70 to 100.11
If you are satisfied with the selections, click the OK command button to lock in the valuesand make the Current Chiller Data frame appear.6) Current Chiller Data FrameCompressor TypeIn the mechanical vapor compression cycle, a compressor increasesthe energy of the refrigerant by increasing the pressure and temperature of the saturatedvapor. The tool supports three compressor types, namely “Centrifugal”, “Reciprocating”,and “Helical Rotary”. Natural gas engine-driven chillers are supported only asreplacement equipment (See New Input Screen). Select the Compressor Type from thepull-down menu.Full Load Efficiency: Known?The analysis of chiller performance is dependent onknowledge of the rated efficiency of the chiller. If the rated efficiency of a specific chilleris known, a performance curve can be adapted to this value to predict part loadperformance. If the full load efficiency is not known, a database value for a genericchiller of equivalent size must be used. This generic value may or may not accuratelypredict the energy consumption of your chiller. Therefore, it is recommended that the fullload efficiency by determined whenever possible. This will improve the accuracy of theanalysis results. If the full load efficiency is known select “Yes” from the pull-downmenu. Otherwise, select “No”.Chiller Capacity (tons)The cooling capacity of a chiller is quoted in units ofrefrigeration tons, where one ton of cooling is equivalent to 12,000 Btu per hour of heatremoval from the chilled water stream. The nominal tons value is the rated cooling effectof the chiller at full load, and can generally be determined from the chiller nameplate orthe chiller model code. Once the compressor type has been specified, the nominal tonratings supported by the tool are made available for selection. For a water-cooledcentrifugal chiller, capacities vary from 200 and 2000. For a water-cooled reciprocatingchiller, capacities vary from 20 to 250. For an air-cooled reciprocating chiller, capacitiesvary from 40 to 450. For a water-cooled helical rotary chiller, capacities vary from 70 to800. For an air-cooled helical rotary chiller, capacities vary from 70 to 400. Select theChiller Capacity from the pull-down menu.If the full load efficiency is known:Full Load Efficiency (kW/ton)If the full load efficiency is known, enter the value byclicking the up and down arrows adjacent to the FLE text box. Typical values rangefrom 0.6 to 1.0 kW/ton for water-cooled chillers and 1.0 to 1.4 kW/ton for air-cooledchillers. The allowable range is 0.2 to 2.5, selectable in increments of .01.Age (Years)The age of a chiller has been shown to affect its performance due to tubefouling. This fouling inhibits heat transfer, and thus reduces the overall efficiency of thechiller. Select the chiller Age from the pull-down menu. The allowable range is 0 to 20.If the chiller has been rebuilt or the tubes are cleaned as part of general maintenance,12
record the age of the chiller as the time since the last tube cleaning. The programassumes that chiller efficiency is degraded by 1% / year.If you are satisfied with the selections, click the OK command button to lock in the valuesand make the Energy Cost Data frame appear.7) Energy Cost Data FrameEnergy costs ultimately determine the cost to operate a chilled water system. Electricitycost is recorded in per kWh. Natural gas cost is recorded in per MMBtu, and is usedonly for replacement equipment (See New Input Screen and New Output Screen).Electricity Cost ( /kWh)Enter the electricity cost in the text box. Click on the text boxto move the cursor and type in the value with the keyboard. The default value is 0.060/kWh. If you have different peak and off-peak rates and/or substantial demandcharges, use the average /kWh value.Natural Gas Cost ( /MMBtu)Enter the natural gas cost in the text box. Click on thetext box to move the cursor and type in the value with the keyboard. The default value is 6.00/MMBtu.If you are satisfied with the selections, click the OK command button to lock in the valuesand make the GO TO OPERATING SCHEDULE command button appear.13
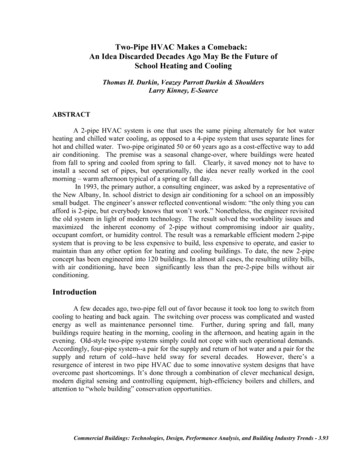
System Graphic ScreenThis screen shows a visual of the system as inputted, and can be used to verify the accuracyof the data.Options:RETURN TO PREVIOUS SCREEN14
Operating Schedule ScreenThe OPERATING SCHEDULE SCREEN represents the typical hours of the day andmonths of the year that the chilled water system will operate. Chilled water system energyconsumption is a function of 1) the ambient conditions and 2) the cooling load placed onthe system. The chilled water system operating schedule, in combination with thetemperature data obtained from the WEATHER.DAT file addresses the first of these twofactors. The second factor is addressed by the Loading Schedule Screen, or sufficient datamay be obtained on the Operating Schedule Screen to estimate annual system loading. TheOperating Schedule Screen is divided into three frames: the Weekly Operating Scheduleframe, the Monthly Operating Schedule frame, and the Loading Data frame.Options:INPUT: Weekly: M-F, 8-5 onlyINPUT: Weekly: Copy Mon to Tue-FriINPUT: 8,760 HOURS (Loads values for a year-round 24/7 application)INPUT: Maximum Monthly Hours15
GO TO OUTPUT SCREEN (this choice offered if loading follows ARI schedule)GO TO LOADING SCHEDULE SCREEN (this choice offered if loading follows non-ARIschedule)RESTARTEXITEnter the typical starting and stopping times for the chiller for each day of the week via thepull-down menus in the Weekly Operating Schedule frame. This information is used toremove non-operating daily hours from the temperature data. After seven starting timesand seven stopping times are provided, the Monthly Operating Schedule frame appears.Click on “Weekly M-F 8-5 only” to quickly input some typical working hours.Alternatively, enter desired hours for Monday and then click on “Weekly: Copy Mon toTue-Fri” to copy those values to the rest of the workweek.Enter the number of operating hours for each month of the year via the pull-down menus inthe Monthly Operating Schedule frame. To simplify data entry, the input value is limited toincrements of 24-hours. This information is used to remove non-operating seasonal hoursfrom the temperature data.Click on “Maximum Monthly Hours” to quickly input those data.The Loading Data frame acquires yes or no responses to questions about the chiller loadingscheme employed by the chilled water system. This information is used to customize theLoading Schedule Screen or to allow you to skip the Loading Schedule Screen altogether.Does the chilled water system operate according to the ARI 550/590 schedule? The AirConditioning and Refrigeration Institute (ARI) has developed a typical load profile forchillers used in air-conditioning applications. If the chilled water system is usedprimarily for this application, select “Yes” from the pull-down menu. The two remainingquestions are bypassed and the OK command button appears within the frame. Click theOK command button to make the GO TO OUTPUT SCREEN command button visible.Select “No” from the pull-down menu if you wish to enter the loading schedule yourself.Does chiller loading vary from month to month? This question is relevant to systemsthat operate seasonally. Select either “Yes” or “No” from the pull-down menu.Does chiller loading vary from chiller to chiller? This question is relevant for multichiller systems that operate for extended periods with unequal chiller loading. If thesystem employs only one chiller, this question will not appear. Select either “Yes” or“No” from the pull-down menu.After responses to the relevant questions are recorded, the OK command button appearswithin the frame. Click the OK command button to make the GO TO LOAD SCHEDULESCREEN command button appear.16
Loading Schedule ScreenThe loading schedule represents the fraction of the operating hours spent at a given loadingcondition, where the loading of a chiller is specified as the fraction of rated coolingprovided. The loading fraction combined with the number of hours the chiller provides thislevel of cooling constitutes a loading schedule. The appearance of the Loading ScheduleScreen is determined by the responses to the questions posed in the Loading Data frame ofthe Operating Schedule Screen. If the loading schedule varies by month, then input textboxes are provided for each month rather than just a single representative frame. If theloading schedule varies by chiller, then data must be entered in chiller-specific frames.Further, an additional frame appears containing a description of the current chiller.Options:GO TO NEXT CHILLER (If chiller loading varies from chiller to chiller)GO TO OUTPUT SCREENCOPYPASTERESTARTEXITEnter the percentage of hours at a given load (and during a given month if appropriate) byclicking on the text box to move the cursor and typing in an integer value between 0 and100. The values you enter are added across columns. Make sure the total is 100% for allthe rows.17
To duplicate one month’s loading data to other months, click “Copy” at the row of themonth to be copied and “Paste” at the row(s) to copied to.If loading varies by chiller, click the GO TO NEXT CHILLER command button to advanceto the next chiller frame. Clicking the GO TO NEXT CHILLER command button after thelast chiller makes the GO TO OUTPUT SCREEN command button appear. Click the GOTO OUTPUT SCREEN command button to hide the Loading Schedule Screen and showthe Output Screen.Output ScreenThe output data is presented on the Output Screen. The screen is reached by clicking theGO TO OUTPUT SCREEN command button on the Operating Schedule Screen or theLoading Schedule Screen. The frames presented on the Output Screen summarize the input18
data provided on the Input Screen, and an estimate of the energy consumption of the chilledwater system. Displaying these values along with the energy consumption informationcontained in the Energy Summary frame assist in the interpretation of the results of theanalysis. The Energy Summary frame includes the energy for each system component(chillers, tower if applicable, and pumps) and a total for the system. The costs associatedwith these values are also shown. The command buttons at the bottom of the screenprovide your options as to how to proceed.Options:GO TO OPERATING COST REDUCTION SCREENGO TO CURRENT CHILLER DETAILS SCREENGO TO CURRENT TOWER DETAILS SCREEN (If the chillers are water-cooled)GO TO CURRENT PUMP DETAILS SCREENRETURN TO INPUT SCREENSHOW SYSTEM GRAPHICSHOW ENERGY / COST GRAPHICEXPORT TO FILE (Copy the output values to a text file)HELPEXITCurrent Chiller Details Screen19
The Current Chiller Details Screen shows chiller efficiency, hours, power, and energy foreach chiller at loads of 0% to 100% of rated capacity in increments of 10%. The totalannual operating hours and energy consumption are also shown. The caption of eachchiller frame is updated with the chiller number and capacity for clarity. The screen isuseful for reviewing the energy consumption values used to determine the totals shown onthe Output Screen. After reviewing the data, you may click the RETURN TO OUTPUTSCREEN command button.Options:RETURN TO OUTPUT SCREENHELPCurrent Tower Details ScreenThe Current Tower Details Screen cont
cooling tower to remove heat from the chiller condenser and reject it to the atmosphere. Towers may operate to maintain a constant condenser cooling water temperature or allow the temperature to vary with the ambient conditions. If the condenser water temperature entering the chiller is held constant, select "Yes" from the pull-down menu .