Transcription
Instantaneous Soundness Checking of IndustrialBusiness Process ModelsDirk Fahland1 , Cédric Favre2 , Barbara Jobstmann4 , Jana Koehler2 , Niels Lohmann3 ,Hagen Völzer2 , and Karsten Wolf31Humboldt-Universität zu Berlin, Institut für Informatik, Unter den Linden 6, 10099 Berlin,Germany, fahland@informatik.hu-berlin.de2IBM Zurich Research Laboratory, Säumerstrasse 4, 8803 Rüschlikon, Switzerland,(ced koe hvo)@zurich.ibm.com3Universität Rostock, Institut für Informatik, 18051 Rostock, Germany,(niels.lohmann karsten.wolf)@uni-rostock.de4EPF Lausanne, 1015 Lausanne, Switzerland, barbara.jobstmann@epfl.chAbstract. We report on a case study on control-flow analysis of business processmodels. We checked 735 industrial business process models from financial services, telecommunications and other domains. We investigated these models forsoundness (absence of deadlock and lack of synchronization) using three different approaches: the business process verification tool Woflan, the Petri net modelchecker LoLA, and a recently developed technique based on SESE decomposition. We evaluate the various techniques used by these approaches in terms oftheir ability of accelerating the check. Our results show that industrial businessprocess models can be checked in a few milliseconds, which enables tight integration of modeling with control-flow analysis. We also briefly compare thediagnostic information delivered by the different approaches.1IntroductionVarious studies [1] show that many business process models contain control-flow errors such as deadlocks. Such errors obstruct the correct simulation, code generation andexecution of these models. Therefore, detecting and removing control-flow errors becomes crucial in view of the increasing popularity of these use cases. Preventing errorsby using a restricted, for example a purely block-oriented modeling language is rarelyan option because a model typically needs to reflect the real causal process structurespresent in an enterprise.In this paper, we are interested in checking business process models for the classical notion of soundness [2, 3], which entails the absence of deadlocks and lack ofsynchronization, which are explained in more detail below. Our interest in soundness ismotivated by an increased need in creating business process models not only for documentation purposes, but for an input into a translation and code generation processwhere, e.g., WS-BPEL code is generated. Soundness is necessary to translate a processmodeled in a graph-based language, such as UML Activity Diagrams or BPMN, to WSBPEL in a way that preserves the execution semantics and the structure of the process.This use case requires a process to be checked in a relatively short amount of time, say500 ms or less, because checks are to be performed on each major modification, that is,
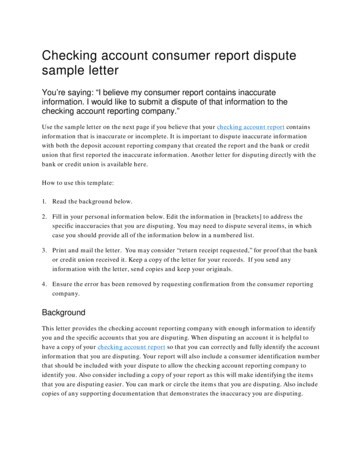
at least on each save operation on the process model. Moreover, entire libraries of upto several hundred processes have to be checked when models are exchanged betweenmodeling tools. Short response times make it possible to integrate control-flow analysis tightly with modeling such that errors are found at the earliest possible time, whichwould allow the user to relate an error to the latest change in the model. Furthermore,use cases such as code generation from models also require that an analysis producessufficient diagnostic information to allow the user to locate and repair the detected errors.A variety of techniques for checking soundness exists in the literature. They differ in their completeness, worst-case complexity, and quality of diagnostic informationreturned. Most techniques can be easily combined to optimize performance. The mostflexible technique is state space exploration. It is most likely applicable to other similaruse cases, such as checking a relaxed notion of soundness or checking more expressive languages supporting OR-joins and other advanced synchronization constructs. Butstate space exploration suffers from the state space explosion problem, i.e., the fact thatthe number of reachable states can be exponential in the size of the process model. Onthe other hand, many business process models have a simple structure, for instance, theyare sequential to a large extent, hence they do not necessarily have a large state space.At the onset of our project, it was not clear from the literature how large the statespaces of control-flow models of realistic business processes are and hence which additional techniques are needed to check their soundness as fast as required by our usecase. It was completely open whether such a check can be performed in the requiredtime and in such a way that sufficient diagnostic information is obtained. In addition,given the variety of available approaches, it was unclear which would be the most suitable techniques.In this case study, we investigated three approaches implemented in three differenttools as outlined in Fig. 1:1. The Petri net model checker LoLA [4], from which we used CTL model checkingwith partial order reduction.2. The business process verification tool Woflan [3], which uses a mixture of Petri netanalysis techniques, most notably structural Petri net reduction and S-coverabilityanalysis, as well as a form of state space exploration based on coverability trees.3. The process validation technique used in the IBM WebSphere Business Modeler,which combines SESE decomposition [5] with heuristics and state space exploration.The data set for our case study was a large collection of process libraries availablein the IBM WebSphere Business Modeler tool. The first two approaches required atranslation of these models into Petri nets, whereas for the third approach, the modelswere translated into workflow graphs.We obtained the following results: Based on the 735 process models that we analyzed, soundness of industrial business process models can be decided in a few milliseconds per process. Although many processes are simple enough that state spaceexploration alone would be sufficient to decide soundness, this method is not sufficientin general. However, all three approaches perform similarly fast, meeting the abovementioned performance requirements. This implies that one can focus on different re2
for each SESE fragmentmatchesstructural heuristics?Atranslationbusiness processmodelBCSESEdecomposition /soundworkflow graphSESE fragmentsIBM WebSphere Business Modeler / SESE approachsoundness check(plain state space)analysis resultchoice depends on SESE fragmentliveness check(reduced state space)translation /soundsafeness check(reduced state space)Petri net counterexample counterexampleanalysis resultalways perform both checksLoLA trivial workflow net?soundextension toworkflow netanalysis resultstructuralreductionworkflow netCompilerreduced workflow netWoflansoundness check(structure andstate space) /sound structural informationanalysis resultchoice depends on net structureFig. 1. Three different approaches and tools to check soundness.quirements such as the quality of the returned diagnostic information when decidingfor a soundness-checking technique. Our study also shows that there is a high percentage of unsound models, confirming the need for better tool support for execution-awaremodeling.Previous studies [6, 7, 3] on checking soundness or the similar notion of EPC soundness of realistic business process models concentrate on error findings and error prediction. These studies do not report runtimes for the analysis. Mendling [8] reports anaverage analysis time of 1.8 secs and maximal time of 142 secs for checking the EPCsoundness of 604 processes. His technique of using structural reduction rules that operate directly on the process model does not find all violations of soundness. A postprocessing with state space exploration is not included in these runtimes. The same setof processes was also checked for relaxed soundness [9] with a reported runtime of46 secs per process on average [8, 1]; however, no maximal times are reported. Recentwork [10] extends control-flow analysis to more advanced synchronization constructssuch as OR-joins and cancelation regions, but so far no empirical results have beenreported. A preliminary and incomplete version of the SESE decomposition techniquethat used heuristics only, but did not include state space exploration, was partially evaluated on a different set of data [5].The remainder of this paper is organized as follows: In Sect. 2, we discuss the dataused in this study, their translation to workflow graphs and Petri nets, and the notion ofsoundness. Sections 3, 4, and 5 present the three approaches together with the resultsthey achieved on the data. In Sect. 6, we review the results in a comparison of the threeapproaches and draw conclusions.3
22.1Selecting the Empirical Data and Preparing the Case StudySampling the process dataWe scanned a large set of real-world data available to the IBM team for our practicalvalidation of the soundness-checking approaches and tools. These data mostly resultedfrom modeling activities in customer projects within a SOA context, i.e., processes werecaptured with the final goal of implementing them in a Service-Oriented Architecture.The models covered various industry domains such as financial services, automotive,telecommunications, construction, supply chain, health care, and customer relationshipmanagement. We also looked at large collections of reference processes that were created for the insurance and banking domain by users who explored different modelingstyles, i.e., different ways of capturing data and control-flow at varying level of granularity. All models were available in the IBM WebSphere Business Modeler tool represented in a language that currently combines elements from UML Activity Diagramsand the Business Process Modeling Notation (BPMN), but some of them had originallybeen created in other tools first and then imported into the IBM product.It turned out that only some of the model collections considered are useful for ourpurposes. Many process models are in fact quite small, as good modeling practice suggests an appropriate structuring of processes into subprocesses, and are therefore nota challenge for our soundness-checking approaches. Others, in particular those createdin other tools, might not have been created with the appropriate notion of soundness ormight have been created by non-experts and consequently turned out to be syntacticallyincomplete and therefore flawed in such a way that it made no sense to consider themfurther. In the course of our experimental studies, we therefore reduced our initial testset of approx. 3000 models to 5 libraries of 735 different models in total from the insurance, banking, customer relationship, as well as construction and automotive supplychain domains. We completely anonymized the data in these models, e.g., task nameswould be replaced by enumerations t1, t2, . . ., and named these libraries A, B1, B2, B3,and C. These anonymized libraries, which have been stripped off all semantics and represent only purely structural information, were the input for the tools LoLA, Woflan,and the SESE approach. Libraries B1, B2, and B3 partially overlap as they represent aseries of models from the same domain created over a period of two years, in which alibrary changed to the next by adding more process models and refining all models withfurther detail. The number of 735 different processes therefore counts only the latestlibrary in this series, which is B3 with 421 processes, together with the 282 processesfrom library A and 32 processes from library C.Table 1 characterizes the data from our process libraries by measuring the number ofnodes that represent tasks, subprocesses, gateways, start and end events, and the numberTable 1. Static data.AB1B2B3CAvg. / max. number of nodesAvg. / max. number of edges14 / 4633 / 12717 / 6929 / 14716 / 6731 / 20218 / 8333 / 19527 / 11833 / 145Avg. / max. node inflowAvg. / max. node outflow2.52 / 131.03 / 81.76 / 150.94 / 131.90 / 690.99 / 151.86 / 271.05 / 301.84 / 41.83 / 44
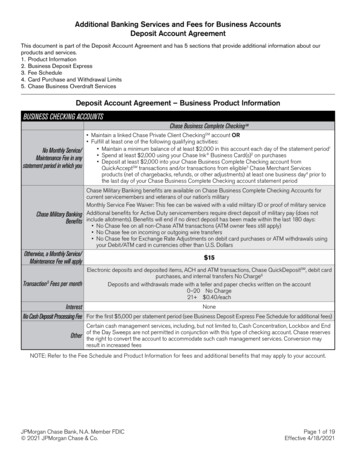
of edges that represent control- and data-flow connections between nodes. The inflowand outflow numbers capture the branching degree that occurs in the models. Note thatfor libraries B1 and B2 the average outflow is smaller than 1, because many end eventsoccurring in these models have outflow 0.To illustrate such a process model, we show a typicalaverage-sized example from library C in Fig. 2. We split theflow into two parts: the end of the left flow continues at thebeginning of the right flow. This process model contains 21tasks representing elementary, not further distinguished process steps, 16 gateways to encode XOR-splits and -merges,and 51 edges representing data- and control-flow connections.A task can have multiple incoming and outgoing edges thatencode implicit AND-splits and -joins of the control and dataflows. The example model also contains several cycles: Thereis a large cycle that spans almost the entire process and thereare three smaller cycles within this large cycle – two of themare nested within each other, whereas the third occurs at theend of the process.2.2Fig. 2. Structure of atypical, average-sizedprocess model.Translation into workflow graphs and Petri netsData-flow constructs in the language of the current version ofthe IBM WebSphere Business Modeler are similar to UMLactivity diagrams. Here, we only consider explicit data-flowconnections and no repositories, because each such connectionimplies a control-flow connection. Control-flow constructs arevisualized in BPMN.The translation of the process models into the format required by the soundness checkers focuses on the followingmodeling elements: start and end events, tasks, subprocesses,control flow, input and output sets, and gateways. Data flowis ignored during the translation, i.e., each explicit data-flowconnection is replaced by a control-flow connection. Data flowconnections from and to repositories were not considered at all.The current language supported by IBM WebSphere BusinessModeler contains XOR- and AND-gateways as well as an ORsplit, but no OR-join. The translation is well-known and therefore not repeated here; details are provided elsewhere [11].A task can have multiple incoming and outgoing edges (inputs and outputs) that can be grouped into sets. Input and output sets of tasks are translated into gateway logic as illustratedin Fig. 3. In Fig. 3, task A has inputs a, b grouped into one setand inputs c, d, e grouped into another set with the meaningthat A can execute if it either receives a and b as input or c,d, and e. The output (sets) of task A are f, g, h and i, j, k. Thepresence of an input or output is expressed by placing a token5
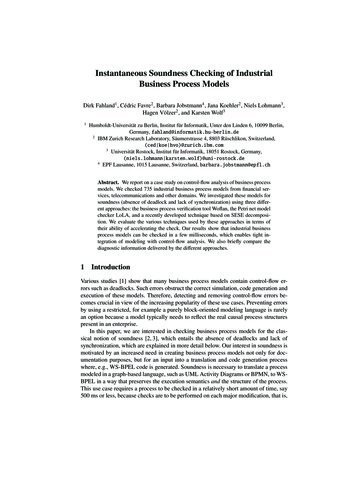
on an edge between two nodes. Tokens move through the process as a task or gatewayexecutes, taking the process from one state to another state in the usual way.aabcdeAfghijkbcfghAaout 1in 1bhc .dijdekefgiAjin 2out 2kFig. 3. Translation of a task with disjoint input and output sets (left) into the corresponding workflow graph (center) and Petri net patterns (right).In the center of Fig. 3, we see the translation into a workflow graph [2, 5], whichis a control-flow graph containing only gateways and tasks. To the right, we see theresulting Petri net. In general, input and output sets can overlap, which would leadto non-free-choice Petri nets as a result of the translation [12]. However, none of thesyntactically valid process models contained in our test set used overlapping inputs oroutput sets, i.e., the translation will only return free-choice nets in our case study. Thismakes it possible to benefit from fast analysis techniques for free-choice Petri nets, seefor example Sect. 4. Furthermore, users of the tool can specify which input set activateswhich output set, but this information was not provided in any of the models. For thetranslation, we therefore assumed that each input set can potentially activate each outputset. Two different translations into workflow graphs and Petri nets were implemented,although the Petri nets could also be directly obtained from the workflow graphs by awell-known construction [2].2.3SoundnessFigure 4 shows a workflow graph without any tasks as it occurs in the middle part of theprocess in Fig. 2 and to which we added a start and an end event. This process modelcontains a lack of synchronization error as well as a local deadlock, which are not soeasy to spot in the first place.M2M1J1F1Fig. 4. Workflow graph with deadlock and lack of synchronization errors.A local deadlock is a reachable state s of the process that has a token on an incoming edge e of an AND-join such that each state that is in turn reachable from s alsocontains a token on e, i.e., the token is ‘stuck’ on e. A deadlock arises for example,6
if two alternative paths are merged by an AND-join or if an AND-join occurs as anentry to a cycle. In the example in Fig. 4, a deadlock occurs when a token travels theYes edge leaving the XOR-split D1. Eventually, this token will reach the AND-join J1via the upper incoming branch. However, no other token will ever arrive at the lowerincoming branch of J1.A reachable state s contains a lack of synchronization if there is an edge that hasmore than one token in s. If such an edge contained a task, it would be executed twice.A lack of synchronization arises for example, if two parallel paths are merged by anXOR-merge or if the exit of a cycle is an AND-split. In the example in Fig. 4, a lackof synchronization occurs when a token travels the No edge leaving the XOR-split D1.This token will activate the AND-split F1, which leads to a token reaching the XORmerge M2 and another token traveling the cycle D2, M1, D1, F1. This can result inmultiple tokens on the edge from F1 to M2.A process model that has neither a lack of synchronization nor a local deadlock issaid to be sound. This definition of soundness is equivalent to the classical definitionof soundness in free-choice Petri nets [3]. There are other equivalent characterizationsthat are exploited by some of the tools used in our case study, see for example Sect. 5.Their formal treatment can be found elsewhere [2, 3, 13, 5].Table 2 summarizes the results of our analysis for the libraries. On average, only46% of all process models are sound ranging from 37% for library B1 to 53% forlibrary A. The table also shows the degree of concurrency that can be found in a processmodel, i.e., the maximum number of tokens that occur in a single reachable non-errorstate of the process. Row 5 shows the number of processes with more than one millionreachable states, which include error states, and processes that have infinitely manyreachable states such as the process shown in Fig. 4. To exclude those, we measured thesize of the state space of each sound process, which is always finite, which still returneda few processes with more than one million states. The average values, however, suggestthat such processes are rare.Table 2. Dynamic data.Processes in librarysoundunsoundAvg. / max. 072143215172 / 138 / 1416 / 6614 / 332/4Processes with 1000000 statesProcesses with 1000000 states (only sound)26019129438470Avg. number of states (only sound, 1000000 states)Max. number of states (only sound, 1000000 states)2621371236332228641491158850768083703State Space Verification with LoLALoLA [4] is a tool that decides numerous properties by an inspection of the state spaceof a given Petri net. For making state-space inspection feasible, it offers several statespace reduction techniques. The experiments were carried out with the current versionof LoLA 1.11 [14].7
Soundness as a model-checking problem. The process models have to be translatedinto Petri nets prior to the verification as sketched in Sect. 2.2. To verify soundness,LoLA works in two runs on the resulting Petri nets. In the first
3.The process validation technique used in the IBM WebSphere Business Modeler, which combines SESE decomposition [5] with heuristics and state space explo-ration. The data set for our case study was a large collection of process libraries available in the IBM WebSphere Business