Transcription
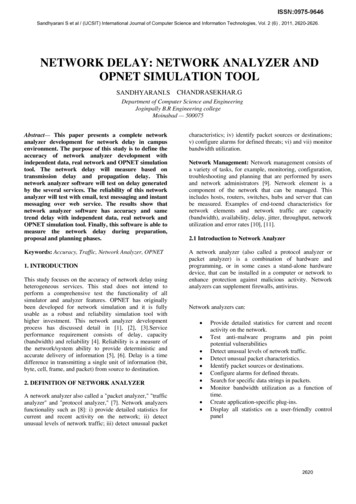
Reliable Network/Service Infrastructures1
Availability, Reliability and SurvivabilityAvailabilityReliabilitySurvivability The expected ratio ofthe system uptime tototal elapsed time The probability of thesystem keep beingavailable (not fail) overcertain period of time. The capability of thesystem to continue itsoperation and fulfill itsmission in a full orlimited scale duringfailure Empirical factorMTBFA MTBF MTTR Empirical factorR (t ) e t Probabilistic– Expected time betweenfailures– Expected time torecover1, t time intervalMTBF Probabilistic– Expected time betweenfailures Non-probabilistic– Assumes explicitfailures of different spanand magnitude2
What Is “High Availability”? The ability to define, achieve, and sustain “target availabilityobjectives” across services and/or technologies supported inthe network that align with the objectives of the business(i.e. 99.9%, 99.99%, 99.999%)AvailabilityDowntime per Year (24x7x365)99.000%3 Days15 Hours36 Minutes99.500%1 Day19 Hours48 Minutes99.900%8 Hours46 Minutes99.950%4 Hours23 Minutes99.990%53 Minutes99.999%5 Minutes99.9999%30 Seconds3
Leading Causes of Downtime Change management Process consistencyTelco/ISP35% Communications LinksPower Failure14% Hardware Failure Design Environmentalissues Natural disastersHardwareFailure12%Human Error31%Unresolved8%SOURCE: Graph Data: The Yankee Group, The Road to a Five Nines Network, Feb 2004.4
Link/Circuit DiversityTHIS Is Better Than EnterpriseTHIS, which Is Better Than ServiceProviderNetworkEnterpriseBut what isbeyond this?THISEnterprise5
Network Point of Presence/Data Center Cable management Power: Diversity/UPS HVAC Hardware placement Physical security Labeling Environmental controlsystems6
Network DesignNetwork ComplexityTechnology Can Increase MTBFPeople, Process, and Politics CanIncrease ComplexityTHIS DECREASES MTBF andIncreases MTTR7
Network DesignPrimary Design Considerations HierarchicalModular and consistentScalableManageableReduced failureDomain (Layer rity8
Examples of Hardware Reliability(Reliability Block Diagrams)Hardware Reliability 99.938% with 4 Hour MTTR (325 Minutes/Year)Hardware Reliability 99.961% with 4 Hour MTTR (204 Minutes/Year)Hardware Reliability 99.9999% with 4 Hour MTTR (30 Seconds/Year)9
Network Availability CalculationR1R2R3R41Router Availability R1, R2, R3 and R416000/(16000 24) 0.9985Can Include Hardware SoftwareComponentsRouter R1, R2, R3 and R4MTBF 16000 HoursMTTR 24 Hours3Availability of R1, R2 in Parallel with R3, R4 1 - ((1-0.997)(1 - 0.997)) 0.9999910442Availability of R1, R2 and R3, R4 inSeries (0.9985 0.9985) 0.997006Network Availability 99.999%Only Base on Device AvailabilityValues; Link Availability Not Included10
High Availability - Layered ApproachApplication LevelResiliencyProtocol LevelResiliencyGlobal Server Load Balancing and positioningGateways, gatekeepers, SIP servers, DB serversNSF/SSO,HSRP, VRRP, GLBP, IP Event Dampening ,Graceful Restart (GR): BGP, ISIS, OSPF, EIGRP, OER, BGPmultipath, fast polling, MARP, incremental SPFTransport/LinkLevel ResiliencyCircuits, SONET APS, RPR, DWDM, Etherchannel,802.1d, 802.1w, 802.1s, PVST ,Portfast, BPDU guard,PagP, LacP,UDLD, Stackwise technology, PPP,Device LevelResiliencyRedundant Processors (RP), Switch Fabric, Line Cards,Ports, Power, CoPP, ISSU, Config Rollback11
NSF/SSO,HSRP, VRRP, GLBP, IP Event Dampening , Graceful Restart (GR): BGP, ISIS, OSPF, EIGRP, OER, BGP . multipath, fast polling, MARP, incremental SPF Global Server Load Balancing and positioning Gateways, gatekeepers, SIP servers, DB servers Protocol Level Resiliency Transport/Link Level Resiliency Device Level Resiliency. Title: Design and .