Transcription
Sandhyarani S et al / (IJCSIT) International Journal of Computer Science and Information Technologies, Vol. 2 (6) , 2011, 2620-2626.NETWORK DELAY: NETWORK ANALYZER ANDOPNET SIMULATION TOOLSANDHYARANI.SCHANDRASEKHAR.GDepartment of Computer Science and EngineeringJoginpally B.R Engineering collegeMoinabad — 500075Abstract— This paper presents a complete networkanalyzer development for network delay in campusenvironment. The purpose of this study is to define theaccuracy of network analyzer development withindependent data, real network and OPNET simulationtool. The network delay will measure based ontransmission delay and propagation delay. Thisnetwork analyzer software will test on delay generatedby the several services. The reliability of this networkanalyzer will test with email, text messaging and instantmessaging over web service. The results show thatnetwork analyzer software has accuracy and sametrend delay with independent data, real network andOPNET simulation tool. Finally, this software is able tomeasure the network delay during preparation,proposal and planning phases.characteristics; iv) identify packet sources or destinations;v) configure alarms for defined threats; vi) and vii) monitorbandwidth utilization.Keywords: Accuracy, Traffic, Network Analyzer, OPNETA network analyzer (also called a protocol analyzer orpacket analyzer) is a combination of hardware andprogramming, or in some cases a stand-alone hardwaredevice, that can be installed in a computer or network toenhance protection against malicious activity. Networkanalyzers can supplement firewalls, antivirus.1. INTRODUCTIONThis study focuses on the accuracy of network delay usingheterogeneous services. This stud does not intend toperform a comprehensive test the functionality of allsimulator and analyzer features. OPNET has originallybeen developed for network simulation and it is fullyusable as a robust and reliability simulation tool withhigher investment. This network analyzer developmentprocess has discussed detail in [1], [2], [3].Serviceperformance requirement consists of delay, capacity(bandwidth) and reliability [4]. Reliability is a measure ofthe network/system ability to provide deterministic andaccurate delivery of information [5], [6]. Delay is a timedifference in transmitting a single unit of information (bit,byte, cell, frame, and packet) from source to destination.2. DEFINITION OF NETWORK ANALYZERA network analyzer also called a "packet analyzer," "trafficanalyzer" and "protocol analyzer," [7]. Network analyzersfunctionality such as [8]: i) provide detailed statistics forcurrent and recent activity on the network; ii) detectunusual levels of network traffic; iii) detect unusual packetNetwork Management: Network management consists ofa variety of tasks, for example, monitoring, configuration,troubleshooting and planning that are performed by usersand network administrators [9]. Network element is acomponent of the network that can be managed. Thisincludes hosts, routers, switches, hubs and server that canbe measured. Examples of end-toend characteristics fornetwork elements and network traffic are capacity(bandwidth), availability, delay, jitter, throughput, networkutilization and error rates [10], [11].2.1 Introduction to Network AnalyzerNetwork analyzers can: Provide detailed statistics for current and recentactivity on the network.Test anti-malware programs and pin pointpotential vulnerabilitiesDetect unusual levels of network traffic.Detect unusual packet characteristics.Identify packet sources or destinations.Configure alarms for defined threats.Search for specific data strings in packets.Monitor bandwidth utilization as a function oftime.Create application-specific plug-ins.Display all statistics on a user-friendly controlpanel2620
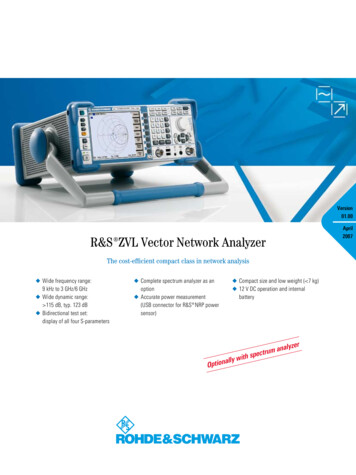
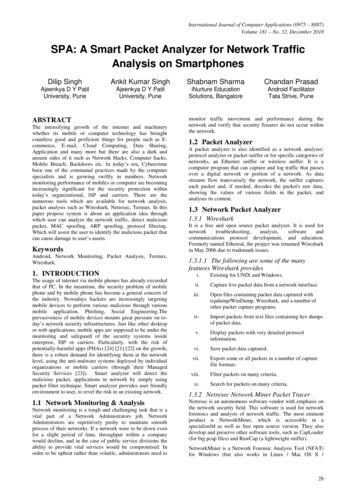
Sandhyarani S et al / (IJCSIT) International Journal of Computer Science and Information Technologies, Vol. 2 (6) , 2011, 2620-2626. Network analyzers are not intended to replacefirewalls, anti-virus programs, or spywaredetection programs. However, the use of anetwork analyzer in addition to othercountermeasures can minimize the probability thatan attack will occur, and can facilitate rapidresponse in the event an attack begins.2.2 Generalized Network Analyzer Block DiagramFigure 1: Comparison of NetworkAnalyzer, OPNET and Real NetworkHere is a generalized block diagram of a network analyzer,showing the major signal-processing sections. In order tomeasure the incident, reflected and transmitted signal, foursections are required: Figure 2 shows network delay reliability test.Source for stimulusSignal-separation devicesReceivers that down convert anddetect the signalsProcessor/display for calculatingand reviewing the results3. METHODOLOGYFigure 1 shows network life cycle approach fortechnologies and services implementation in the future[12]. Network life cycle approach consists of six phasessuch as prepare, plan, design, implement, operate andoptimize. This network analyzer development concentratesmore on preparation, planning and proposal areas. Networkanalyzer development is based on mathematical model. Weuse queuing theory M/M/1 to build this software [13], [14].The reliability test will only concentrate on network delay.The independent data output is generated based onnumber of distance input, number of nodes input, size ofbandwidth input and size of services input. These inputswill use in OPNET, real network and network analyzersoftware (refer to Figure 3).Figure 3: Input Parameters for NetworkAnalyzer, OPNET and Real Network4. NETWORK SIMULATIONSimulation Modeling is becoming an increasingly popularmethod for network performance analysis. Generally, thereare two forms of network simulation: analytical modelingand computer simulation. The first is by mathematicalanalysis that characterizes a network as a set of equations.The main disadvantage is it’s over simplistic view of thenetwork and inability to simulate the dynamic nature of anetwork. Thus, the study of a complex system alwaysrequires a discrete event simulation package, which cancompute the time that would be associated with real eventsin a real-life situation. Software simulator is a valuable toolespecially for today’s network with complex architecturesand topologies. Designers can test their new ideas and carry2621
Sandhyarani S et al / (IJCSIT) International Journal of Computer Science and Information Technologies, Vol. 2 (6) , 2011, 2620-2626.out performance related studies, therefore freed from theburden of the "trial and error" hardware implementations.REAL: REAL is a simulator for studying the dynamicbehavior of flow and congestion control schemes in packetswitch data networks. Network topology, protocols, dataand control parameters are represented by Scenario, whichare described using Net Language, a simple ASCIIrepresentation of the network. About 30 modules areprovided which can exactly emulate the actions of severalwell known flow control protocols (S. Keshav 1997).INSANE: INSANE is a network simulator designed to testvarious IP-over-ATM algorithms with realistic traffic loadsderived from empirical traffic measurements. It's ATMprotocol stack provides real-time guarantees to ATMvirtual circuits by using Rate Controlled Static Priority(RCSP) queueing. A protocol similar to the Real-TimeChannel Administration Protocol (RCAP) is implementedfor ATM signalling. A Tk-based graphical simulationmonitor can provide an easy way to check the progress ofmultiple running simulation processes (INSANEHomepage).NetSim: NetSim is intended to offer a very detailedsimulation of Ethernet, including realistic modeling ofsignal propagation, the effect of the relative positions ofstations on events on the network, the collision detectionand handling process and the transmission deferralmechanism. But it cannot be extended to address modernnetworks (Lewis, Barnett 1993).Maisie: Maisie is a C-based language for hierarchicalsimulation (L. Bagrodia 1991), or more specifically, alanguage for parallel discrete event simulation. A logicalprocess is used to model one or more physical processes;the events in the physical system are modeled by messageexchanges among the corresponding logical processes inthe model. User can also migrate into recent extension:Parsec and MOOSE (an object-orient extension) (RajiveBagrodia 1995).5. OPNET SIMULATOROPNET (Optimized Network Engineering Tool) provides acomprehensive development environment for thespecification, simulation and performance analysis ofcommunication networks. A large range of communicationsystems from a single LAN to global satellite networks canbe supported. Discrete event simulations are used as themeans of analyzing system performance and their behavior.The key features of OPNET are summarized here as: Modeling and Simulation Cycle OPNETprovides powerful tools to assist user to gothrough three out of the five phases in a designcircle(i.e. the building of models, the execution ofa simulation and the analysis of the output data),see Figure 1. Hierarchical Modeling OPNET employs ahierarchical structure to modeling. Each level ofthe hierarch describes different aspects of thecomplete model being simulated.Specialized in communication networksDetailed library models provide support forexisting protocols and allow researchers anddevelopers to either modify these existing modelsor develop new models of their own.Automatic simulation generation OPNETmodels can be compiled into executable code. Anexecutable discrete-event simulation can bedebugged or simply executed, resulting in outputdata.5.1 Hierarchical ModelingOPNET provides four tools called editors to develop arepresentation of a system being modeled. These editors,the Network, Node, Process and Parameter Editors, areorganized in a hierarchical fashion, which supports theconcept of model level reuse. Models developed at onelayer can be used by another model at a higher layer.Figure 2 portrays this hierarchical organization. Thefollowing sections introduce each of the modeling domains.The Parameter Editor is always seen as a utility editor, andnot considered a modeling domain.5.1.1 Network ModelNetwork Editor is used to specify the physical topology ofa communications network, which define the position andinterconnection of communicating entities, i.e., node andlink. The specific capabilities of each node are realized inthe underlying model. A set of parameters or characteristicsis attached with each model that can be set to customize thenode's behavior. A node can either be fixed, mobile orsatellite. Simplex (unidirectional) or duplex (bi-directional)point-to-point links connects pairs of nodes. A bus linkprovides a broadcast medium for an arbitrary number ofattached devices. Mobile communication is supported byradio links. Links can also be customized to simulate theactual communication channels.The complexity of a network model would beunmanageable where numerous networks were beingmodeled as part of a single system. This complexity iseliminated by an abstraction known as a subnetwork. Asubnetwork may contain many subnetworks, at the lowestlevel, a sub network is composed only of nodes and linksCommunications links facilitate communication betweensubnetworks.2622
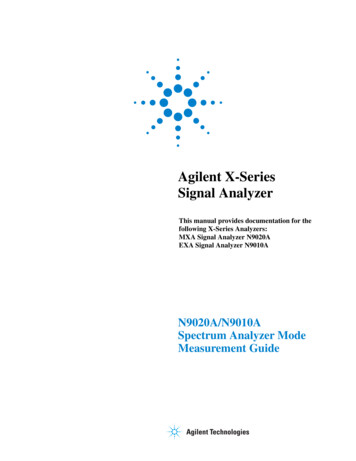
Sandhyarani S et al / (IJCSIT) International Journal of Computer Science and Information Technologies, Vol. 2 (6) , 2011, 2620-2626.support specification of any type of protocol, resource,application, algorithm, or queueing policy. States andtransitions graphically define the progression of a processin response to events. Within each state, general logic canbe specified using a library of predefined functions andeven the full flexibility of the C language. Process maycreate new processes (child process) to perform sub-tasksand thus is called the parent process6. SIMULATION MODEL DEVELOPMENT FORREMOTE DATA TRANSFERFigure 4: Real Heterogeneous Network Environment atMain and Branch CampusMany different types of modeling and simulationapplications are used in various disciplines such asacquisition, analysis, education, entertainment, researchand training [14]. In the Figure 4.1, theoretical model isbased on a random distribution of service duration.Simulation model is divided as follows: i) to study physicalmodel of real heterogeneous network environment; ii)transform physical model of real heterogeneous networkenvironment into logical model; and iii) develop andimplement the heterogeneous simulation model.5.1.2 Node ModelCommunication devices created and interconnected at thenetwork level need to be specified in the node domainusing the Node Editor. Node models are expressed asinterconnected modules. These modules can be groupedinto two distinct categories. The first set is modules thathave predefined characteristics and a set of built-inparameters. Examples are packet generators, point-to-pointtransmitters and radio receivers. The second group containshighly programmable modules. These modules referred toas processors and queues, rely on process modelspecifications.Each node is described by a block structured dataflow diagram. Each programmable block in a Node Modelhas its functionality defined by a Process Model. Modulesare interconnected by either packet streams or statisticwires. Packets are transferred between modules usingpacket streams. Statistic wires could be used to conveynumeric signals.5.1.3 Process ModelProcess models, created using the process editor, are usedto describe the logic flow and behavior of processor andqueue modules. Communication between process issupported by interrupts. Process models are expressed in alanguage called Proto-C, which consists of state transitiondiagrams (STDs), a library of kernel procedures, and thestandard C programming language. The OPNET ProcessEditor uses a powerful state-transition diagram approach to6.1 PHYSICAL MODEL OF REAL LANHETEROGENEOUS ENVIRONMENTFigure 4 shows the network heterogeneous environment inreal world. The physical model of real LAN heterogeneousenvironment is based on multi-services and multi-technologieshas implemented at University of Kuala Lumpur. Then weneed to transform from heterogeneous environment inrealworld into logical model. The logical model is the phasewhere mathematical techniques are used to stimulateheterogeneous environment.7. OPNET ANALYSIS TOOLSimulations can be used to generate a number of differentforms of output, as described above. These forms includeseveral types of numerical data, animation, and detailedtraces provided by the OPNET debugger. In addition,because OPNET simulations support open interfaces to theC language, and the host computer's operating system,simulation developers may generate proprietary forms ofoutput ranging from messages printed in the consolewindow, to generation of ASCII or binary files, and evenlive interactions with other programs. However, the mostcommonly used forms of output data are those that aredirectly supported by Simulation Kernel interfaces forcollection, and by existing tools for viewing and analysis.Both animation data and numerical statistics fall into thiscategory. Animation data is generated either by usingautomatic animation probes or by developing customanimations with the KP's of the Simulation Ker-nel's Anim2623
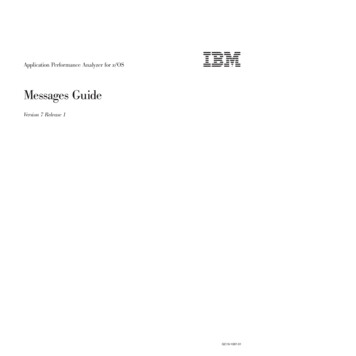
Sandhyarani S et al / (IJCSIT) International Journal of Computer Science and Information Technologies, Vol. 2 (6) , 2011, 2620-2626.package; the m3 vuanim utility is then used to view theanimations. Sim-ilarly, statistic data is generated by settingstatistic probes, and/or by the KP's of the Kernel's Statpackage; OPNET's Analysis Tool can then be used to viewand manip-ulate the statistical data.generating histograms. The data presented in the AnalysisTool may also be operated on by numeric filters. These areconstructed from a pre-defined set of filter elements in theFilter Editor.The service provided by the Analysis Tool is todisplay information in the form of graphs. Graphs arepresented within rectangular areas called analysis panels. Anumber of different operations can be used to createanalysis panels, all of which have as their basic purpose todisplay a new set of data, or to transform an existing one.An analysis panel consists of a plotting area, with twonumbered axes, generally referred to as the abscissa axis(horizontal), and the ordinate axis (vertical). The plottingarea can contain one or more graphs describingrelationships between variables mapped to the two axes.For example, the graph in the panel below shows how thesize of a queue varies as a function of time.7 ACCURACY OF SIMULATION MODEL WITHREAL LAN EXPERIMENTALIn this section, we verify the little law and queuingtheories for heterogeneous simulation model experiments.The experiments are composed of WAN and LANexperiment to real LAN environment. Several tests wereperformed to evaluate the tuned parameters and the valuesthat better ‘mimic’ the characteristics of the real networks.Real experiment is based on real network and need toconsider as follows: i) network bandwidth is limited and isnot enough for all application and users at the same time;ii) delay due to the network overloads; and iii) packetlosses.7.1 EXPERIMENTAL OF REAL NETWORK SETUPWe used a network management application (ColasoftCapsa) to capture traffic between two networks link in realLAN experiments. Figure 5 shows the experimental setupof real network used in our tests. Fluke Optiview devicecan be configured to insert size of packet services andnumber of clients to generate traffic into the networkinterface port By using varying number of clients and sizeof packet services, we are able to simulate network traffic.8. OPNET FILTER TOOLOPNET's Analysis Tool allows the user to extract datafrom simulation output files and to display this data invarious forms, as described in Chapter Data n of theOPNET Modeling Manual. The Analysis Tool alsosupports several mechanisms for numerically processingthe data and generating new data sets that can also beplotted. These include computing probability densityfunctions and cumulative distribution functions, as well asFigure 5: Experimental Laboratory for Real LANEnvironment SetupFilter models are represented as block diagramsconsisting of interconnected filter elements. Filter elementsmay be either built-in numeric processing elements, orreferences to other filter models. Thus, filter models arehierarchical, in that they may be composed of other filtermodels. However, all filter models must be composed atthe lowest level of pre-defined filters discussed in ChapterData n of the OPNET Modeling Manual. Filters operate onvectors. Vectors are discrete and ordered sets of numericdata which consist of entries, as discussed in Chapter Datan of the OPNET Modeling Manual. Each entry consists ofan abscissa and an ordinate value. These are doubleprecision floating point numbers. A filter model mayoperate on one or more vectors and combine them to formits output, which must consist of just one vector. Thevectors that are fed into the filter are called input vectors;the result of the filter‘s processing is called the filter‘soutput vector.9. SIMULATION EXAMPLEFirst, we give out a queueing network example as shown inFigure6. There are three FIFO queues in tandem and eachhas several homogeneous sources. We can specify build inparameters for the source and queue, respectively. Thesource will generate constant length packets in a Poissonmanner with a given rate. The buffer capacity and servicerate for each queue can also be specified. By changing thebuffer capacity and service rate, some simulation results2624
Sandhyarani S et al / (IJCSIT) International Journal of Computer Science and Information Technologies, Vol. 2 (6) , 2011, 2620-2626.are shown in Figure 7 to Figure 9. The end-to-end delayand loss ratio against different service rate values are givenout in Figure 7 and Figure 8, respectively.Figure 6: An example of queueing network10. CONCLUSION AND FUTURE WORKIn this article, we have shown how an analytical queuingnetwork model can be used to understand the behaviors ofheterogeneous environment over Wide Area Network,WAN (real network). The most apparent aspect is the delaydue to the propagation and transmission time. Oursimulation model, has demonstrated that it can measureaccurately the performance of heterogeneous services andtechnologies to transfers data between two networks.Through WAN (real network) experiments, the simulationmodel is verified and validated for providing accurateperformance information for various services. We believethe simulation modeling framework described in this studycan be used to study other variations, tunings, and similarnew ideas for various services and technologies. In networkmanagement, by monitoring and analyzing network delaywe can monitor the performance of the network, thus tostudy whether network is normal, optimal or overloaded.Future work is to develop a simulation model to analyzebandwidth capacity requirement for various services andtechnologies in heterogeneous environment.REFERENCES1.M. Fleury, G. Flores Lucio, and M. J. Reed“Clarification of the ‘OPNET NS-2 Comparison’Paper with. regards to OPNET Modeler”.http://privatewww.essex.ac.uk/ fleum/OPNETNS2 Comparison.pdf, accessed 9/9/2008.2.Brown K, Christianson L, OPNET Lab Manual toAccompany Data and Computer Communications7th ed. And Computer Networking with InternetProtocols and Technology 4th ed. by WilliamStallings, Pearson Prentice Hall, Upper SaddleRiver, NJ, 2005.3.Xinjie Chang. 1999. “Network Simulations WithOPNET”. Proceedings of the 1999 WinterSimulation Conference P. A. Farrington, H. B.Nembhard, D. T. Sturrock, and G. W. Evans, eds.4.James D. McCabe. “Practical Computer NetworkAnalysis and Design”, pp. 15 –40, 1998, MorganKaufmann Publishers.5.MichaelR. Lyu. rnationalConference on Software Engineering, pp. 153170, 2007.6.Abdullah Konak. “Combining network reductionsand simulation to estimate network reliability”,Proceedings of the 39th conference on Wintersimulation, pp. 2301-2305, 2007.Figure 7: End-to-end delay vs. queue buffer capacityFigure 8: Loss ratio vs. queue buffer capaciFigure 9: Node of Ethernet workstation and ATM Switch2625
Sandhyarani S et al / (IJCSIT) International Journal of Computer Science and Information Technologies, Vol. 2 (6) , 2011, 2620-2626.7.Ulf Jonsson. “100BASE-X over SMF 5 Criteria,2002”, (Online),8.Victor A. Clincy & Nael Abu-Halaweh. 2005. “ATaxonomy of free Network Sniffers for teachingand research”, Source” Journal of ComputingSciences in Colleges Vol. 21(1), pp. 64 – 75.9.J. P. Talledo. 2005. “Design and Implementationof an Ethernet Frame Analyzer for High SpeedNetworks”, Proceedings of the 15th InternationalConference on Electronics, Communications andComputers, Publisher IEEE Computer Society pp.171 – 176.10. Jairo A. Gutiérrez. “A connectionless approach tointegrated network management”, InternationalJournal of Network Management Vol. 8(4), pp.219 – 226, 1998, John Wiley & Sons, Inc. NewYork, NY, USA11. Faouzi Kamoun. “Toward best ent”, International Journal of NetworkManagement Vol. 15(5), pp. 321 – 334, 2005,John Wiley & Sons, Inc. New York, NY, USA13. Mohd Nazri Ismail, Abdullah Mohd Zin,"Comparing the Accuracy of End-to-End NetworkPerformanceMeasurementTestbedandSimulation Model for Data Transfers inHeterogeneous Environment," ams, pp. 124 131,IEEE, Second Asia International Conference onModelling & Simulation (AMS), 2008.14. Mohd Nazri Ismail and Abdullah Mohd Zin.“Development of Simulation Model inHeterogeneous Network Environment: Comparingthe Accuracy of Simulation Model for DataTransfers Measurement over Wide AreaNetwork”. Asian Network for ScientificInformation. Information Technology Journal, pp.2448, 2008. ISSN: 1812-5638 (Print). Pakistan.15. Hans Lohninger. “Wireless Networking in theDeveloping World”, January 2007, dw 05 07.html16. DavidGrangier.“TransmissionversusPropagation Delay“, Eurecom Institute, [Onlineaccess], http://www.cse.ust.hk/12. Cisco Networks. 2007. “Cisco’s Life CycleServicesApproach”,CiscoNetworkersConference 07, Januari 2007, Sunway Pyramid,Malaysia.2626
software (refer to Figure 3). Figure 1: Comparison of Network Analyzer, OPNET and Real Network Figure 2 shows network delay reliability test. Figure 3: Input Parameters for Network Analyzer, OPNET and Real Network 4. NETWORK SIMULATION Simulation Modeling is becoming an increasingly popular method for network performance analysis. Generally, there