Transcription
Analyzing Data withGraphPad PrismA companion to GraphPad Prism version 3Harvey MotulskyPresident GraphPad Software Inc.Hmotulsky@graphpad.comGraphPad Software, Inc.
1999 GraphPad Software, Inc. All rights reserved.All Rights Reserved.GraphPad Prism, Prism and InStat are registered trademarks of GraphPadSoftware, Inc. GraphPad is a trademark of GraphPad Software, Inc.Use of the software is subject to the restrictions contained in theaccompanying software license agreement.Citation: H.J. Motulsky, Analyzing Data with GraphPad Prism, 1999,GraphPad Software Inc., San Diego CA, www.graphpad.com.Acknowledgements: The following individuals made substantialcontributions towards development of this book: Arthur Christopoulos(Neuroscience Research in Psychiatry, Univ. Minnesota), Lee Limbird(Dept. Pharmacology, Vanderbilt University), Rick Neubig (Dept.Pharmacology, Univ. Michigan), Paige Searle (Vice-president GraphPadSoftware).How to reach GraphPad:Phone:858-457-3909 (619-457-3909 before June 12, 1999)Fax:858-457-8141 (619-457-8141 before June 12, 1999)Email:support@graphpad.com or d Software, Inc.5755 Oberlin Drive #110San Diego, CA 92121 USAContentsPreface.2Introduction to statistical comparisons.3Garbage in, garbage out . 3When do you need statistical calculations? . 3The key concept: Sampling from a population. 4Confidence intervals . 8P values . 9Hypothesis testing and statistical significance. 11Statistical power . 13A Bayesian perspective on interpreting statistical significance. 15Beware of multiple comparisons . 17Outliers. 18Analyzing one group.23Entering data to analyze one group . 23Frequency distributions . 24Column statistics. 25Interpreting descriptive statistics. 26The results of normality tests. 29The results of a one-sample t test. 30The results of a Wilcoxon rank sum test. 34Row means and totals . 37t tests and nonparametric comparisons .39Introduction to comparing of two groups . 39Entering data to compare two groups with a t test (or a nonparametric test) . 39Choosing an analysis to compare two groups. 41The results of an unpaired t test. 45The results of a paired t test . 51The results of a Mann-Whitney test . 57The results of a Wilcoxon matched pairs test. 59One-way ANOVA and nonparametric comparisons .65Introduction to comparisons of three or more groups. 65Choosing one-way ANOVA and related analyses . 67The results of one-way ANOVA . 72The results of repeated measures one-way ANOVA . 82The results of a Kruskal-Wallis test . 85The results of a Friedman test. 89Two-way analysis of variance.93Introduction to two-way ANOVA. 93Entering data for two-way ANOVA. 93
Choosing the two-way ANOVA analysis . 94The results of two-way ANOVA . 97Interpreting the results of nonlinear regression.207Introduction to survival curves . 109Entering survival data . 109Choosing a survival analysis . 112Interpreting survival analysis. 113Graphing survival curves . 120Approach to interpreting nonlinear regression results. 207Do the nonlinear regression results make sense? . 208How certain are the best-fit values? . 209How good is the fit? . 212Does the curve systematically deviate from the data?. 214Could the fit be a local minimum? . 216Have you violated an assumption of nonlinear regression?. 217Have you made a common error when using nonlinear regression?. 218Contingency tables .121Comparing two curves.221Survival curves .109Introduction to contingency tables . 121Entering data into contingency tables . 122Choosing how to analyze a contingency table. 123Interpreting analyses of contingency tables . 124The confidence interval of a proportion . 131Correlation.135Introduction to correlation. 135Entering data for correlation. 135Choosing a correlation analysis. 136Results of correlation. 137Linear regression .141Introduction to linear regression. 141Entering data for linear regression . 143Choosing a linear regression analysis. 143Results of linear regression . 146Graphing linear regression. 152Fitting linear data with nonlinear regression. 153Introducing curve fitting and nonlinear regression.157Introduction to models . 157How models are derived . 158Why Prism can’t pick a model for you. 161Introduction to nonlinear regression. 162Other kinds of regression. 166Fitting a curve without choosing a model. 167Choosing or entering an equation (model) .171Classic equations built-in to Prism. 171Importing equations and the equation library . 178User-defined equations . 181Constraining variables in user-defined equations . 187How to fit different portions of the data to different equations . 190How to simulate a theoretical curve . 193Fitting curves with nonlinear regression .195Fitting curves with nonlinear regression. 195Initial values for nonlinear regression . 197Constants for nonlinear regression. 199Method options for nonlinear regression. 200Output options for nonlinear regression. 204Default options for nonlinear regression . 205Comparing the fits of two models. 221Comparing fits to two sets of data (same equation). 224The distributions of best-fit values .229Why care about the distribution of best-fit values . 229Using simulations to determine the distribution of a parameters . 229Example simulation 1. Dose-response curves. . 230Example simulation 2. Exponential decay. . 231Detailed instructions for comparing parameter distributions . 234Analyzing radioligand binding data .237Introduction to radioligand binding . 237Law of mass action. 238Nonspecific binding. 240Ligand depletion. 241Calculations with radioactivity . 241Analyzing saturation radioligand binding data .249Introduction to saturation binding experiments . 249Nonspecific binding. 249Fitting a curve to determine Bmax and Kd. 250Checklist for saturation binding. 252Scatchard plots . 253Analyzing saturation binding with ligand depletion . 257Analyzing competitive binding data .263What is a competitive binding curve? . 263Competitive binding data with one class of receptors. 266Shallow competitive binding curves . 268Homologous competitive binding curves. 273Competitive binding to two receptor types (different Kd for hot ligand). 282Heterologous competitive binding with ligand depletion . 284Analyzing kinetic binding data .287Dissociation ("off rate") experiments. 287Association binding experiments. 288Analysis checklist for kinetic binding experiments . 291Using kinetic data to test the law of mass action. 291Kinetics of competitive binding. 293Analyzing dose-response curves .297Introducing dose-response curves. 297Fitting sigmoid dose-response curves with Prism . 300Why Prism fits the logEC50 rather than EC50 . 301
Other measures of potency: pEC50, EC80, EC90, etc. . 302Checklist. Interpreting a dose-response curve. . 304The operational model of agonist action . 305Dose-response curves in the presence of antagonists . 311Analyzing enzyme kinetic data.317Introduction to enzyme kinetics . 317How to determine Vmax and KM . 321Comparison of enzyme kinetics with radioligand binding . 322Displaying enzyme kinetic data on a Lineweaver- Burke plot . 323Allosteric enzymes. 325Enzyme kinetics in the presence of an inhibitor. 325Reading unknowns from standard curves.329Introduction to standard curves. 329How to fit standard curves. 330Determining unknown concentrations from standard curves . 331Standard curves with replicate unknown values . 332Problems with standard curves. 333Preprocessing data.335General. 335Transforming data . 335Normalizing data. 339Pruning rows . 340Subtracting (or dividing by) baseline values . 341Transposing rows and columns . 343Analyzing continuous data.345Smooth, differentiate or integrate a curve. 345Area under the curve. 347Appendix. Using GraphPad Prism to analyze data .351The Prism User's Guide. 351Projects, sections and sheets . 351How to analyze data with Prism. 352Changing an analysis . 353Analyzing repeated experiments . 353Intuitive Biostatistics (book) . 355Technical support . 355PrefaceGraphPad Prism combines scientific graphics, statistics and curve fitting inan easy to use program. If you don't already have Prism, go towww.graphpad.com to learn about Prism and download a freedemonstration version.Please also check our web site for a list of any corrections to this book, andfor additional information on data analysis. Tell your colleagues that thisentire book is available on the web site as an Acrobat pdf file.GraphPad Prism comes with two volumes, of which you are reading one.The other volume, Prism User's Guide, explains how to use Prism. Thisbook, Analyzing Data with GraphPad Prism, explains how to pick anappropriate test and make sense of the results.This book overlaps only a bit with my text, Intuitive Biostatistics, publishedby Oxford University Press (ISBN 0195086074). The goal of IntuitiveBiostatistics is to help the reader make sense of statistics encountered in thescientific and clinical literature. It explains the ideas of statistics, without alot of detail about analyzing data. Its sections on ANOVA and nonlinearregression are very short. The goal of this book (Analyzing Data withGraphPad Prism) is to help you analyze your own data, with an emphasison nonlinear regression and its application to analyzing radioligandbinding, dose-response, and enzyme kinetic data.If you have any comments about this book, or suggestions for the future,please email me at hmotulsky@graphpad.comIndex.357Harvey MotulskyMarch 1999Analyzing Data with GraphPad Prism2Copyright (c) 1999 GraphPad Software Inc.
Statistical analyses are necessary when observed differences are smallcompared to experimental imprecision and biological variability. Whenyou work with experimental systems with no biological variability and littleexperimental error, heed these aphorisms:Introduction to statisticalcomparisonsIf you need statistics to analyze your experiment, then you've done thewrong experiment.If your data speak for themselves, don't interrupt!But in many fields, scientists can't avoid large amounts of variability, yetcare about relatively small differences. Statistical methods are necessary todraw valid conclusions from such data.The key concept: Sampling from a populationGarbage in, garbage outComputers are wonderful tools for analyzing data. But like any tool, dataanalysis programs can be misused. If you enter incorrect data or pick aninappropriate analysis, the results won't be helpful. Heed the first rule ofcomputers: Garbage in, garbage out.Sampling from a populationWhile this volume provides far more background information than mostprogram manuals, it cannot entirely replace the need for statistics texts andconsultants. If you pick an inappropriate analysis, the results won't beuseful.To do this, statisticians have developed methods based on a simple model:Assume that all your data are randomly sampled from an infinitely largepopulation. Analyze this sample, and use the results to make inferencesabout the population.GraphPad provides free technical support when you encounterproblems with the program. However, we can only providelimited free help with choosing statistics tests or interpreting theresults (consulting can sometimes be arranged for a fee).When do you need statistical calculations?When analyzing data, your goal is simple: You wish to make the strongestpossible conclusion from limited amounts of data. To do this, you need toovercome two problems: Important differences can be obscured by biological variability andexperimental imprecision. This makes it difficult to distinguish realdifferences from random variability. The human brain excels at finding patterns, even from random data.Our natural inclination (especially with our own data) is to concludethat differences are real, and to minimize the contribution of randomvariability. Statistical rigor prevents you from making this mistake.Introduction to statistical comparisons3www.graphpad.comThe basic idea of statistics is simple: you want to extrapolate from the datayou have collected to make general conclusions about the largerpopulation from which the data sample was derived.This model is an accurate description of some situations. For example,quality control samples really are randomly selected from a largepopulation. Clinical trials do not enroll a randomly selected sample ofpatients, but it is usually reasonable to extrapolate from the sample youstudied to the larger population of similar patients.In a typical experiment, you don't really sample from a population. But youdo want to extrapolate from your data to a more general conclusion. Theconcepts of sample and population can still be used if you define thesample to be the data you collected, and the population to be the data youwould have collected if you had repeated the experiment an infinitenumber of times.Note that the term sample has a specific definition in statisticsthat is very different than its usual definition. Learning newmeanings for commonly used words is part of the challenge oflearning statistics.Analyzing Data with GraphPad Prism4Copyright (c) 1999 GraphPad Software Inc.
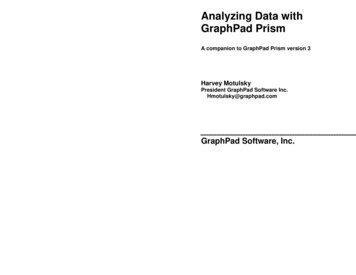
The need for independent samplesIt is not enough that your data are sampled from a population. Statisticaltests are also based on the assumption that each subject (or eachexperimental unit) was sampled independently of the rest. The concept ofindependence can be difficult to grasp. Consider the following threesituations. You are measuring blood pressure in animals. You have five animalsin each group, and measure the blood pressure three times in eachanimal. You do not have 15 independent measurements, because thetriplicate measurements in one animal are likely to be closer to eachother than to measurements from the other animals. You shouldaverage the three measurements in each animal. Now you have fivemean values that are independent of each other. You have done a biochemical experiment three times, each time intriplicate. You do not have nine independent values, as an error inpreparing the reagents for one experiment could affect all threetriplicates. If you average the triplicates, you do have threeindependent mean values. You are doing a clinical study, and recruit ten patients from an innercity hospital and ten more patients from a suburban clinic. You havenot independently sampled 20 subjects from one population. Thedata from the ten inner-city patients may be closer to each other thanto the data from the suburban patients. You have sampled from twopopulations, and need to account for this in your analysis.Data are independent when any random factor that causes a value to betoo high or too low affects only that one value. If a random factor (that youdidn’t account for in the analysis of the data) can affect more than onevalue, but not all of the values, then the data are not independent.How you can use statistics to extrapolate from sampleto populationStatisticians have devised three basic approaches to make conclusionsabout populations from samples of data:The first method is to assume that the populations follow a specialdistribution, known as the Gaussian (bell shaped) distribution. Once youassume that a population is distributed in that manner, statistical tests letyou make inferences about the mean (and other properties) of thepopulation. Most commonly used statistical tests assume that thepopulation is Gaussian.The second method is to rank all values from low to high, and thencompare the distribution of ranks. This is the principle behind mostIntroduction to statistical comparisons5www.graphpad.comcommonly used nonparametric tests, which are used to analyze data fromnon-Gaussian distributions.The third method is known as resampling. With this method, you create apopulation of sorts, by repeatedly sampling values from your sample.This isbest understood by an example. Assume you have a single sample of fivevalues, and want to know how close that sample mean is likely to be fromthe true population mean. Write each value on a card and place the cardsin a hat. Create many pseudo samples by drawing a card from the hat, andreturning it. Generate many samples of N 5 this way. Since you can drawthe same value more than once, the samples won’t all be the same. Whenrandomly selecting cards gets tedious, use a computer program instead.The distribution of the means of these computer-generated samples givesyou information about how accurately you know the mean of the entirepopulation. The idea of resampling can be difficult to grasp. To learn aboutthis approach to statistics, read the instructional material available atwww.resample.com. Prism does not perform any tests based onresampling. Resampling methods are closely linked to bootstrappingmethods.Limitations of statisticsThe statistical model is simple: Extrapolate from the sample you collectedto a more general situation, assuming that your sample was randomlyselected from a large population. The problem is that the statisticalinferences can only apply to the population from which your samples wereobtained, but you often want to make conclusions that extrapolate evenbeyond that large population. For example, you perform an experiment inthe lab three times. All the experiments used the same cell preparation, thesame buffers, and the same equipment. Statistical inferences let you makeconclusions about what would happen if you repeated the experimentmany more times with that same cell preparation, those same buffers, andthe same equipment. You probably want to extrapolate further to whatwould happen if someone else repeated the experiment with a differentsource of cells, freshly made buffer and different instruments.Unfortunately, statistical calculations can't help with this furtherextrapolation. You must use scientific judgment and common sense tomake inferences that go beyond the limitations of statistics. Thus, statisticallogic is only part of data interpretation.The Gaussian distributionWhen many independent random factors act in an additive manner tocreate variability, data will follow a bell-shaped distribution called theGaussian distribution, illustrated in the figure below. The left panel showsthe distribution of a large sample of data. Each value is shown as a dot,Analyzing Data with GraphPad Prism6Copyright (c) 1999 GraphPad Software Inc.
with the points moved horizontally to avoid too much overlap. This iscalled a column scatter graph. The frequency distribution, or histogram, ofthe values is shown in the middle panel. It shows the exact distribution ofvalues in this particular sample. The right panel shows an ideal Gaussiandistribution.ColumnScatter GraphFrequency Distribution orHistogram250Probability Density501005000102030405060Bin Center70010203040506070ValueThe Gaussian distribution has some special mathematical properties thatform the basis of many statistical tests. Although no data follow thatmathematical ideal exactly, many kinds of data follow a distribution that isapproximately Gaussian.The Gaussian distribution is also called a Normal distribution.Don’t confuse this use of the word “normal” with its usualmeaning.The Gaussian distribution plays a central role in statistics because of amathematical relationship known as the Central Limit Theorem. Tounderstand this theorem, follow this imaginary experiment:1. Create a population with a known distribution (which does not haveto be Gaussian).2. Randomly pick many samples from that population. Tabulate themeans of these samples.3. Draw a histogram of the frequency distribu
analysis programs can be misused. If you enter incorrect data or pick an inappropriate analysis, the results won't be helpful. Heed the first rule of computers: Garbage in, garbage out. While this volume provides far more background information than most program manuals, it cannot entirely replace the need for statistics texts and consultants.