Transcription
Open Journal of Business and Management, 2016, 4, 301-311Published Online April 2016 in SciRes. /10.4236/ojbm.2016.42032Internal Control, Life Cycle and EarningsQuality—An Empirical Analysis from Chinese MarketTingting ChenSchool of Management, Jinan University, Guangzhou, ChinaReceived 25 March 2016; accepted 23 April 2016; published 26 April 2016Copyright 2016 by author and Scientific Research Publishing Inc.This work is licensed under the Creative Commons Attribution International License (CC tractWhether internal controls can effectively constrain earnings management, which is a hot topic inrecent years. I investigate the impact of internal control on earnings quality based on a life cycleperspective using data of listed companies of China’s market from 2010-2013. The empirical findings indicate that high quality internal control can suppress accrual earnings management andreal earnings management (except for discretionary expenses manipulating earnings management) effectively, whilst in different life cycle stages (LCSs), the relation between internal controlquality and accounting earnings quality (accrual quality and real earnings quality) is different. Forthe accrual quality aspect, in mature LCS, internal control quality and accrual quality is positivelycorrelated. In growth or decline LCS, the relation between internal quality and accrual quality isnot significant. For the real earnings quality aspect, in decline LCS, high quality internal controlcan improve real earnings quality; in growth LCS or mature LCS, the relation is just the opposite.KeywordsInternal Control, Life Cycle, Earnings Quality1. IntroductionIn the US capital market, since the enactment of “Sarbanes-Oxley Act”, managers are required to assess and report on the effectiveness of internal control over financial reporting, and to disclose the existence of any MWs,thus providing possibility to measure internal control quality. Doyle et al. (2007) find that weaknesses are generally associated with poorly estimated accruals that are not realized as cash flows [1]. In addition, plenty offindings indicate that compared to companies with effective internal control, companies with existing materialweaknesses have more accruals noise [2] [3]. Gao et al. (2009) find that provisions of SOX internal control reHow to cite this paper: Chen, T.T. (2016) Internal Control, Life Cycle and Earnings Quality. Open Journal of Business andManagement, 4, 301-311. http://dx.doi.org/10.4236/ojbm.2016.42032
T. T. Chenduce the quality of accounting information [4]. Altamuro and Beatty (2010) find that the internal control regulation improve the information quality [5].Domestic studies on the relationship between earnings management and internal control start later, whetherinternal control can effectively suppress earnings management remains disputed. Zhang Guoqing (2008) selectsseven metrics to measure corporate earnings management; empirical results show that high-quality internal control is not accompanied by high-quality accruals [6]. Zhang et al. (2010) find that compared to companies without internal control audit, companies with internal control audit have high accrual quality [7]. Since then, furtherresearch of earnings management on internal control focuses on accruals management and real earnings management. Fang Hongxing and Jin Yuna (2011) find that good internal control can effectively suppress accrualsmanagement behavior and real earnings management activities [8]. Fan et al. (2013) find that high quality internal control helps to inhibit the company’s accruals earning management behavior, but the relation between highquality internal control and real earnings management is not significant [9].Taken together, there has been debate on whether internal control can significantly restrain earnings management. Moreover, the life cycle of the enterprise is not taken into consideration, companies at the different stagesof life cycle are regarded as the same, which is clearly not in line with the actual situation, and this will reducethe credibility of the findings. The author deems that the effect internal control on earnings quality is not isolatedand absolute; the specific environment should not be neglected. Therefore, the author introduces corporate lifecycle theory to analyze the relation between internal control quality and earnings quality in different life cyclestages.To test the effect of life cycle, the author constructs two indicator variables to reflect corporate life cycle.Following Dickinson (2011), the author employs cash flow patterns to classify the firm-level life cycle. The author divides life cycle as four stages: introduction, growth, mature and decline. Given that most listing companies has gone through introduction stage, so this paper mainly discusses the relation between internal controlquality and earning quality in three life cycle stages. Consistent with expectations, results in this study indicatethat in different life cycle stages (LCSs), the relation between internal control quality and accounting earningsquality (accrual quality and real earnings quality) is different.This study makes several important contributions to the existing literature and informs current regulatory discussions. First, my findings extend those of Fang Hongxing (2011) by introducing life cycle theory into the research of internal control and earnings management. As Dickinson (2011) states that firm life cycle stages haveimportant implications for understanding the financial performance of firms, it is feasible and possible to incorporate life cycle theory [10]. Second, my findings are helpful for auditors to spot companies’ earnings management behavior. For firms on the growing or mature stage, they are more cautious in earnings manipulation,compared to accrual management, they are more inclined to choose real earnings management. Third, concerning whether effective internal control can suppress earnings management, this study provide empirical evidenceto support that internal control is positively related to earnings quality.The remainder of the paper is organized as follows. Section 2 provides background and hypothesis development. Section 3 describes the research design and methodology. Section 4 presents the main findings and robustness tests. The paper concludes in Section 5.2. Background and Hypothesis Development2.1. Internal Control and Earnings QualitySeveral studies have investigated relations between internal control and earnings management. Weaknesses aregenerally associated with poorly estimated accruals that are not realized as cash flows (Doyle et al. 2007).Compared to companies with effective internal control, companies with existing material weaknesses have lower earnings quality (Ashbaugh-Skaife et al., 2008, Chan et al., 2008). Moreover, the internal control regulationcan improve the profitability of continuing to increase future cash flow predictability, thereby helping to improve the quality of financial reporting (Altamuro et al., 2010).Furthermore, Chinese studies on internal control and Earnings Management are still controversial. Some statethat good internal controls can enhance earnings quality. Zhang Longping et al. (2010) find that compared tocompanies without internal control audit, companies with internal control audit have higher accruals quality. FanJinghua et al. (2013) find that high quality internal control helps to inhibit the company’s accrual-based earningsmanagement behavior, but the relation between high quality internal control and real earnings management is302
T. T. Chennot significant. Fang Hongxing and Jin Yuna (2011) find that good internal controls can effectively suppress accruals management behavior and real earnings management activities. Others insist that good internal control ishelpless in enhancing earnings quality. Zhang Guoqing (2008) selects seven metrics to measure corporate earnings management, empirical results show that high-quality internal control is not accompanied by high-qualityearnings. Therefore, the relation between internal control and earnings quality is to be further explored.The mechanism that Internal control inhibits earnings management is mainly manifested in two ways: first,the internal controls within the firms contributes to achieving a balance of powers, and hence reducing the likelihood of unintentional misstatements and intentional manipulation; second, internal control’s intrinsical objectives is to ensure reasonable legal compliance and authentic financial reporting, internal control can inhibit realearnings management activities or other short-sighted behavior, and therefore maximize firm value. Based onthe above analysis, the author propose the following hypotheses:H1: Internal control quality is positively associated with accruals quality.H2: Internal control quality is positively associated with real earnings quality.2.2. Firm-Level Life Cycle, Quality of Internal Control and Accounting Earnings QualityIn the early nineteen fifties, Mason Haire points out “biology life cycle can be used in business firms”, thus theconcept “firm life cycle” is proposed. Since then, many scholars study on the firm life cycle from different angles, so far, there are over twenty theoretical models, among which, Victoria Dickinson’s classification methodis the most widespread, he divides the firm life cycle into five stages: introduction, growth, mature, shake-outand decline. The most representative opinion in China is raised by Li Mingyu (2006), which divide life cycle asincubation, birth and survival, growth, mature and decline; some studies divide the firm life cycle into start-up,growth, mature and decline. By reviewing firm life cycle theory domestic and abroad, the author divide lifecycle into introduction, growth, mature and decline.The severity of agent problem is different at different stages of firm life cycle, the effect of internal control isvarying. Miller and Friesen (1984) state that in the introduction LCS, firm’s owner is predominant, and organization structure is informal, the role of internal control at this time is not important [11]. In the growth LCS,sales grow rapidly, plenty of resources are accumulated, and organizational structure is much more formal,managers are predominant. If scientific control system is established, firms are less likely to out of control. Inthe mature LCS, sales keep stable and innovation level drop [12], bureaucratic organizational structure is established. Firm’s controllability and flexibility are balance, sound institutional and organizational structures canprotect creativity and flexibility. In the decline LCS, firms are bureaucratic, rules and regulations are invalid,contradiction is severe among organizations. Therefore, for mature firms, internal control can significantly improve the efficiency and effectiveness of operations; for growth, mature and decline firms, internal control cansignificantly improve the quality of accounting information. Based on the discussion above, the author proposethe following hypothesis:H3: In the different stage of firm-level life cycle, the relation between internal control and earnings quality isdifferent.3. Research Design and Methodology3.1. Sample SelectionThe sample is comprised of firms listed on the Shanghai and Shenzhen A-share stock exchanges with necessarydata on CSMAR. The sample period extends from 2010 through 2013. Firms with missing equity, profit, asset,return on equity (ROE) are excluded from the sample. Finally, financial firms are excluded because capital constraints materially alter their cash flow structure relative to other industries. These criteria result in a final sampleof 4116 firm-year observations.3.2. Variable Measurement3.2.1. Measure of Firm-Level Life CycleThe author employs cash flow patterns to proxy firm-level life cycle. The patterns provide a parsimonious indicator of life cycle stage that is free from distributional assumptions (i.e., uniformity). The proxy identifies differential behavior in the persistence and convergence patterns of profitability. Given that the majority of China’s303
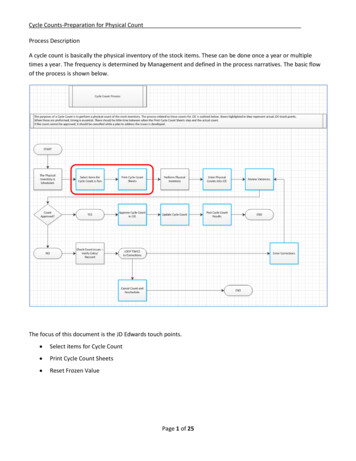
T. T. Chenlisted companies have generally gone through the introduction period, so this enterprise life cycle is divided intogrowth, mature and decline stages. Specific partitioning method shown in Table 1. The author proxy life cycleby using two indicator variables (LCMATURE and LCGROWTH).3.2.2. Measure of Internal Control QualityThe author selects Internal Control of Listed Companies Index issued by DIB Enterprise Risk Management Ltd.to evaluate internal control quality. The index system corporates financial data from annual reports, “corporategovernance”, “Important events”, “Internal Control Self-Evaluation Report”, etc., this index combines internalcontrol objectives, internal control elements and financial data to quantify the quality of internal controls, whichcan capture internal control quality more accurately. The author proxy the internal control quality (ICQ) by using the natural logarithm of the index.3.2.3. Measures of Accrual QualityThe higher the degree of earnings management, the lower earnings quality (Lei Ying, 2013), and therefore earnings management can be used to measure earnings quality. Following Dechow (1995), the author measure theaccrual quality using the modified Jones model.TDAt At 1 β 0 β1 (1 At 1 ) β 2 ( REVt RECt ) At 1 β3 ( PPEt At 1 ) µt(1)TDAt At 1 β 0 β1 (1 At 1 ) β 2 ( REVt RECt ) At 1 β3 ( PPEt At 1 )(2) DAt At 1 TDAt At 1 NDAt At 1(3)where TDAt is the sum of accrual earnings in year t; NDAt is accruals that cannot be manipulated; DAt is the absolute value of µt, which represents the accruals management; At 1 is the total asset of year t 1; ΔREVt is thecurrent year change in sales; ΔRECt is the current year change of accounts receivable; PPEt is the current yearlevel of property, plant and equipment [13].3.2.4. Measures of Real Earnings QualityFollowing Roychowdhury (2006), the author investigate three different REM methods: sales manipulation(proxied by the abnormal level of cash flow from operations), reducing (increasing) discretionary expenditures(proxied by the abnormal level of discretionary expenditures), and increasing (decreasing) earnings by reducing(increasing) the cost of goods sold by overproducing (under producing) inventory (proxied by the abnormal level of production cost).CFOt At 1 α 0 α1 (1 At 1 ) α 2 ( St At 1 ) α 3 ( St At 1 ) ε t (6)where CFOt is the sum of the cash flow from operating in year t; St is the net sales; At 1 is the total asset of yeart 1; the absolute value of estimated residuals represent the abnormal level of operating cash flows (ACFO).DISEXPt At 1 α 0 α1 (1 At 1 ) α 2 ( St 1 At 1 ) ε t(7)where DISEXPt is the dicretionary expenditures (i.e., the sum of advertising expense, research and development,and selling, general and administrative) in year t; At 1 is the total asset of year t 1; the absolute value of estimated residuals represent the abnormal level of discretionary expenses (ADISEXP).PRO Dt At 1 COGSt At 1 INV At 1(8)Table 1. Cash flow patterns of life cycle stages.IntroductionGrowthMatureNet Cash flows from operating activities Net Cash flows from investing activities Net Cash flows from financing activities 304DeclineOther combinationsother than the firstthree combinations
COGSt At 1 α 0 α1 (1 At 1 ) α 2 ( St At 1 ) ε t INV α 0 α1 (1 At 1 ) α 2 ( St At 1 ) α 3 ( St 1 At 1 ) ε tt At 1 PRODt At 1 α 0 α1 (1 At 1 ) α 2 ( St At 1 ) α 3 ( St At 1 ) α 4 ( St 1 At 1 ) ε tT. T. Chen(9)(10)(11)where PRODt is the sum of the cost of goods sold in year t (COGSt) and the change in inventory from t 1 to t(ΔINVt); At 1 is the total asset of year t 1; the absolute value of estimated residuals of Equation (11) is the abnormal level of production costs (APROD).SREM-Proxyt At 1 APRODt At 1 ACFOt At 1 ADISEXPt At 1(12)where SREM-Proxyt is the sum of real earnings management. At 1 is the total asset of year t 1.3.2.5. Control VariablesThe following five control variables were adapted from Ye et al. (2012). The author control for company sizeby including the natural logarithm of current total asset (SIZE); to control for the effect of indebtedness onearnings management, The author include the current year’s leverage (LEV) in the model; the author add the return on equity (ROE) and growth rate of sales (GROWTH); to control for the effect of owner’s characteristic,The author include an indicator variable for state-owned firms (STATE). Year and industry fixed effects controlfor temporal variation and industry differences in earnings management. The variables are defined in AppendixA.3.3. Model SpecificationTo test H1 and H2 on earnings management, the author estimates the following OLS regression model:EM it β 0 β1ICQit β 2 X ε it(13)where EM is a group of earnings management which includes the accrual-based earnings manipulation (DA),abnormal level of operating cash flows (ACFO), the abnormal level of discretionary expenses (ADISEXP), theabnormal level of production costs (APROD) and the sum of real earnings management (SREM); ICQ is the internal control quality; X represents control variables group.To test H3 on earnings management, the author estimated the following OLS regression model:EM it β 0 β1LCGROWTHit β 2 LCMATURE it β3 ICQit β 4 LCGROWTHit ICQit β5 LCMATURE it ICQit β 6 X it ε it(14)where EM is a group of earnings management which includes the accrual-based earnings manipulation (DA),abnormal level of operating cash flows (ACFO), the abnormal level of discretionary expenses (ADISEXP), theabnormal level of production costs (APROD) and the sum of real earnings management (SREM); LCGROWTHis a dummy variable set to 1 if a firm is classified as growth firm, and 0 otherwise; LCMATURE is also an indicator variable set to 1 if a firm is classified as mature firm, and o otherwise. ICQ is the internal control quality;X represents control variables group.4. Results4.1. Descriptive Statistics and Univariate AnalysisTable 2 presents descriptive statistics of major variables. The mean (median) values of the variables of earningsquality are the following: DA is 0.060 (0.042), ACFO is 0.062 (0.045), ADISEXP is 0.053 (0.037), APROD is0.091 (0058), SREM is 0.206 (0.151). The mean (median) value of ICQ is 6.488 (6.526), GROWTH is 0.164(0.093), ROE is 0.070 (0.067), LEV is 0.448 (0.449), SIZE is 21.974 (21.795).Turning to the difference of growth, mature and decline, the author divide samples into three subsamples, andcarry out an univariate analysis, the results presented in Table 3. DA, ACFO and SREM are significantly higherfor decline firms, and then mature firms; ADISEXP is significantly higher for mature firms. Overall, the univariate results seem to provide initial support for H3; firms in different life cycle have different earnings quality.305
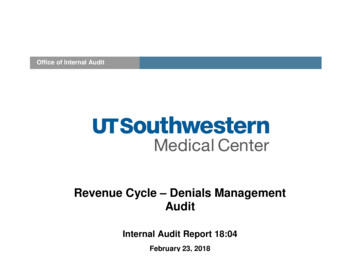
T. T. ChenTable 2. Descriptive statistics of major TURE0.3900.4880.0000.0001.000GROWTH0.1640.436 0.4990.0932.939ROE0.0700.098 01.000Table 3. Univariate analysis of major variables.MeanT eclineGrowth-DeclineDA0.0470.0570.076 4.7982*** 7.5947*** 10.4450***ACFO0.0420.0580.085 8.1978*** 12.5864*** 19.6362***ADISEXP0.0520.0560.050 1.83433.0809***1.024APROD0.0810.0900.103 2.0704** 3.1004*** 4.6373***SREM0.1750.2040.238 4.2329*** 5.0814*** 8.9254***ICQ6.5046.5056.451 *** 2.1466**1.573ROE0.0760.0850.045 2.7359**10.6098***7.7612***Lev0.48140.39810.4797 10.5118***9.6834*** tate0.4740.4450.4341.5483.36290.5561.9953*p 0.05, **p 0.01, ***p 0.001.The innate variables associated with earnings quality also tend to be different in different life cycle.4.2. Multivariate Analysis of Earnings Quality and Internal ControlThe first column of results in Table 4 contains the regression estimates of accruals-based earnings managementon internal control quality, internal control quality is negatively related to the accruals-based earnings management, supporting H1 and suggesting effective internal control can suppress accruals management. The economicmagnitude of the coefficient on ICQ is significant (t 2.79). The second column contains the regression estimates of sum of real earnings management on internal control quality, the coefficient between SREM and ICQ306
T. T. ChenTable 4. Earnings quality and internal control.(1)(2)DASREM 0.0206ICQ 0.0404**( 2.79)GROWTH0.03520.113SIZE***(8.36) 0.02430.411(4)ACFO*( 2.30)***(7.29)ROE(3) 0.0161**( 2.81)0.0251***(7.47)***0.105***(5)APRODADISEXP 0.0222 0.00199*( 2.10)0.0633***(5.51)0.227***( 0.38)0.0241***(7.01)0.0795***( 1.37)(8.13)(7.51)(6.34)(5.85) 0.00686*** 0.0119*** 0.00386*** 0.00428* 0.00379***( 6.60)( 4.44)( 4.31)( 2.39)( .30)(4.43)(5.47)(3.57)(0.85) 0.00316 0.000992 0.003940.00177( 2.63)( 0.52)( 0.50)( 0.99)(0.87)************LEV 1160.14590.08330.11400.0689N2Adj. R0.1033***t statistics in parentheses. p 0.05, p 0.01,***p 0.001.is significantly negative, supporting H2 and indicating that effective internal control can restrain real earningsmanipulation. Columns (3)-(5) report results of the abnormal level of operating cash flows (ACFO), the abnormal level of discretionary expenses (ADISEXP) and the abnormal level of production costs (APROD) on internal control quality. Both ACFO and APROD are negatively related to internal control quality, significant at 0.05level in column (3) and at 0.10 level in column (4). For ADISEXP, the coefficient on internal control quality isnegative but not significant in economic magnitude. Possible explanations are as follows: for one thing, effectiveinternal control can suppress earnings management by manipulating discretionary expenses, making the actualdiscretionary expenses close to expected discretionary expenses, increasing the discretionary expense-basedearnings quality; for another, effective internal control can promote the management efficiency, reducing thediscretionary expenses, making actual discretionary expenses lower than expected discretionary expenses, whichmeans discretionary expense-based earnings quality go down. These two adverse effects exist at the same time,which makes it unclear whether effective internal control can improve discretionary expense-based earningsquality.The OLS regression results of earnings quality on internal control and life cycle are reported in Table 5. Thefirst column of results in Table 5 contains the regression estimates of accruals-based earnings management oninternal control quality and life cycle, the coefficient between DA and ICQ is not significant, suggesting declinefirms’ internal control has no effect on accruals quality. ICQ LCMATURE is negatively related to DA, whichmeans compared to other firms, mature firms’ internal control is positively related to accruals quality. Thesecond column contains the regression estimates of sum of real earnings management on internal control qualityand life cycle, the coefficient between SREM and ICQ is significantly negative, suggesting that effective internal control of decline firms can constrain real earnings manipulation. The coefficient between SREM andLCGROWTH ICQ, LCMATURE ICQ is significantly positive, suggesting that for growth and mature firms,the higher internal control quality, the higher level of real earnings management, which indicates that compared307
T. T. ChenTable 5. Earnings quality, internal control quality and life cycle.ICQ(1)(2)DASREM 0.08520.00197(0.15)LCGROWTH 0.570(1.69)0.260**(2.58)LCGROWTH ICQ0.09420.113LEV0.437APROD 0.0295 0.0391*****( 3.43)( 3.05) 0.174 0.153* 0.243*( 2.37)( 2.36)***( 767*** 0.271*** 0.223( 3.63)( **(8.69)(5.67)(9.08)(6.61) 0.00550*** 0.00811** 0.00394*** 0.00134 0.00283( 5.28)( 3.04)( 4.41)( 1.53)( .12)(4.14)(1.19)(4.59)(3.40) 0.003860.00159 0.00125 0.00420( 0.65)(0.78)( 0.67)( 1.06)***0.371*****( 2.76)cons***ACFO( 0.95) 0.00613STATE***(8.39) 0.0171SIZE**(2.70)(7.35)ROE**(5)( 2.89) 0.155(3.02)0.0356 0.0166** 0.649( 1.95)***ADISEXP( 3.17)**0.0768**(4)( 3.49)( 2.87)( 2.70)GROWTH*** 0.0301 0.0419LCMATURE ICQ***( 641160.17190.07220.18440.1230Adj. R20.1292***t statistics in parentheses. p 0.05, p 0.01,***p 0.001.to accruals management which is easily detected by outsiders, growth firms and mature firms are more inclinedto employ real earnings manipulation. Columns (3)-(5) report results of the abnormal level of operating cashflows (ACFO), the abnormal level of discretionary expenses (ADISEXP) and the abnormal level of productioncosts (APROD) on internal control quality and life cycle. Results and explanations are similar to column (2).Findings above support H3.4.3. Robust AnalysisAccounting to Fang (2011), there is a certain substitution effect between internal control and external audit, andthe cost of the audit has an impact on the substitution effect. In this paper, The author add audit opinion(AUDITTYPE) and audit costs (AUDITCOST) to the OLS model, the results still support the hypothesis, resultsof robots analysis are reported in Table 6.308
T. T. ChenTable 6. Robust analysis.ICQ(1)(2)DASREM 0.08510.00115(0.09)LCGROWTH 0.553(1.67)0.260LCGROWTH ICQLCMATURE ICQGROWTH** 0.154 0.162 0.238*( 2.49)( 2.31)( 2.84) 0.640 0.143 0.276 0.221***0.0742**0.0239**0.01780.0325*( 1.93)(2.92)(2.85)(1.77)(2.02) 0.0420**0.0927**0.0228*0.0380**0.0319( 46(8.37)0.440 8)***(5.87)**( 2.75)******(7.18)***(8.65)***(8.00) 0.00574***( 5) 0.000225 0.00320( 0.21)( 1.40)0.0226***0.0415***(4.34) 1.20e 09(3.41) 1.62e 101.18e 09( 0.73)(0.68)(3.70)( 2.39)(0.25)0.007730.01070.00631 0.0007500.00513(0.58)(0.35)(0.60)( 0.06)(0.28) 0.003950.00151 0.00140 0.00406( 0.66)(0.74)( 0.75)( 1.02)***0.373*** 0.00649**( 2.91)cons( 3.03)* 0.0298( 4.40)STATE( 3.41)**( 1.77) 0.00517AUDITTYPE 0.0390**( 3.63)( 0.93)AUDITCOST 0.0296( 1.96) 0.0168LEVAPROD***( 2.86)( 3.39)**ACFO( 2.80)(7.32)SIZE*** 0.0164**(5)(2.58)0.0355ROE(4)ADISEXP***( 4.23)0.167LCMATURE(3)0.1540.905***2.08e 090.263******0.269*2.98e 50.18510.1226Y20.1292***t statistics in parentheses. p 0.05, p 0.01,***p 0.001.5. ConclusionsThe author examines the relation between earnings quality and internal control quality based on the life cycleperspective, and finds that firms with effective internal control have higher earnings quality. However, the relation between earnings quality and internal control quality varies across life cycle stages. Specifically, maturefirms’ internal control quality is positively related to accruals quality, however, the internal control quality ofgrowth and decline firms do not seem to have relation with accrual quality; for decline firms, internal controlquality is positively related to real earnings quality, whereas, for growth and mature firms, the relation betweeninternal control quality and real earnings quality is just opposite, suggesting that growth and mature firms are309
T. T. Chenmore discreet in choosing methods of earnings management. Compared to accruals management, which is easilydetected or constrained by outsiders, they are more inclined to manipulate real operational activities.The findings of this study extend the research on internal control over financial reporting and the research onreal earnings management by providing a new perspective on situations that can provide fertile ground for REM.This study is important especially to outsiders for assessing management’s susceptibility to exercise effectiveinternal control, which is difficult for outsiders. This study identifies a setting where there is a greater risk forinformation distortion.References[1]Doyle, J.T., Ge, W. and McVay, S. (2007) Accruals Quality and Internal Control over Financial Reporting. The Accounting Review, 82, 141-1170. hbaugh-Skaife, H., Collins, D. and Kinney, W. (2008) The Effect of SOX Internal Control Deficiencies and TheirRemediation on Accrual Quality. The Accounting Review, 83, 217-250. n, K.C., Farrell, B. and Lee, P. (2008) Earnings Management of Firms Reporting Material Internal Control Weaknesses under Section 404 of the Sarbanes-Oxley Act. AUDITING: A Journal of Practice & Theory, 27, 1[4]Gao, F., Wu, J.S. and Zimmerman, J. (2009) Unintended Consequences of Granting Small Firms Exemptions fromSecurities Regulation: Evidence from the Sarbanes-Oxley Act. Journal of Accounting Research, 47, 459-506.http:/
out internal control audit, companies with internal control audit have high accrual quality [7]. Since then, further research of earnings management on internal control focuses on accruals management and real earnings man-agement. Fang Hongxing and Jin Yuna (2011) find that good internal control can effectively suppress accruals