Transcription
PRL 115, 217602 (2015)PHYSICAL REVIEW LETTERSweek ending20 NOVEMBER 2015High-Resolution Faraday Rotation and Electron-Phonon Coupling in Surface States of theBulk-Insulating Topological Insulator Cu0.02 Bi2 Se31Liang Wu,1,* Wang-Kong Tse,2,3 M. Brahlek,4,† C. M. Morris,1 R. Valdés Aguilar,1,5N. Koirala,4 S. Oh,4 and N. P. Armitage1,‡The Institute for Quantum Matter, Department of Physics and Astronomy, The Johns Hopkins University,Baltimore, Maryland 21218, USA2Theoretical Division, Los Alamos National Laboratory, Los Alamos, New Mexico 87545, USA3Department of Physics and Astronomy, MINT Center, University of Alabama, Tuscaloosa, Alabama 35487, USA4Department of Physics and Astronomy, Rutgers the State University of New Jersey, New Jersey, Piscataway 08854, USA5Department of Physics, The Ohio State University, Columbus, Ohio 43210, USA(Received 15 February 2015; published 16 November 2015)We have utilized time-domain magnetoterahertz spectroscopy to investigate the low-frequency opticalresponse of the topological insulator Cu0.02 Bi2 Se3 and Bi2 Se3 films. With both field and frequencydependence, such experiments give sufficient information to measure the mobility and carrier density ofmultiple conduction channels simultaneously. We observe sharp cyclotron resonances (CRs) in bothmaterials. The small amount of Cu incorporated into the Cu0.02 Bi2 Se3 induces a true bulk insulator withonly a single type of conduction with a total sheet carrier density of 4.9 1012 cm2 and mobility as highas 4000 cm2 V · s. This is consistent with conduction from two virtually identical topological surfacestates (TSSs) on the top and bottom of the film with a chemical potential 145 meV above the Dirac pointand in the bulk gap. The CR broadens at high fields, an effect that we attribute to an electron-phononinteraction. This assignment is supported by an extended Drude model analysis of the zero-field Drudeconductance. In contrast, in normal Bi2 Se3 films, two conduction channels were observed, and wedeveloped a self-consistent analysis method to distinguish the dominant TSSs and coexisting trivial bulk ortwo-dimensional electron gas states. Our high-resolution Faraday rotation spectroscopy on Cu0.02 Bi2 Se3paves the way for the observation of quantized Faraday rotation under experimentally achievableconditions to push the chemical potential in the lowest Landau level.DOI: 10.1103/PhysRevLett.115.217602PACS numbers: 76.40. b, 72.10.Di, 78.20.Ls, 78.66.DbTopological insulators (TIs) are a newly discovered classof materials characterized by an inverted band structure [1,2]caused by strong spin-orbit coupling. In the ideal case, theyhave an insulating bulk and only conduct via topologicallyprotected massless Dirac topological surface states (TSSs).Spin-momentum locking in their electronic structure makesTIs promising platforms for spintronics applications [3].Progress in this field has been hampered by the fact that alldiscovered TIs to date are slightly doped and have a conducting bulk. For instance, the proposed topological magnetoelectric effect [4] and quantized Faraday rotation [5]remain unobserved. Tuning the chemical potential towardsthe Dirac point and enhancing mobility were shown to bevery successful in probing many-body interactions withplasmons and phonons in graphene [6], and similar advancements are expected in TIs but have not yet been realized.The band structure of Bi2 Se3 is one of the simplest ofthe 3D TIs with only a single Dirac cone at the centerof the Brillouin zone. Unfortunately, native-grown Bi2 Se3is known to have a conducting bulk due to defects from thegrowth. Suppression of the bulk carrier density has beenachieved by chemical-doping methods [7,8]. Nevertheless,these samples still have significant densities of bulk carriers0031-9007 15 115(21) 217602(6)or impurity states that are pinned near EF. Recently, it wasfound that 2% Cu doping in thin films suppresses the bulkcarriers and allows a true insulating state to be realized [9].Here we investigate these copper-doped bulk insulating thinfilms and their decoupled TSSs [9] via magnetoterahertzspectroscopy. These films were capped by a thin insulatingamorphous Se layer. Details of the growth can be found inSupplemental Material Sec. I [10] and in Ref. [9].Cyclotron resonance (CR) experiments using terahertzspectroscopy are a powerful tool to study Dirac fermionsand probe many-body interactions [21,22]. CR is also oneof the most accurate measures of effective mass [23]. Inprevious work, a large Kerr rotation in bulk-conductingBi2 Se3 films was reported, but no obvious resonance wasobserved [24]. Cyclotron resonance has been reported inIn2 Se3 capped films [25], but the current understanding isthat significant indium diffusion from In2 Se3 to Bi2 Se3 [26]destroys the simple non-TI–TI boundary at the interface,as a topological phase transition occurs at low indiumconcentrations ( 6%) [27].In the present work, we used time-domain magnetoterahertz spectroscopy with the polarization modulation technique [28] (0.5 mrad resolution; see Supplemental Material217602-1 2015 American Physical Society
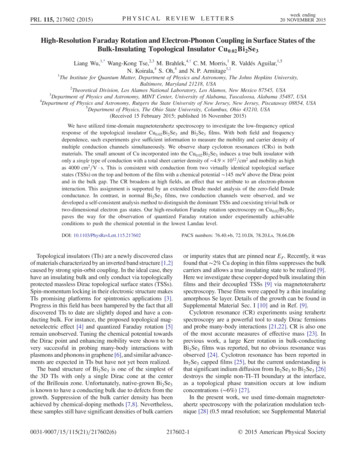
ð1ÞHere Γ’s are scattering rates, ωp’s are plasma frequencies,and d is the film thickness. The spectral weight (ω2pD d) isproportional to the integrated area of each feature in the realpart of the conductance. It gives the ratio of carrier density toan effective transport mass:Z2n e2GD1 dω ¼ ω2pD d ¼ 2D :ð2Þπϵ0m ϵ0Here m is defined as ℏkF vF for “massless Dirac fermions.”Considering the TSS dispersion up to quadratic correctionsE ¼ AkF þ Bk2F , the spectral weight can be expressed interms of kF , where A and B are parameters obtained fromARPES (see Supplemental Material Sec. II [10]):kF ðA þ 2BkF Þe2:2πℏ2 ϵ0ð3ÞThis expression assumes that the single-channel conductionoriginates in two nominally identical TSSs. From the spectralweight analysis, having determined kF , we can then calculate both n2D (proportional to k2F ) and m . From theseDrude-Lorentz fits, we find a total sheet carrier densityn2D 5.0 1012 cm2 , m 0.14me , and EF 145ð 5Þ meVaccording to Eq. (3).We can estimate the carrier density and mass by thezero-field spectra alone, because both can be expressed as afunction of kF . Below, we determine the mass in a(b)(c)GD1 (10 1/ )64QL Cu0.02Bi2Se35KG1 (10 1/Ω)1.0-3150.00.21.0Frequency (THz)1064QL Bi2Se3564QL Cu0.02Bi2Se31 Drude Fit2.01.51.00.500.51.01.5Frequency (THz)64QL Cu0.02Bi2Se3 5K2.52.0-3203.03.025-3Real conductance G1(10 1/ y (THz)0.0564QL Cu0.02Bi2Se3 5K0.05θF (radians)θF (radians)0.00-0.050.00-0.05-0.100T to 7Twith 0.25T step-0.100T to 7Twith 0.25T step-0.150.4(e) 1.40.81.2Frequency (THz)1.6(f)1.2 ωc/2π (0.1978 0.0009)B10020030040000θF (radians)1.0 m* 0.14me0.81000.6200EC 220meVEF 145meV3000.40.20.40.81.2Frequency (THz)0.100.050.001.6Field-dependentscattering rateZero-fieldscattering rateθFθF Data-0.05-0.10400Sec. I for experimental details [10]) to observe sharp cyclotron resonances in Faraday rotations from both Cu0.02 Bi2 Se3and pure Bi2 Se3 thin films. We demonstrate that Cu0.02 Bi2 Se3can be described by a single Drude component with totalcarrier density n2D 4.9 1012 cm2. This Drude contribution is consistent with pure surface state transport with anEF 145 meV above the Dirac point (75 meV below theconduction band edge), which makes Cu0.02 Bi2 Se3 a truetopological insulator. CR broadening at a high field is attributed to an electron-phonon interaction. In contrast, we findtwo-channel conduction in pure Bi2 Se3 films. We determinethat the large Faraday rotation is induced by a dominanthigh-mobility TSS channel with an EF 350 meV.However, a weaker low-mobility second Drude term isalso required to fit the data. This subdominant term mostlikely derives from trivial states (bulk and/or 2DEG).In Fig. 1(a), we compare the zero-field terahertz conductance of a 64 QL Cu0.02 Bi2 Se3 film to a pure 64 QL Bi2 Se3film. The Cu incorporated sample’s spectra are characterizedby a reduced total spectral weight and slightly lowerscattering rate than the pure Bi2 Se3 . The spectra can be wellfit by an oscillator model with only a Drude term describingfree electronlike motion, a Drude-Lorentz term modeling thephonon, and a lattice polarizability ϵ term that originatesfrom absorptions above the measured spectral range: ω2pDiωω2pDLGðωÞ ¼ ϵ0 d iðϵ 1Þω :iω ΓD ω2DL ω2 iωΓDLω2pD d ¼week ending20 NOVEMBER 2015PHYSICAL REVIEW LETTERSωc/2π (THz)PRL 115, 217602 (2015)7T0.0-0.150123 4 5Field (T)670.40.81.2Frequency (THz)1.6FIG. 1 (color online). Data summary for 64 quintuple layer(QL) Cu0.02 Bi2 Se3 (sample1). (a) Real sheet conductance of64 QL Cu0.02 Bi2 Se3 and pure Bi2 Se3 films at 5 K. The inset is theDrude conductance GD of 64 QL Cu0.02 Bi2 Se3 after subtractingthe phonon and ϵ contributions. The arrow indicates thedeviation from pure Lorentzian form that arises from electronphonon coupling. (b) Field-dependent conductance at 5 K.Arrows are guides to the eye for cyclotron frequencies. (c) Realand (d) imaginary parts of the complex Faraday rotation data atdifferent fields at 5 K. (e) Cyclotron frequency versus field.The solid line is a linear fit. The inset is a cartoon indicatingEF 145 meV above the Dirac point (75 meV below theconduction band minimum). (f) Complex Faraday angle withfits at 7 T. The solid curve is a fit with a field-dependent scatteringrate. The dashed curve is a fit using the zero-field scattering rate.Arrows are guides to the eye for cyclotron frequency.model-free fashion through CR experiments. The signatureof CR is a peak in the real part of the conductance[Fig. 1(b)], an inflection point in the real part of Faradayrotation θ0F [Fig. 1(c)], and a dip in the imaginary part ofFaraday rotation θ00F [Fig. 1(d)]. Its full width at halfmaximum (FWHM) is the scattering rate. Field-dependentcomplex Faraday rotation data are shown in Figs. 1(c) and1(d). One can see that an edge feature around an inflectionpoint in θ0F and a dip in θ00F shifts to higher frequency withincreasing field, which is consistent with CR. We fit thedata by a Drude-Lorentz model accounting for the fielddependence of the Drude term and constraining theparameters of the phonon and ϵ by the values extractedfrom the zero-field conductance fits. The conductance in amagnetic field can be described by the expression217602-2
PRL 115, 217602 (2015)week ending20 NOVEMBER 2015PHYSICAL REVIEW LETTERS ω2pDω2pDLG ¼ iϵ0 ωdþ ðϵ 1Þ :þ ω2 iΓD ω ωc ω ω2DL ω2 iωΓDLFor the same reason, the plateaulike Faraday rotation at 7 Tat low frequencies in Fig. 2(f) is as large as 0.25 rad,while the value for the Cu0.02 Bi2 Se3 sample is 0.07 rad.In Figs. 2(b)–2(d), one can see that the CR is exhibited atlower frequencies, which indicates that Bi2 Se3 has a higherCR mass. In Fig. 2(e), the linear fit of ωc versus B gives aneffective mass 0.20me . We believe that this derives fromTSSs, as this mass is inconsistent with the accepted valuesfor the bulk bands [32] or band-bending-induced surface2DEG bands [33]. Note that the value of the CR mass inBi2 Se3 we determine here is different than that given in ourprevious work [24]. The reason for this discrepancy isdiscussed at length in Supplemental Material Sec. VI [10].One can see from Fig. 2(f) that fits of the Faraday rotationusing only a single Drude term are reasonably good. As(b)100QL Bi2Se3 5K-340101086420G1 (10 1/Ω)-360G1(10 1/ )-3G1(10 1/ )(a)0.4 0.8 1.2THz100QL Bi2Se3 5K2 Drude fit1 Drude fit200.51.01.5Frequency (THz)40T2T4T6T0.4(d)100QL Bi2Se3 5K1T3T5T7T0.81.2Frequency (THz)1.60.10.00.1θF (radians)θF (radians)602.0(c)0.28200.0-0.10T to 7Twith 0.25 step-0.2-0.1-0.2-0.30T to 7Twith 0.25 step-0.4-0.30.40.81.2Frequency (THz)1.6(e)0.4(f)1.00.2ωc/2π (0.1423 0.0007)B0.8 m* 0.20me100100EF 350meV2000.4θF0.120000θF (radians)0.6300ωc/2π (THz)Here the sign signifies the response to right- or left-handcircularly polarized light, respectively. ωc is the CRfrequency to be defined below. The Faraday rotation canbe expressed as tanðθF Þ ¼ iðtþ t Þ ðtþ þ t Þ [29].Note that the Faraday equation is a complex quantity,because, in addition to rotations, phase shifts that aredifferent for right- or left-hand polarized light canbe accumulated. The imaginary part is related to theellipticity [28].The fits to this model for the Faraday rotation are shownfor a representative field of 7 T in Fig. 1(f) (seeSupplemental Material Sec. II for fits to all fields [10]).In this plot, the dashed curves are from a fit with thespectral weight and scattering rate 0.4 THz set by thezero-field conductance fit (e.g., only ωc allowed to vary).One can see that, although the gross features of the spectraare reproduced, using the zero-field scattering rate entiretyfails to reproduce certain aspects of the Faraday rotation,including the value of the minimum in θ00F . A much better fit(solid line) can be obtained by letting the scattering ratevary with the field while keeping other parameters (exceptfor ωc ) fixed. The origin of this field-dependent scatteringrate will be addressed below. The fits allow us to extract thecyclotron frequency as a function of field; it is exhibitedby the raw spectra as the minimum in θ00F . As shown inFig. 1(e), a linear fitting using the expected relationbetween the mass and the resonance frequency ωc ¼eB m gives an effective mass of 0.14me . By usingEq. (2) and the spectral weight obtained from fittingFaraday rotation, we can extract a total sheet carrier densityn2D ¼ 4.9 0.1 1012 cm2 . With the known band structure of Bi2 Se3 , this charge density, and the observationof a single kind of charge carrier, is consistent only withtwo essentially identical TSSs and an EF 145 meV abovethe Dirac point. We can conclude that Cu0.02 Bi2 Se3 hasan insulating bulk and for the sample highlighted here ahigh mobility μ ¼ e ΓD m 4000 cm2 V · s. The featureswere robust to sample aging, as the samples (with theamorphous Se cap) maintain bulk-insulating and highmobility after sitting in air for eight months (seeSupplemental Material Sec. II [10]).Films of Cu0.02 Bi2 Se3 can be contrasted with films ofpure Bi2 Se3 , which is known to have the surface chemicalpotential pinned in the bulk conduction band [30,31]. Wedevelop a self-consistent data analysis method and use ourhigh-resolution magnetoterahertz spectroscopy to preciselydetermine the contribution of the subdominant bulk. InFig. 2(a), we show zero-field conductance spectra from atypical 100 QL Bi2 Se3 film. It has higher spectral weightthan Cu0.02 Bi2 Se3 , consistent with a higher charge density.ð4Þ0.20.81.2Frequency (THz)1.65K 7TθF Data2 Drude fit1 Drude fit0.0-0.1-0.2-0.30.00123 4 5Field (T)670.40.81.2Frequency (THz)1.6FIG. 2 (color online). (a) Real conductance of 100 QL Bi2 Se3comparing single- and two-component Drude fits as detailed inthe text. The inset enlarges the low-frequency regime. (b) Fielddependent conductance at 5 K. (c) The real and (d) imaginaryparts of the complex Faraday rotation data at different fields at5 K. (e) The cyclotron resonance frequency versus field. The insetis a cartoon indicating EF 350 meV above the Dirac point.(f) Complex Faraday rotation data with one- and two-componentDrude fits at 7 T. The dashed and solid curves are one- andtwo-Drude fits, respectively.217602-3
PHYSICAL REVIEW LETTERSPRL 115, 217602 (2015)before, we use the spectral weight and CR mass by Eq. (2)to extract a total sheet carrier density n2D 1.9 0.1 1013 cm2 . This compares favorably to a density ofn2D 2.0 1013 cm2 , a mass of 0.20me , and an EF 350 meV that we can determine purely from an analysis ofthe spectral weight using the TSS dispersion by Eq. (3). Wedetermine a mobility of μ 3200 cm2 V · s of the TSSs.However, while the fits to the Faraday rotation with asingle Drude term are excellent, significant discrepanciesarise if we use the resulting parameters to fit the conductance data. In Fig. 2(a), one can see that the single Drudecomponent fit significantly underestimates the conductanceby a roughly constant amount over the entire spectral range.As EF is in the bottom of the conduction band, it isreasonable to ascribe this difference to a subdominant lowmobility conduction channel originating in the bulk or2DEG. Adding a second term with a large scattering rate(Γ 2π 4 THz such that the contribution to the realconductance is a constant offset) improves the conductancefit dramatically. If literature values for the bulk or 2DEGmass are used, this channel has a carrier density of n2D 8.0 1012 cm2 and a low mobility of μ 300 cm2 V · s.The second flat Drude term adds only a featurelesssmall background to the Faraday rotation. The ratioG1TSS G1total 90% at low frequencies confirms thatTSSs dominate transport as inferred in previous terahertzmeasurements [24,27].Having identified the transport channels in these filmsand their relevant parameters, we can look in more detailat the magnetic field dependence of the scattering rates.As shown in Fig. 3(a), the scattering rate ΓD 2π inCu0.02 Bi2 Se3 increases with cyclotron frequency or field,displaying a maximum near a cyclotron frequency of0.9 0.1 THz. As discussed in Supplemental MaterialSec. III [10], we can exclude magnetic-field-induced spinor orbital-based electronic mechanisms for this broadening[34]. We plot the scattering rate versus the cyclotronfrequency instead of versus the magnetic field in order(a)ωc/2π (THz)0.40.8(b)1.21.6Kohn anomaly β surface phonon0.71.4mRN*/mbScattering rates (THz)0.00.60.50.41.21.0ΓD*(ω)/2π EDM analysisΓD/2π Faraday rotation fit0.30.00.80.4Frequency (THz)1.20.80.20.40.60.81.01.2Frequency (THz)FIG. 3 (color online). (a) The scattering rate as a functionof cyclotron frequency (red). The fully renormalizedscattering rate by mass through extended Drude analysisas a function of frequency (green). The black arrow indicatesβ surface phonon frequency at the Kohn anomaly. (b) Therenormalized mass as a function of frequency. The error barsexpress the uncertainty in ωpD .week ending20 NOVEMBER 2015to allow a direct comparison with the measurement andphonon frequencies. One can understand the magnetic fieldas an energy-sampling process as follows. With increasingfield, the Drude peak center frequency ωc shifts to higherenergies. As the Drude peak overlaps with the phononfrequency, one expects the scattering rate to reach itsmaximum value and saturate, as one generally expectsthat the CR will become broader at frequencies above therelevant phonon frequency because new scattering channelsemerge. Similar CR broadening has been observed inGaInAs quantum wells and graphene and ascribed toelectron-phonon coupling [35,36].An extended Drude model (EDM) analysis [37] of thezero-field Drude conductance supports the inference thatthe broadening is due to coupling to a low-energy modesuch as a phonon. Such an analysis allows one to quantifysubtle deviations from pure Drude behavior (e.g., pureLorentzian form) as shown in the inset in Fig. 1(a) in theform of frequency-dependent mass renormalizationsm RN ðωÞ and scattering rates ΓD 2πðωÞ shown in Fig. 3.In such an analysis, one inverts the Drude intrabandcontribution to the conductance (GD ) via Eqs. (5): ω2pD d11;¼ReΓD ðωÞ ¼τðωÞGD4π ω2pD dm RN ðωÞ1:¼ ImmbGD4πωð5ÞHere mb is the band mass without interaction renormalization. An EDM analysis shows a frequency-dependentscattering rate ΓD ðωÞ and an electron-phonon couplingconstant (λ ¼ ðm RN mb Þ 1) defined at the dc limit 0.55 0.05. Since the mass renormalization here isreasonably small, we approximate the bare plasma frequency with the value extracted from zero-field conductance or CR fits.From the EDM parameters we can define the “fullyrenormalized” scattering rate Γ D ðωÞ ¼ ΓD ðωÞ ½m RN ðωÞ mb , which is manifested as the actual width of the lowfrequency Drude feature [e.g., the ΓD of Eq. (4)] [38].Plotting this quantity in Fig. 3(a), we find that the generaltrend and energy scales of the scattering rate from the EDMare about the same as those from the CR fit. One can seethat the result from EDM is a sharper version of the curvefrom the CR fit, which may be expected because the CR fitassumed a frequency-independent scattering rate, and assuch means it is an average over a (weakly) frequencydependent quantity.For the first time, we have demonstrated a correspondence between the spectral features in a CR experiment andEDM analyses, which indicates that the magnetic fielditself is not the source of the CR broadening. We proposeelectron-phonon coupling as the cause of these effects[39–42], as the energy scale of the threshold in the217602-4
PRL 115, 217602 (2015)PHYSICAL REVIEW LETTERSscattering rate matches that of a number of electron-phononscales in this system. The value is close to the scale of thepreviously observed Kohn anomaly of the surface βphonon, 0.75 THz at 2kF [40,43]. It also matches closelythe scale of the maximum acoustic phonon energy thatcan couple to cross Fermi surface scattering c 2kF 2π 0.6 THz (where c is the acoustic phonon velocity) [41].The coupling strength λ extracted by EDM is close tothe value λ 0.43 by analysis of the Kohn anomaly [44]and also agrees with the calculation λ 0.42 for acousticphonons in thin film geometry [42]. The coupling constantwe observed is within the different values ARPES gives[45–47]. The energy scale of the 3 meV mode found viaARPES in Ref. [47] agrees well with the characteristicenergy here. The lower coupling strength we observed maybe due to the lower chemical potential of our sample thanthat used in Ref. [47].Looking forward, our results demonstrate the possibilityof observing a quantized Faraday rotation in such filmsof a TI. For the quantized Faraday rotation of a filmon a substrate, one has tanðθF Þ ¼ 2α ð1 þ nÞðν þ 1 2Þ 3.5 mradðν þ 1 2Þ for each surface state in the quantumregime, where α is the fine structure constant, ν is the fillingfactor, and n is the substrate index of �ffiffiffiffiLandau level spectrum will be Eð νÞ ¼ vF 2eℏBjνj.In order to reach the lowest Landau level in this truetopological insulator Cu0.02 Bi2 Se3 will require 150 T,which may be achievable for future terahertz experimentsat pulse field facilities. Electric field gating the presentsamples in a terahertz-compatible arrangement would bringdown this field threshold. We hope our high-resolutionFaraday rotation spectroscopy will enable the observationof the long-sought quantized Faraday rotation and topological magnetoelectric effect [4,5].We thank A. Kuzmenko, G. Refael, and S. Valenzuelafor discussions and L. Pan for assistance with the figures.Terahertz measurements at JHU and film growth anddevelopment at Rutgers were supported by NSF DMR1308142, with additional support by the Gordon and BettyMoore Foundation through Grant No. GBMF2628 to N. P.A. at JHU and EPiQS Initiative Grant GBMF4418 to S. O.at Rutgers and by ONR-N000141210456 at Rutgers. Workat Los Alamos National Laboratory (LANL) was carriedout under the auspices of the U.S. Department of Energy atLANL under Contract No. DE-AC52-06NA25396.*lwu29@jhu.eduPresent address: Department of Materials Science andEngineering, Pennsylvania State University, UniversityPark, PA 16801, USA.‡npa@jhu.edu[1] M. Z. Hasan and C. L. Kane, Rev. Mod. Phys. 82, 3045(2010).[2] X.-L. Qi and S.-C. Zhang, Rev. Mod. Phys. 83, 1057 (2011).†week ending20 NOVEMBER 2015[3] D. Pesin and A. H. MacDonald, Nat. Mater. 11, 409(2012).[4] X.-L. Qi, T. L. Hughes, and S.-C. Zhang, Phys. Rev. B 78,195424 (2008).[5] W.-K. Tse and A. H. MacDonald, Phys. Rev. Lett. 105,057401 (2010).[6] D. Basov, M. Fogler, A. Lanzara, F. Wang, and Y. Zhang,Rev. Mod. Phys. 86, 959 (2014).[7] Z. Ren, A. A. Taskin, S. Sasaki, K. Segawa, and Y. Ando,Phys. Rev. B 82, 241306 (2010).[8] J. Xiong, A. Petersen, D. Qu, Y. Hor, R. Cava, and N. Ong,Physica (Amsterdam) 44E, 917 (2012).[9] M. Brahlek, N. Koirala, M. Salehi, N. Bansal, and S. Oh,Phys. Rev. Lett. 113, 026801 (2014).[10] See Supplemental Material at tt.115.217602Experimental methods, more data and discussion onCu0.02 Bi2 Se3 and Bi2 Se3 , calculations about transport lifetime of the topological insulators in external magnetic fields,effects of Se and In2 Se3 capping, discussions on one-Drudecomponent and two-Drude-component fits, role of copperand band bending, which includes Refs. [11–20].[11] R. Valdés Aguilar, L. Wu, A. V. Stier, L. S. Bilbro, M.Brahlek, N. Bansal, S. Oh, and N. P. Armitage, J. Appl.Phys. 113, 153702 (2013).[12] L. Wu, M. Brahlek, R. V. Aguilar, A. V. Stier, C. M. Morris,Y. Lubashevsky, L. S. Bilbro, N. Bansal, S. Oh, andN. P. Armitage, Nat. Phys. 9, 410 (2013), supplementaryinformation.[13] Y. Cao et al., Nat. Phys. 9, 499 (2013).[14] Y. Zhang et al., Nat. Phys. 6, 584 (2010).[15] C. H. Yang, F. M. Peeters, and W. Xu, Phys. Rev. B 82,075401 (2010).[16] O. E. Raichev and F. T. Vasko, Quantum Kinetic Theory andApplications (Springer, New York, 2005).[17] D. Culcer and S. Das Sarma, Phys. Rev. B 83, 245441(2011); D. Culcer, E. H. Hwang, T. D. Stanescu, and S. DasSarma, Phys. Rev. B 82, 155457 (2010).[18] T. Ando and Y. Uemura, J. Phys. Soc. Jpn. 36, 959 (1974);T. Ando, J. Phys. Soc. Jpn. 36, 1521 (1974); 37, 622 (1974);37, 1233 (1974).[19] N. H. Shon and T. Ando, J. Phys. Soc. Jpn. 67, 2421 (1998);Y. Zheng and T. Ando, Phys. Rev. B 65, 245420 (2002).[20] I. Dmitriev, A. Mirlin, D. Polyakov, and M. Zudov, Rev.Mod. Phys. 84, 1709 (2012).[21] I. Crassee, J. Levallois, A. Walter, M. Ostler, A. Bostwick,E. Rotenberg, T. Seyller, D. Van Der Marel, and A.Kuzmenko, Nat. Phys. 7, 48 (2011).[22] Z. Jiang, E. A. Henriksen, L. C. Tung, Y.-J. Wang, M. E.Schwartz, M. Y. Han, P. Kim, and H. L. Stormer, Phys. Rev.Lett. 98, 197403 (2007).[23] J. Kono and N. Miura, High Magnetic Fields: Science andTechnology (World Scientific, Singapore, 2006), Vol. III.[24] R. Valdés Aguilar et al., Phys. Rev. Lett. 108, 087403(2012).[25] G. S. Jenkins, D. C. Schmadel, A. B. Sushkov, H. D. Drew,M. Bichler, G. Koblmueller, M. Brahlek, N. Bansal, andS. Oh, Phys. Rev. B 87, 155126 (2013).[26] H. Lee, C. Xu, S. Shubeita, M. Brahlek, N. Koirala, S. Oh,and T. Gustafsson, Thin Solid Films 556, 322 (2014).217602-5
PRL 115, 217602 (2015)PHYSICAL REVIEW LETTERS[27] L. Wu, M. Brahlek, R. V. Aguilar, A. V. Stier, C. M. Morris,Y. Lubashevsky, L. S. Bilbro, N. Bansal, S. Oh, and N. P.Armitage, Nat. Phys. 9, 410 (2013).[28] C. Morris, R. Valdés Aguilar, A. Stier, and N. Armitage,Opt. Express 20, 12303 (2012).[29] The transmission can be analyzed according to the thin filmtransmission equation for each polarization handednessseparately. t is the transmission for right- or left-handcircularly polarized light. t ¼ tvs eiϕs tsfv is the transmission for right- or left-hand circularly polarized light,where tvs is the transmission from vacuum to substrate tvs ¼2 ð1 þ ns Þ and tsfv is the transmission from the substratethough film and then to vacuum tsfv ¼ 2ns ð1 þ ns þ Z0 G Þ. eiϕs is the phase accumulation insidethe substrate [48].[30] Y. Xia et al., Nat. Phys. 5, 398 (2009).[31] N. Bansal, Y. S. Kim, M. Brahlek, E. Edrey, and S. Oh,Phys. Rev. Lett. 109, 116804 (2012).[32] H. Hohler, Phys. Status Solidi (b) 58, 91 (1973).[33] M. Bianchi, D. Guan, S. Bao, J. Mi, B. B. Iversen, P. D. C.King, and P. Hofmann, Nat. Commun. 1, 128 (2010).[34] In principle, the Zeeman effect and orbital effect shouldincrease the scattering rate as well. Nevertheless, the Zeeman effect should be much smaller than a 50% increase atlow field. Orbital effects will lead to magneto-oscillations oftransport lifetime (inverse scattering rate) above 3 T whenωc τ 1. (See Supplemental Material Sec. III for a detailedcalculation.)[35] M. Orlita, C. Faugeras, G. Martinez, S. A. Studenikin, andP. J. Poole, Europhys. Lett. 92, 37002 (2010).[36] M. Orlita, L. Z. Tan, M. Potemski, M. Sprinkle, C. Berger,W. A. de Heer, S. G. Louie, and G. Martinez, Phys. Rev.Lett. 108, 247401 (2012).[37] J. W. Allen and J. C. Mikkelsen, Phys. Rev. B 15, 2952(1977).week ending20 NOVEMBER 2015[38] Γ D ðωÞ includes the renormalization effects of the lifetimeas well as the mass. Γ D ðωÞ ¼ f½ΓD ðωÞ ½m RN ðωÞ mb g ¼ω½ReðGD Þ ImðGD Þ , which tells us the frequencydependent scattering rate. Note that Γ D ðωÞ does not dependon the plasma frequency.[39] J. A. Sobota, S.-L. Yang, D. Leuenberger, A. F. Kemper, J.G. Analytis, I. R. Fisher, P. S. Kirchmann, T. P. Devereaux,and Z.-X. Shen, Phys. Rev. Lett. 113, 157401 (2014).[40] X. Zhu, L. Santos, R. Sankar, S. Chikara, C. Howard, F. C.Chou, C. Chamon, and M. El-Batanouny, Phys. Rev. Lett.107, 186102 (2011).[41] D. Kim, Q. Li, P. Syers, N. P. Butch, J. Paglione, S. D.Sarma, and M. S. Fuhrer, Phys. Rev. Lett. 109, 166801(2012).[42] S. Giraud, A. Kundu, and R. Egger, Phys. Rev. B 85,035441 (2012).[43] Reference [40] reported the surface β phonon has afrequency of 1.8 THz and the surface spring constant is75% of the bulk value. Therefore, the surface β phononcould be a softening bulk A1g Raman active phonon(2.23 THz bulk value). The surface β phonon shows aKohn anomaly at 2kf with 0.75 THz phonon frequency.[44] Xuetao Zhu, L. Santos, C. Howard, R. Sankar, F. C. Chou,C. Chamon, and M. El-Batanouny, Phys. Rev. Lett. 108,185501 (2012).[45] R. C. Hatch, M. Bianchi, D. Guan, S. Bao, J. Mi, B. B.Iversen, L. Nilsson, L. Hornekær, and P. Hofmann, Phys.Rev. B 83, 241303 (2011).[46] Z.-H. Pan, A. V. Fedorov, D. Gardner, Y. S. Lee, S. Chu, andT. Valla, Phys. Rev. Lett. 108, 187001 (2012).[47] T. Kondo et al., Phys. Rev. Lett. 110, 217601 (2013).[48] J. N. Hancock, J. L. M. van Mechelen, A. B. Kuzmenko, D.van der Marel, C. Brüne, E. G. Novik, G. V. Astakhov, H.Buhmann, and L. W. Molenkamp, Phys. Rev. Lett. 107,136803 (2011).217602-6
data by a Drude-Lorentz model accounting for the field dependence of the Drude term and constraining the parameters of the phonon and ϵ by the values extracted from the zero-field conductance fits. The conductance in a magnetic field can be described by the expression 25 20 15 10 5 Real conductance G 0 1 (10-3 1/) 0.5 1.0 1.5 2.0 Frequency .