Transcription
Magellan Financial Group Limited Full Year ResultsFor the year ended 30 June 2021
IntroductionFinancial Year Highlights1 Average funds under management up 9% to 103.7 billion Management and services fees revenue up 7% to 635.4 million Profit before tax and performance fees of the Funds Management business up 10% to 526.6 million Statutory net profit after tax down 33% to 265.2 million Adjusted net profit after tax and before associates increased by 4% to 454.5 million Including associates, adjusted net profit after tax decreased 6% to 412.7 million Total dividend for the year down 2% to 211.2 cents per share, 75% frankedKirsten Morton, CFO: FY21 Financial ResultsBrett Cairns, CEO: Business OverviewHamish Douglass, Chairman & CIO: Global Equity StrategyQ&A: Hamish Douglass, Brett Cairns & Kirsten Morton1Percentage changes are relative to 12 month period ended 30 June 2020.Magellan 2
FY21 Financial ResultsKirsten Morton, Chief Financial OfficerMagellan 3
Magellan Financial Group Full Year Results million30 June 202130 June 2020% changeAdjusted expenses111.3119.8(7%)Adjusted net profit before tax587.7573.23%Adjusted net profit after tax and before associates454.4438.34%Share of after tax profit/(loss) of associatesAdjusted net profit after tax(41.8)412.7438.3n/m(6%)Transaction costs related to strategic initiatives (after tax)Amortisation expense of intangible assetsNet unrealised change in fair value of financial assets and liabilities (after tax)Net profit after )1,476%(33%)Key statisticsDiluted EPS (cents per share)Adjusted diluted EPS (cents per share)Interim and final dividend (cents per share)Annual performance fee dividend (cents per share)Total dividend (cents per 5184.530.4214.975%(34%)(7%)8%(62%)(2%)Management and services feesPerformance feesOther revenue and incomeAdjusted revenue and other incomeAdjusted financial measures are adjusted for non-cash items (amortisation expense and unrealised gains/losses) and transaction costs related to strategic (63%)65%1%Magellan 4
Tax and Dividends Effective tax rate for the 12 months to 30 June 2021 is 21.4% (Offshore Banking Unit) Dividends:– 6 month dividend of 114.1 cents per share (75% franked at tax rate of 30%) comprising:o Final Dividend of 102.6 cents per share (91.6 cents per share for six months to 30 June 2020)o Performance Fee Dividend of 11.5 cents per share (30.4 cents per share for six months to 30 June2020)– Dividend policy1 :o Interim and Final dividends based on 90%-95% of profit of Funds Management business excludingcrystallised performance feeso Annual Performance Fee Dividend of 90%-95% of net crystallised performance fees after tax Implementing a Dividend Reinvestment Plan (DRP)o Provides Magellan with additional funding flexibilityo Allows shareholders to reinvest at a 1.5% discount with no brokerage chargeso Elections to participate need to be made by 7 September 2021 for the upcoming dividend1. Subject to corporate, legal and regulatory considerations.Magellan 5
Expenses Costs associated with strategic initiatives considered as outside day-to-day operating expenses– Excluded from Funds Management business– Excluded from dividend payout Cost to income ratio (excluding performance fees) of 16.9% during the period– Key driver of profit is not expense movements, but FUM movements Expect Funds Management business expenses in 2022 financial year to be in the range of 125- 130 millionMagellan 6
Business Overview1. Funds Management Business2. Business Resilience and Diversification UpdateBrett Cairns, Chief Executive OfficerMagellan 7
Funds Management Business millionRevenueManagement feesPerformance feesServices feesInterest and other revenueExpensesEmployee expenseOther expenseProfit before tax1Profit before tax and before performance fees30 June 202130 June 2020% 116.8558.0477.0(5%)(15%)(8%)(0%)10%Key StatisticsAverage Funds Under Management ( billion)Average AUD/USD exchange rateAvg. number of employeesEmployee expense/total expenseCost/IncomeCost/Income (excl performance fees)11Adjusts for the current period performance fee impact on revenue and expenses for the 12-month period.30 June 202130 June 2020% .2%17.3%19.7%9%11%5%Magellan 8
Investment PerformanceFor the periods to 30 June 20211 Year(%)3 Years(% p.a.)5 Years(% p.a.)SinceInception(% p.a.)1Magellan Global Fund10.813.214.411.9MSCI World NTR Index ( A)27.514.414.67.7Magellan Infrastructure Fund7.94.65.97.6Global Listed Infrastructure Benchmark ( A)217.23.34.85.1Magellan High Conviction Fund17.412.115.215.0Airlie Australian Share Fund33.712.1-13.3S&P/ASX 200 Accum. Index27.89.6-10.5Inception date for the Magellan Global Fund and Magellan Infrastructure Fund is 1 July 2007, the inception date for Magellan High Conviction Fund is 1 July 2013 and the inception date for Airlie Australian Share Fund is 1 June 2018.The Global Listed Infrastructure benchmark is comprised of the following: from inception to 31 December 2014 the benchmark is UBS Developed Infrastructure and Utilities NTR Index (AUD Hedged) and from 1 January 2015 onwards, thebenchmark is the S&P Global Infrastructure NTR Index (AUD Hedged).Calculations are based on exit price with distributions reinvested, after ongoing fees and expenses but excluding individual tax, member fees and entry fees (if applicable). Source: MSCI, UBS, S&P, Bloomberg, Magellan Asset Management Limited.12Magellan 9
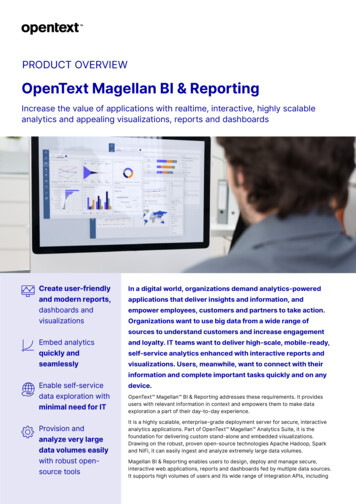
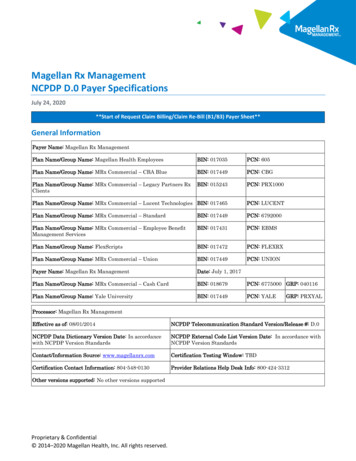
FY21 Net FlowsRetail Net Inflows13,000 2,843m 2,591m2,500 Millions MillionsInstitutional Net Inflows3,5003,000 2,887m2,5002,000 0FY21Total net inflows for the 12 months ended 30 June 2021: 4.5 billion1Includes proceeds of the Magellan High Conviction Trust IPO in October 2019 and the Magellan Global Fund Partnership Offer in February 2021.Magellan 10
Funds Under ManagementAs at 30 June 2021 ( billion)Strategy130 June 2020Net InflowsInvestment Performance30 June 20211Global Equities 74.3 2.8 9.3 85.4Global Listed Infrastructure 15.9 1.6 1.5 19.0Australian Equities 7.0 0.1 2.4 9.5 97.2 4.5 13.2 113.9Reflects 1.0 billion of net distributions paid by funds issued by Magellan. May not add due to rounding.Magellan 11
Business Overview1. Funds Management Business2. Business Resilience and Diversification UpdateBrett Cairns, Chief Executive OfficerMagellan 12
Restructure of Global Equities Retail Funds Restructure of three Global Equities retail funds into a single trust (Magellan Global Fund) completed inDecember 2020 Magellan Global Fund now has two unit classes:– Closed Class Units quoted on ASX under the ASX Listing Rules (ASX: MGF)– Open Class Units quoted on ASX under the AQUA Rules and off market access (ASX: MGOC / APIR:MGE0001AU) Simplifies investment proposition whilst allowing investors greater flexibility to access Magellan’s flagshipinvestment strategy Potential for more efficient secondary trading in Closed Class Units Extension of progress Magellan has made to provide retail investors greater access and choice in how to investwith reduced frictionMagellan 13
Restructure Partnership Benefits Magellan was pleased to raise 780 million as part of the Magellan Global Fund Partnership Offer completed inMarch 2021Investors who participated in the Partnership Offer received valuable partnership benefits:– Additional Closed Class Units worth 7.5% of subscription value in partnership with Magellan; and– One MGF Option for each Closed Class Unit issuedSeparately, under the Bonus MGF Option Issue all Closed Class unitholders were issued bonus MGF Options ona 1-for-2 pro rata basisAll partnership benefits and restructure costs funded by Magellan, not Magellan Global Fund or its unitholdersFor the year ended 30 June 2021, expense of 148 million (after-tax) comprising 38 million associated withthe additional Closed Class Units and 110 million associated with the MGF Options– Accounting standards require the options exercise price discount to be expensed upfront– Over time, the liability will now move in line with changes to the unit price and when the MGF Options areexercised or ultimately expireAt current unit prices, if all MGF Options are exercised, represents an additional 2.1 billion in FUMMagellan to fund partnership benefits via existing financial resources and a corporate debt facilityMagellan 14
Recent Fund InitiativesMFG Core Series MFG Core International Fund (CXA: MCSG / APIR: MGE3851AU) MFG Core ESG Fund (CXA: MCSE / APIR: MGE8722AU) MFG Core Infrastructure Fund (CXA: MCSI / APIR: MGE9182AU)now available to retail investors through the Chi-X securities exchange ordirect applicationMagellanSustainableFund Magellan Sustainable Fund (CXA: MSUF / APIR: MGE4669AU) nowavailable to retail investors through the Chi-X securities exchange or directapplicationMagellanFuturePay Launch of Magellan FuturePay (CXA: FPAY / APIR: MGE9989AU) in June2021. Available to retail investors through the Chi-X securities exchange ordirect applicationMagellan 15
Magellan FuturePay The goal: To develop a single product that captures important portfolio and structural risk managementtechniques and balances the competing objectives of investing for income and growth effectively andefficiently Magellan solution: FuturePay is an actively managed fund that aims to deliver:A predictable monthly incomethat grows with inflationDriven by returns and capitalgrowth, with a focus ondownside protectionUnderpinned by a reservingstrategy and income supportTogether with daily access toyour capitalIndependent review: Rice Warner’s Review of Retirement Solutions1“Investing in FuturePay provides considerable uplifts on both income and accessible capital through retirement.”Quote from Rice Warner, Review of Retirement Solutions, 5 May 2021 (Section 1.5, page 5 of 118). This Report is an independent assessment focused on quantifying the outcomes for retirement investorsusing Magellan FuturePay as a component of their retirement strategies. The Report outlines the modelling assumptions and assessment framework used in their analysis.1Magellan FuturePay 16
Principal Investments updatePrincipal Investments has now been split into two business segments:– Fund Investments: investments in our funds that provide alignment with our clients andallow for seeding of new strategies– Magellan Capital Partners: strategic investments outside Magellan’s funds managementbusiness that meet stringent criteriaMagellan 17
Fund InvestmentsThe Board has set a pre-tax hurdle of 10% p.a. (over business cycle)for the Fund Investments portfolioFund Investment portfolio:Investment ( million)Investment Returns:30 June 202130 June 31.2)Net Fund Investments407.5373.7Net Fund Investments per share (cents)4221.7205.0Internal investmentsCashInvestments in:Magellan Funds1Net seed portfoliosOther2TotalNet deferredtax3Time PeriodReturn1 Year to 30 June 202112.9%3 Years to 30 June 2021 p.a.12.6%5 Years to 30 June 2021 p.a.13.9%Since Inception to 30 June 2021 p.a.511.5%1. Investments are set out in note 8 of the interim financial statements; 2. Comprises receivables and payables; 3. Arises from changes in the fair value of financial assets offset by the deferred tax asset relating to unused tax losses;4. Based on 183,793,753 ordinary shares on issue at 30 June 2021 (30 June 2020: 182,280,222 ordinary shares). 5. Return excludes previous investment in MFF Capital Investments Limited. Inception date of 1 July 2007.Magellan 18
Magellan Capital PartnersInvestments Criteria1High quality management teams No operational involvement by Magellan, oversight typically via non-executive director representation No distraction from our Funds Management business2High quality companies with meaningful scale in their sector3Contributes to the intellectual capital of the business and provides meaningful optionality4Attractive financial returnsMagellan 19
MagellaninvestmentBusiness update 156 million investment for 40% non-dilutive economic stake (5% voting) Strong start as a new firm, with 250 high quality team employed Established many of the key systems and processes required Corporate Finance and Cash Equities have commenced client servicingactivities and have already worked on an array of M&A and capital marketstransactions Recently commenced publishing company research and is expected to becovering more than 80 ASX listed entities by the end of the year Partnership with Barclays proving very beneficial for Barrenjoey’s clients Overall, the business is developing ahead of expectationsMagellan 20
Magellaninvestment 20 million investment for 15% (fully diluted) shareholding Relationship to explore initiatives to improve access and reduce friction forinvestorsBusiness update Continued to grow the business, bringing on-board a number of establishedclients such as Praemium, Superhero and Stake In early July 2021, FinClear completed the acquisition of Pershing SecuritiesAustralia which is expected to bring significantly greater operating scaleand allow FinClear to expand its service offering to large stockbroker clients The listed securities hosted on FinClear’s HIN platform have increased from 7 billion to 130 billion, on a combined basis, and FinClear will nowservice around 250 wholesale intermediary clients and over 300,000 activeend client accountsMagellan 21
MagellaninvestmentBusiness update 103 million investment for 12% (fully diluted) shareholding GYG had a strong year, exceeding its budgeted earnings by almost 50%,despite difficult trading conditions COVID-19 conditions have broadly benefited the business, particularly in itsconvenience focussed drive-thru restaurants Achieved new restaurant opening target for the year and now has 157corporate-owned and franchised restaurantsMagellan 22
Global Equity StrategyHamish Douglass, Chairman & CIOMagellan 23
Global Equity Strategy ObjectivesMinimise the risk of permanent capital loss(Downside protection)Achieve attractive risk adjusted returnsover the medium to long-term(Retail: 9% p.a. net of fees long term target)(Institutional: 10% p.a. long term target)Magellan 24
Downside ProtectionGlobal equity composite, periods ended 30 June 2021Quarterly Excess ReturnsUpside Capture1.2# ofmarketsAverageLargestLargestUnderperformance OutperformanceAll Markets561.0%-10.5%15.0%Down Markets154.2%-2.8%15.0%Index Return -5%106.4%N/A15.0%Index Return -5% to 0%5-0.3%-2.8%1.2%0.4Up Markets41-0.2%-10.5%4.4%0.2Index Return 0 % to 5%220.5%-4.3%4.2%Index Return 5%19-0.9%-10.5%4.4%Downside Capture10.80.603 Years5 Years7 Years10 YearsSince InceptionSince inception the strategy has captured approx. 100% of up markets and 50% of down marketsSource: Bloomberg, Magellan Asset Management Limited. The numerical information above is based on the Global Equity Composite which represents the investment strategy. Excess return data is shown in USD, after feescharged to institutional clients and have been reduced by the amount of the highest fee charged to any institutional client employing that strategy during the period under consideration. Actual fees may vary depending on,among other things, the applicable fee schedule and portfolio size. The market capture information is calculated before fees charged to institutional clients, in USD relative to the MSCI World Net TR Index using 3 month returns,rolled monthly. Inception date 1 July 2007. Downside capture shows if a strategy has outperformed a benchmark during periods of market weakness, and if so, by how much. Upside capture shows if a strategy has outperformeda benchmark during periods of market strength, and if so, by how much This information is in addition to the GIPS Composite Report, found in the appendix of this presentation.Magellan 25
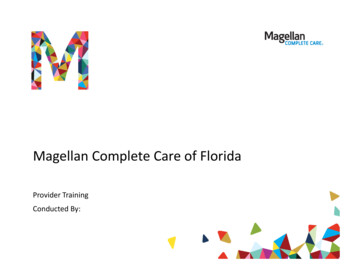
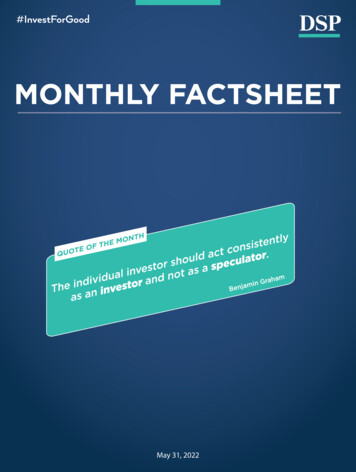
Consistent Outperformance 9% per annumRetail strategy – Magellan Global Fund 60,000Growth of 10,000 Since Inception#9% Absolute Return TargetMagellan Global Fund 40,000 48,34311.9% p.a.MSCI World Net Total Return Index 33,4219.0% p.a. 28,1657.7% p.a. 20,000 0Retail strategy outperformed 9% pa objective by 2.9% per annum net of feesData as at 30 June 2021. Returns are for the Magellan Global Fund (Open Class) (Managed Fund) calculated based on exit prices with distributions reinvested, after ongoing fees and expenses but excludingindividual tax, member fees and entry fees (if applicable) and denoted in AUD. #The inception date of the is 1 July 2007.Magellan 26
Consistent Outperformance – Global Equity StrategyBefore Fees1USDAfter max InstitutionalFees (@ 0.80% p.a.) –USD2After retail feesAUD313313313397 73%89 67%107 80%Average return (p.a.)14.4%13.5%14.4%Average excess return vs 10% p.a. (9% p.a. for retail)4.4%3.5%5.4%133 100%130 98%117 88%Average excess return (p.a.)6.1%5.2%4.2%Average relative return of underperforming observations (p.a.)n/a-0.5%-0.4%3 Year Rolling Returns since inception*Monthly ObservationsTotal Returns [Return v Objective]Observations 10% p.a. (9% p.a. for retail) Frequency %Relative Returns [Return v Benchmark]Monthly observations MSCI World Frequency %*3-year returns are calculated and rolled monthly, with the outperformance frequency indicating the percentage of positive excess returns since inception.1 Returns are for the Global Equity Composite which represents the investment strategy and denoted in USD. Performance would vary if returns were denominated in a currency other than USD. The inception date is 1 July 2007 (inclusive).2 After fee returns have been reduced by the amount of the highest fee charged to any institutional client employing that strategy during the period under consideration. Actual fees may vary depending on, among other things,the applicable fee schedule and portfolio size. Fees are available upon request.3 Returns are for the Magellan Global Fund calculated based on exit prices with distributions reinvested, after ongoing fees and expenses but excluding individual tax, member fees and entry fees (if applicable) and denoted in AUD.Magellan 27
Q&AHamish Douglass, Chairman & CIOBrett Cairns, Chief Executive OfficerKirsten Morton, Chief Financial OfficerMagellan 28
Important InformationThis presentation has been prepared by Magellan Financial Group Limited ACN 108 437 592 (‘Magellan’).This presentation contains summary information about Magellan and its related bodies corporate and is current as at 17 August 2021. While the information in this presentation has been prepared ingood faith and with reasonable care, no representation or warranty, express or implied, is made as to the accuracy, adequacy or reliability of any statements, estimates, opinions or other informationcontained in the presentation, any of which may change without notice. This includes, without limitation, any historical financial information and any estimates and projections and other financialinformation derived from them.This presentation may contain forward-looking statements. These forward-looking statements have been made based upon Magellan’s expectations and beliefs concerning future developments andtheir potential effect upon Magellan (and its controlled entities) and are subject to risks and uncertainty which are, in many instances, beyond Magellan’s control. No assurance is given that futuredevelopments or proposed strategic initiatives will materialise or be in accordance with Magellan’s expectations. Actual outcomes could differ materially from those expected by Magellan and Magellanassumes no obligation to update any forward-looking statements or information.To the maximum extent permitted by law, Magellan (including its directors, officers, employees, agents, associates, affiliates and advisers) disclaim and exclude all liability for any loss or damagesuffered or incurred by any person as a result of their reliance on the information contained in this presentation or any errors in or omissions from this presentation. To the maximum extent permittedby law, no party nor any other person accepts any other liability, including without limitation, any liability arising from fault, negligence or lack of care, for any loss or damage arising from the use of thispresentation or its contents or otherwise in connection with it.The information in this presentation does not constitute financial product advice (nor investment, tax, accounting or legal advice) and does not take account of your individual investment objectives,including the merits and risks involved in an investment in shares or units in any entity or trust or your financial situation, taxation position or particular needs. You must not act on the basis of anymatter contained in this presentation, but must make your own independent assessment, investigations and analysis of Magellan and obtain any professional advice you require, including financial,legal and taxation advice appropriate to your jurisdiction, before making an investment decision based on your investment objectives.This presentation does not constitute an offer to sell or a solicitation of an offer to purchase any security or financial product or service and does not and will not form any part of any contract orcommitment for the acquisition of any securities, financial products or services. This presentation is not a prospectus, disclosure document, product disclosure statement or other offering documentunder Australian law or the law of any other jurisdiction and does not contain all of the information which would be required in such a document.Units in the fund(s) referred to in this presentation are issued by Magellan Asset Management Limited (ABN 31 120 593 946, AFS Licence No 304 301). The Product Disclosure Statement applicable to thefund(s) is available at www.magellangroup.com.au or can be obtained by calling 61 2 9235 4888.Past performance is not necessarily indicative of future results and no person guarantees the performance of any security, financial product or service or the amount or timing of any return from it.There can be no assurance that the financial product or service will achieve any targeted returns, that asset allocations will be met or that the financial product or service will be able to implement itsinvestment strategy and investment approach or achieve its investment objective.The information contained in this Presentation must not be reproduced, used or disclosed, in whole or in part, without the prior written consent of Magellan 2021 Magellan. All Rights reserved. MAGELLAN and the Magellan logo are registered trademarks of Magellan Asset Management Limited.Magellan 29
GIPS Composite Report as at 30 June 2021Global EquityBenchmark:MSCI World Net Total Return IndexReport Currency:USDMeasurement Period:01/07/2007 to 30/06/20212021Rolling 3 Year Standard Deviation(% p.a.)Returns nchmarkInternalDispersion(%)Number ofPortfoliosCompositeAssets( M)TotalFirm Assets( 11.8710.98-5.5415.8620.15na 69532,847201018.3317.3811.7619.5123.72na 64432,063200939.3738.2629.99na 61525382008-21.64-22.27-40.71na 6252370.01-0.39-0.12na 6233252007*Composite(Net)** Part year return and internal dispersion. Composite inception date 01 July 2007.Compliance ClaimMagellan Asset Management Limited, doing business as MFG Asset Management in jurisdictions outside Australia and New Zealand, (MFG Asset Management) claims compliance with the Global Investment Performance Standards (GIPS ) and has prepared and presented this report in compliance with the GIPSstandards. MFG Asset Management has been independently verified for the periods 19 December 2006 to 31 December 2020. The verification report is available upon request. A firm that claims compliance with the GIPS standards must establish policies and procedures for complying with all the applicablerequirements of the GIPS standards. Verification provides assurance on whether the firm's policies and procedures related to composite and pooled fund maintenance, as well as the calculation, presentation, and distribution of performance, have been designed in compliance with the GIPS standards and havebeen implemented on a firm-wide basis. Verification does not provide assurance on the accuracy of any specific performance report.Definition of the FirmFor the purpose of complying with GIPS, the Firm is defined as all portfolios managed by Magellan Asset Management Limited (MFG Asset Management), excluding portfolios managed by brands operating as distinct business entities. MFG Asset Management is a wholly-owned subsidiary of the publicly listedcompany Magellan Financial Group Limited. MFG Asset Management is based in Sydney, Australia. Total Firm assets is defined as all portfolios managed by MFG Asset Management, excluding assets managed by brands operating as distinct business entities.Composite DescriptionThe Global Equity composite is a concentrated global equity strategy investing in high quality companies (typically 20-40 stocks). High quality companies are those companies that have sustainable competitive advantages which translate into returns on capital materially in excess of their cost of capital for asustained period of time. The investment objectives of the Global Equity strategy are to earn superior risk adjusted returns through the business cycle whilst minimising the risk of a permanent capital loss. The composite was created in December 2011.Benchmark DescriptionThe MSCI World Index (Net) is a free-float adjusted market capitalization weighted index that is designed to measure the equity performance of 24 developed markets. Index results assume the reinvestment of all distributions of capital gain and net investment income using a tax rate applicable to non-residentinstitutional investors who do not benefit from double taxation treaties.FeesThe fee schedule for a separately managed account is as follows: first 200million 0.60%, above 200million 0.50% A performance fee structure is available upon request.GeneralTo achieve investment objectives, the composite may also use derivative financial instruments including, but not limited to, options, swaps, futures and forwards. Derivatives are subject to the risk of changes in the market price of the underlying securities instruments, and the risk of the loss due to changes ininterest rates. The use of certain derivatives may have a leveraging effect, which may increase the volatility of the composite and may reduce its returns. Gross returns are before management and all other fees, where applicable, but after trading expenses. Returns are net of non-reclaimable withholding taxeson dividends, interest income and capital gains. Net composite returns are prepared by subtracting from the monthly gross returns one-twelfth of the maximum fee applicable to institutional investors (0.80% p.a.). The firm's list of composite descriptions is available upon request. The firm's list of broaddistribution pooled funds is available upon request. Policies for valuing investments, calculating performance, and preparing GIPS Reports are available upon request. Internal Dispersion is equally weighted and is the standard deviation of the 1 year gross returns of the accounts within the composite. If anaccount has not been part of the composite for the entire year, the account is excluded from the calculation. Dispersion is not calculated for the composites in which there are five or fewer portfolios. There are no known material differences in exchange rates or valuations sources used among the portfolioswithin the composite and between the benchmark and the composite. The 3 year annualized standard deviation of the composite are calculated using gross-of fees returns. If the 3 year annualised standard deviation is not presented, 3 years of monthly and composite and benchmark returns are not yetavailable.GIPS is a registered trademark of CFA Institute. CFA Institute does not endorse or promote this organization, nor does it warrant the accuracy or quality of the content contained herein.Magellan 30
www.magellangroup.com.auPhone: 61 2 9235 4888
Profit before tax and performance fees of the Funds Management business up 10% to 526.6 million . - Closed Class Units quoted on ASX under the ASX Listing Rules (ASX: MGF) . 1 Quote from Rice Warner, Review of Retirement Solutions, 5 May 2021 (Section 1.5, page 5 of 118). This Report is an independen t assessment focused on .