Transcription
JRB STABLE VALUE INTEREST FUNDFOURTH QUARTER 2021 PORTFOLIO REVIEW
STABLE VALUE PORTFOLIO REVIEW - JRB STABLE VALUE INTEREST FUNDFourth Quarter 2021TABLE OF CONTENTSStable Value Portfolio Review - JRB Stable Value Interest Fund . 3Investment Performance . 4Portfolio Characteristics. 5Transactions . 10Portfolio Review - JRB Stable Value Interest Fund Short/Intermediate Portfolio . 11Investment Performance & Portfolio Characteristics . 12Transactions . 14GALLIARD CONTACTSClient Relationship TeamJaime MorganSenior d ditional Contact(s)Market Review . 61Mike NormanSenior Managing Appendix . 65Galliard Client ServiceHoldings . 20Calendar Year Performance & Guideline Compliance . tal Annual Fund Operating Expenses . 68Stable Value Audit SupportGlossary of Terms . 69Galliard Stable Value Audit TeamSVAudit@galliard.comThe information contained in this report is for informational purposes only. It is intended to provide a summary of portfolioperformance and characteristics, and an accounting based view of transactions and holdings. This is a standardized report and isnot intended to be used for compliance purposes. Individual portfolio compliance requirements may not be captured in this report.
STABLE VALUE PORTFOLIO REVIEW - JRB STABLE VALUE INTEREST FUND
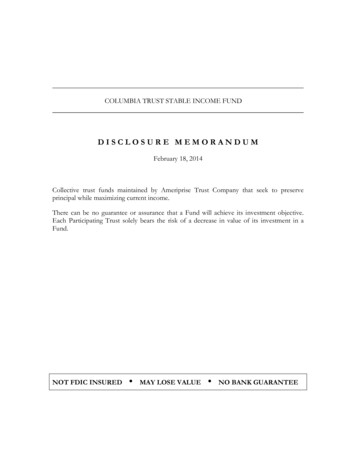
STABLE VALUE PORTFOLIO REVIEW - JRB STABLE VALUE INTEREST FUNDFourth Quarter 2021ANNUALIZED INVESTMENT PERFORMANCE AS OF 12/31/2112.52.01.51.00.50.03 MO1 YR3 YR5 YRSince Inception3 Mo.1 Yr.3 Yr.5 Yr.SinceInception3Portfolio (net of all fees - NAV level)20.391.672.132.071.923 Year Constant Maturity Treasury Yield0.200.460.941.401.12Morningstar US CIT SV Index (Hueler)40.421.742.162.141.99Value Added (net of all fees - NAV level)50.191.211.190.670.801: Returns for periods of less than one year are not annualized.2: Returns are net of all fees, including book value contract fees, Galliard investment management fees, and, if applicable, external manager fees, Wells Fargo collective fund administrative fees, and plan administrative reimbursement.3: Performance inception: June 1, 2012.4: Morningstar US CIT SV Index (Hueler) returns are before inv. Mgmt. fees. Universe consists of 16 funds for the quarter, YTD, 1,2,3 and 5 year periods and 14 funds for the 10 year period.5: May not add due to rounding.
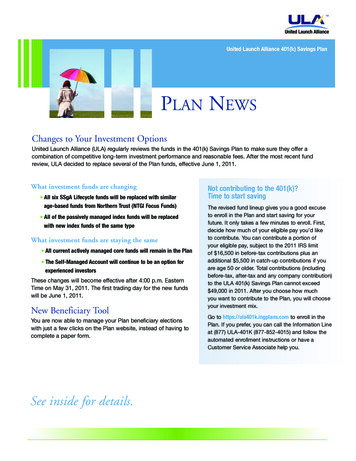
STABLE VALUE PORTFOLIO REVIEW - JRB STABLE VALUE INTEREST FUNDFourth Quarter 2021JRB STABLE VALUE INTEREST FUNDHISTORICAL FUND ASSETSACCOUNT SUMMARY 2503 Year Constant Maturity Treasury Yield 200Galliard Inception DateMay 30, 2012 150Net Asset Value 213,300,507MillionsBenchmark 100 50 4Q'12PORTFOLIO 4Q'204Q'21PORTFOLIO ge Quality - Book Value1AA-AA-Liquidity Buffer: Cash & Equivalents42.12.6Average Quality - Market Value2AAAAShort / Intermediate Portfolio97.997.4Number of Contract Issuers44100.0%5100.0%5Blended Yield (after all fees)31.59%1.53%Yield to Maturity0.95%1.31%2.91 years2.89 years102.72%101.73%Effective DurationMarket/Book Value Ratio% Portfolio % Portfolio9/30/2112/31/21Total1: Average holdings quality of the contracts and other book value assets in the portfolio. The Weighted Average Quality of the portfolio has NOT been assessed by a nationally recognized statistical rating organization. The Weighted Average Quality shownrepresents an average quality of the individual holdings' Composite Ratings, as rated by S&P, Moody's and Fitch.2: Average holdings quality of the underlying assets of the portfolio. The Weighted Average Quality of the portfolio has NOT been assessed by a nationally recognized statistical rating organization. The Weighted Average Quality shown represents an averagequality of the individual holdings' Composite Ratings, as rated by S&P, Moody's and Fitch.3: Blended Yield is net of all fees, including book value contract fees, Galliard investment management fees, and, if applicable, external manager fees, Wells Fargo collective fund administrative fees, and plan administrative reimbursement.4: Includes Receivables and Payables.5: Total % of portfolio may not add to 100% due to rounding.
STABLE VALUE PORTFOLIO REVIEW - JRB STABLE VALUE INTEREST FUNDFourth Quarter 2021HISTORICAL CASHFLOWS1 4.0 3.0 2.0 1.0 0.0- 1.0- 2.0- 3.020172018201920201Q'212Q'213Q'214Q'212021 YTDBeginning Assets 157.6 167.0 180.1 191.1 206.6 209.9 212.6 212.7 206.6Net Cash Flow ( )2 6.3 9.5 0.7 11.1 2.3 1.8- 0.7- 0.3 3.2Net Cash Flow (%)4.01%5.70%0.41%5.79%1.14%0.86%-0.34%-0.12%1.53% 3.0 3.7 4.5 4.4 0.9 0.9 0.8 0.8 3.5 167.0 180.1 191.1 206.6 209.9 212.6 212.7 213.3 213.3Estimated Investment EarningsEnding Assets31: Participant cashflows only.2: Contributions, Withdrawals and Investment Transfers3: Cashflows may not net to final assets due to rounding.
STABLE VALUE PORTFOLIO REVIEW - JRB STABLE VALUE INTEREST FUNDFourth Quarter 2021HISTORICAL MARKET VALUE TO BOOK VALUE 3MV/BV Ratio (%)Blended Yield (%)HISTORICAL BLENDED 2Q'213Q'214Q'194Q'21HISTORICAL 90.951Q'212Q'213Q'214Q'21HISTORICAL UNDERLYING YIELD TO derlying Yield to Maturity (%)5Duration (Years)101.82103.11 103.20 102.72102.4210013104.84 104.88 02Q'201: Blended Yield is net of all fees, including book value contract fees, Galliard investment management fees, and, if applicable, external manager fees, Wells Fargo collective fund administrative fees, and plan administrative reimbursement.4Q'21
STABLE VALUE PORTFOLIO REVIEW - JRB STABLE VALUE INTEREST FUNDFourth Quarter 2021CONTRACT ISSUER DISTRIBUTION & RATING SUMMARY1ContractType2% Portfolio9/30/21% Portfolio12/31/21Rating9/30/21Rating12/31/21Wrap fees (bps)12/31/21American General Life Ins. Co.SBIC24.424.3A A 15Pacific Life Ins. Co.SBIC24.324.1AA-AA-15Prudential Ins. Co. of AmericaSBIC25.525.4AA-AA-15Transamerica Life Ins. Co.SBIC23.723.6A A 151: The quality rating shown represents the individual holdings' Composite Ratings, as rated by S&P, Moody's and Fitch. Ratings shown as NR/NA are not rated or not available security ratings.2: SBIC Security Backed Investment Contract. SAGIC Separate Account GIC
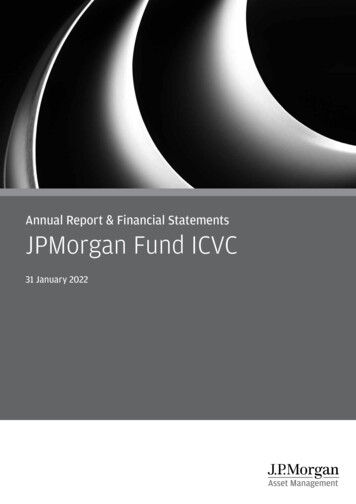
STABLE VALUE PORTFOLIO REVIEW - JRB STABLE VALUE INTEREST FUNDFourth Quarter 2021UNDERLYING FIXED INCOME ASSET ALLOCATION123.5%19.5%U.S. Portfolio 9/30/2180.0%100.0%Portfolio 12/31/21UNDERLYING DURATION DISTRIBUTION3.7%3.5%0-112.1%13.0%Asset Backed10.0%3-520.0%30.0%40.0%5 0.0%Portfolio 9/30/2119.0%20.2%42.1%39.8%1-33.7%3.7%0.0% BBB0.0%0.5%0.7%Cash & 3%29.7%Agency MBS6.9%8.5%AACorporatesTaxable Muni/Not for Profit67.7%64.1%AAA9.0%9.1%Other U.S. GovernmentNon-Agency MBSUNDERLYING QUALITY DISTRIBUTION1Portfolio 12/31/2121.8%25.6%17.1%14.4%20.0%40.0%Portfolio 9/30/2160.0%80.0%100.0%Portfolio 12/31/211: Market Value. Total % of portfolio may not add to 100% due to rounding. The external managers provide holdings and the securities are classified using Galliard's analytics methodology for comparability across managers. The quality distribution shownrepresents the distribution of the individual holdings' Composite Ratings, as rated by S&P, Moody's and Fitch. Ratings shown as NR/NA are not rated or not available security ratings. Distributions represent the portfolio positions for reporting purposes only.Investment guideline compliance is reported in the appendix or separately through your Galliard relationship manager.
JRB STABLE VALUE INTEREST FUND PORTFOLIO TRANSACTIONSPeriod: 10/1/2021 - 12/31/2021Asset IDSecurity DescriptionGalliardComposite RatingBook ValueSettle Date1,500,00012/8/2021AAAPURCHASES9983008 PWF/BlackRock Short Term Investment Fund STOTAL PURCHASESSALES946996MZ5American General Life Ins. Co.373,00012/8/2021A 694992KR8Pacific Life Ins. Co.371,00012/8/2021AA-744999YE7Prudential Ins. Co. of America392,00012/8/2021AA-600996TW2Transamerica Life Ins. Co.364,00012/8/2021A TOTAL SALES
PORTFOLIO REVIEW - JRB STABLE VALUE INTEREST FUND SHORT/INTERMEDIATE PORTFOLIO
FIXED INCOME PORTFOLIO REVIEW - JRB STABLE VALUE INTEREST FUND SHORT/INTERMEDIATE PORTFOLIOFourth Quarter 2021ANNUALIZED INVESTMENT PERFORMANCE4PORTFOLIO CHARACTERISTICSPortfolio Benchmark112/31/2112/31/21Weighted Average Quality24.03.0AAAA1.34%1.06%Weighted Average Maturity3.54 Yrs3.12 Yrs1.0Effective Duration2.96 Yrs2.98 Yrs0.0Yield to Maturity2.0-1.0SECTOR DISTRIBUTION3Portfolio Benchmark112/31/2112/31/21U.S. Treasury20.0%-2.03 MO1 YR3 YR5 YRSince Inception64.3%3 Mo.1 Yr.3 Yr.5 Yr.SinceInception5U.S. Agency0.0%2.8%Other U.S. Government9.3%0.1%Portfolio (before fees)(0.50)(0.83)3.702.922.2430.4%26.8%Blended %Value Added (before fees)60.060.130.880.780.77Non-Agency MBS0.7%0.0%CMBS3.6%0.0%13.3%0.0%Sovereign / Supranationals0.0%5.3%Cash & Equivalents1.2%0.0%100.0%6100.0%6CorporatesTaxable Muni/Not for ProfitAgency MBSAsset BackedTotal1: Blended benchmark: 50% Bloomberg U.S. Intermediate Government/Credit, 50% Bloomberg U.S. 1-3 Year Government/Credit. Prior to7/1/2019 was the Bloomberg Barclays U.S. 1-5 Year Government Bond Index. From 6/1/12 - 6/30/2019, the account was managed to atarget duration of 3 years rather than an active fixed income benchmark. Benchmark performance for this period is shown for comparativepurposes only.2: The Weighted Average Quality of the portfolio has NOT been assessed by a nationally recognized statistical rating organization. TheWeighted Average Quality shown represents an average quality of the individual holdings' Composite Ratings, as rated by S&P, Moody'sand Fitch.3: Market value. Total % of portfolio may not add due to rounding.4: Returns for periods of less than one year are not annualized.5: Performance inception: Jun 1, 2012.6: May not add due to rounding.
FIXED INCOME PORTFOLIO REVIEW - JRB STABLE VALUE INTEREST FUND SHORT/INTERMEDIATE PORTFOLIOFourth Quarter 2021QUALITY DISTRIBUTION1AAAAAABBB %0.0%0.0%100.0%3AAAAAABBB BBB0%20%40%Portfolio60%80%100%Benchmark2DURATION DISTRIBUTION0-1 Years1-3 Years3-5 Years5-10 Years10 00.0%30-1 Years1-3 Years3-5 Years5-10 Years10 Years0%40%PortfolioMATURITY DISTRIBUTION0-1 Years1-3 Years3-5 Years5-10 Years10 0%100.0%360%80%100%Benchmark20-1 Years1-3 Years3-5 Years5-10 Years10 Years0%20%Portfolio40%60%80%Benchmark21: The quality distribution shown represents the distribution of the individual holdings' Composite Ratings, as rated by S&P, Moody's and Fitch. Ratings shown as NR/NA are not rated or not available security ratings.2: 50% Bloomberg U.S. Intermediate Government/Credit, 50% Bloomberg U.S. 1-3 Year Government/Credit.3: Column percentage may not add exactly due to rounding.100%
JRB STABLE VALUE INTEREST FUND SHORT/INTERMEDIATE PORTFOLIO PORTFOLIO TRANSACTIONSPeriod: 10/1/2021 - 12/31/2021CUSIPMATURITIESParAmountSecurity DescriptionPriceTradeAmountAccruedIncomeTotal TradeAmountTradeDateSettleDateCORPORATES89117FJB6 Covered Toronto-Dominion Bank/The3.350% DUE 0/22/2105523RAB3 BAE Systems PLC4.750% DUE 0/11/2100287YBE8 AbbVie Inc3.375% DUE 1/14/2137045XCP9 General Motors Financial Co Inc4.200% DUE TOTAL CORPORATESTOTAL MATURITIESPURCHASES630,000ASSET BACKED662826FP6 North Texas Higher Education Authority IncFLT DUE 0/28/211.630% DUE /27/21FLT DUE 1/23/2192348KAD5 Verizon Master Trust0.990% DUE /04/2123345FAC6 DLLMT 2021-1 LLC1.000% DUE 000.00309,9863,049,78710/27/2111/03/211.650% DUE 5/21FLT DUE 2/07/2122966RAH9 CubeSmart LP2.250% DUE /2186562MCA6 Sumitomo Mitsui Financial Group Inc1.474% DUE /2110/12/2158933YBC8 Merck & Co Inc1.700% DUE /10/2158933YBD6 Merck & Co Inc1.900% DUE /10/21606822BZ6 Mitsubishi UFJ Financial Group Inc1.640% DUE 0/13/2164034YAB7 Nelnet Student Loan Trust 2021-D10620WAJ7 Brazos Education Loan AuthorityTOTAL ASSET BACKEDCORPORATES278865BL3 Ecolab Inc84859DAB3 Spire Missouri Inc
JRB STABLE VALUE INTEREST FUND SHORT/INTERMEDIATE PORTFOLIO PORTFOLIO TRANSACTIONSPeriod: 10/1/2021 - 12/31/2021CUSIPParAmountSecurity DescriptionPriceTradeAmountAccruedIncomeTotal TradeAmountTradeDateSettleDate78355HKS7 Ryder System Inc1.750% DUE /03/2195709TAP5 Evergy Kansas Central Inc3.100% DUE 110/25/21FLT DUE 111/10/21723787AT4 Pioneer Natural Resources Co1.125% DUE 11/19/21071813CF4 Baxter International Inc1.322% DUE 2/01/21666807BM3 Northrop Grumman Corp2.930% DUE 111/02/21233853AF7 Daimler Trucks Finance North America LLC2.000% DUE /14/21FLT DUE 1/03/21025816CM9 American Express Co1.650% DUE /04/21872898AA9 TSMC Arizona Corp1.750% DUE /25/2149456BAU5 Kinder Morgan Inc1.750% DUE /09/2137045XDP8 General Motors Financial Co Inc2.400% DUE /15/21771196BW1 Roche Holdings Inc1.930% DUE 2/13/21FLT DUE 2/15/2113645RBE3 Canadian Pacific Railway Co1.750% DUE /02/2198388MAB3 Xcel Energy Inc1.750% DUE /03/2105724BAD1 BAKER HUGHES LLC/CO-OBL2.061% DUE 9/2165339KBY5 NextEra Energy Capital Holdings Inc1.875% DUE /13/2106051GKE8 Bank of America CorpFLT DUE 2/06/2114040HCK9 Capital One Financial CorpFLT DUE 2/06/21883556CS9 Thermo Fisher Scientific Inc1.215% DUE 0/22/2127409LAA1 East Ohio Gas Co/The1.300% DUE 2111/15/2125731VAA2 Dominion Energy South Carolina Inc2.300% DUE /21FLT DUE 12/06/211.625% DUE /14/2106051GGL7 Bank of America Corp172967ND9 Citigroup Inc74977RDL5 Cooperative Rabobank UA38141GYM0 Goldman Sachs Group Inc/The233853AD2 Daimler Trucks Finance North America LLC
JRB STABLE VALUE INTEREST FUND SHORT/INTERMEDIATE PORTFOLIO PORTFOLIO TRANSACTIONSPeriod: 10/1/2021 - 12/31/2021CUSIPParAmountSecurity DescriptionPriceTradeAmountAccruedIncomeTotal TradeAmountTradeDateSettleDate278865BL3 Ecolab Inc1.650% DUE /15/2142250PAD5 Healthpeak Properties Inc2.125% DUE /2105724BAD1 BAKER HUGHES LLC/CO-OBL2.061% DUE 2/09/21404280CX5 HSBC Holdings PLCFLT DUE 1/22/2138141GYM0 Goldman Sachs Group Inc/TheFLT DUE 0/21/212.000% DUE 05,025.97488,9179,584,54912/07/2112/21/21FLT DUE 111/17/213140QMQ98 Fannie Mae Pool2.000% DUE 112/13/213133AYJB7 Freddie Mac Pool2.000% DUE 111/26/2101F022618 Fannie Mae or Freddie Mac2.500% DUE 612/03/2101/13/2201F020612 Fannie Mae or Freddie Mac2.000% DUE 01/13/223133AWHQ0 Freddie Mac Pool2.500% DUE 110/27/213133AYJL5 Freddie Mac Pool2.000% DUE 111/26/213133AWHE7 Freddie Mac Pool2.500% DUE /2110/27/2101F022626 Fannie Mae or Freddie Mac2.500% DUE 812/09/2102/14/2201F020612 Fannie Mae or Freddie Mac2.000% DUE 082H1 San Ramon Valley Unified School District/CA1.670% DUE 1/03/21010268CR9 Alabama Federal Aid Highway Finance Authority1.856% DUE 0/14/21797272RS2 San Diego Community College District2.013% DUE 2/28/21576000ZJ5 Massachusetts School Building Authority1.753% DUE 10/07/21867578VK9 Sunnyvale School District1.824% DUE 1/17/21291011BQ6 Emerson Electric CoTOTAL CORPORATESMORTGAGE BACKED89179YAR4 Towd Point Mortgage Trust 2021-1TOTAL MORTGAGE BACKEDTAXABLE MUNI / NOT FOR PROFIT
JRB STABLE VALUE INTEREST FUND SHORT/INTERMEDIATE PORTFOLIO PORTFOLIO TRANSACTIONSPeriod: 10/1/2021 - 12/31/2021CUSIPParAmountSecurity DescriptionPriceTradeAmountAccruedIncomeTotal TradeAmountTradeDateSettleDate5917457W8 Metropolitan Atlanta Rapid Transit Authority2.111% DUE 2/16/2165887PWE1 North Dakota Public Finance Authority1.810% DUE 2/22/21034286FK5 Town of Andover MA1.873% DUE 2/16/21605581QP5 State of Mississippi1.887% DUE 2/09/21047772G44 City of Atlanta GA1.788% DUE 2/23/21250375LV2 Desert Community College District2.208% DUE 2/07/21010268CP3 Alabama Federal Aid Highway Finance Authority1.547% DUE 15,459.9127,848,175TOTAL TAXABLE MUNI / NOT FOR PROFITTOTAL PURCHASESSALES27,659,216CORPORATES14913R2Q9 Caterpillar Financial Services Corp1.150% DUE 17/21FLT DUE 110/20/21291011BP8 Emerson Electric Co0.875% DUE 2/2174153WCL1 Pricoa Global Funding I2.400% DUE 110/19/2187612EBL9 Target Corp2.250% DUE 10/18/21654106AJ2 NIKE Inc2.750% DUE /09/21654106AJ2 NIKE Inc2.750% DUE /10/21882508BK9 Texas Instruments Inc1.125% DUE 10/19/21606822BA1 Mitsubishi UFJ Financial Group Inc3.761% DUE 110/07/21025816BS7 American Express Co3.400% DUE /2112/14/2186562MBF6 Sumitomo Mitsui Financial Group Inc3.936% DUE /2110/07/21278865BL3 Ecolab Inc1.650% DUE 7/21808513BB0 Charles Schwab Corp/The4.200% DUE /28/2138141GWN0 Goldman Sachs Group Inc/The
JRB STABLE VALUE INTEREST FUND SHORT/INTERMEDIATE PORTFOLIO PORTFOLIO TRANSACTIONSPeriod: 10/1/2021 - 12/31/2021CUSIPParAmountSecurity Description14913R2Q9 Caterpillar Financial Services CorpPriceTradeAmountAccruedIncomeTotal TradeAmountTradeDateSettleDate1.150% DUE 618 Fannie Mae or Freddie Mac2.500% DUE 212/09/2101/13/2201F0206C8 Fannie Mae or Freddie Mac2.000% DUE 12/13/2101F020612 Fannie Mae or Freddie Mac2.000% DUE 01/13/2201F0206C8 Fannie Mae or Freddie Mac2.000% DUE 12/13/2101F020612 Fannie Mae or Freddie Mac2.000% DUE 01/13/2201F0226C4 Fannie Mae or Freddie Mac2.500% DUE 2191282CAC5 United States Treasury Note/Bond0.125% DUE 111/19/2191282CBT7 United States Treasury Note/Bond0.750% DUE /01/2111/02/21912828Z94 United States Treasury Note/Bond1.500% DUE /2112/13/21912828Z78 United States Treasury Note/Bond1.500% DUE 912/09/2112/10/21912828Z78 United States Treasury Note/Bond1.500% DUE 6612/08/2112/09/2191282CAV3 United States Treasury Note/Bond0.875% DUE 2110/25/21912828Z94 United States Treasury Note/Bond1.500% DUE /2112/14/2191282CCB5 United States Treasury Note/Bond1.625% DUE 112/08/2191282CAC5 United States Treasury Note/Bond0.125% DUE 1/19/2111/22/21912828YQ7 United States Treasury Note/Bond1.625% DUE AA1 Yale University0.873% DUE 12/07/21840658QB7 South-Western City School District2.112% DUE 112/06/21TOTAL CORPORATESMORTGAGE BACKEDTOTAL MORTGAGE BACKEDU.S. TREASURY / AGENCYTOTAL U.S. TREASURY / AGENCYTAXABLE MUNI / NOT FOR PROFIT
JRB STABLE VALUE INTEREST FUND SHORT/INTERMEDIATE PORTFOLIO PORTFOLIO TRANSACTIONSPeriod: 10/1/2021 - 12/31/2021CUSIPParAmountSecurity DescriptionPriceTradeAmountAccruedIncomeTotal TradeAmountTradeDateSettleDate649791PR5 State of New York2.260% DUE /2112/07/21977100AC0 WISCONSIN ST GEN FUND APPROP5.700% DUE 23,52150,216.5221,273,738TOTAL TAXABLE MUNI / NOT FOR PROFITTOTAL SALES20,952,000
JRB STABLE VALUE INTEREST FUND SHORT/INTERMEDIATE PORTFOLIO PORTFOLIO HOLDINGSDecember 31, 2021Par ValueCUSIPSecurity DescriptionUnitCostMarketPriceAmortizedCost ( )MarketValue ( )AccruedIncome ( )Total MarketValue ( )1YTM(%)Wtd.Avg.Life(yrs)Eff. Dur. % of(yrs) PortfolioCASH & EQUIVALENTS-4,926,2787,394,791PF9983008Receivables / (Payables)FLT AA 70.000.00-2.33Wells Fargo Short Term Investment Fund S0.069% .001.17TOTAL CASH & EQUIVALENTSU.S. GOVERNMENT2,000,00091282CAG6United States Treasury Note/Bond0.125% 08/31/2022 AA 670.670.954,000,00091282CAN1United States Treasury Note/Bond0.125% 09/30/2022 AA 0.750.751.892,125,00091282CBD2United States Treasury Note/Bond0.125% 12/31/2022 AA 1.001.004,300,00091282CCK5United States Treasury Note/Bond0.125% 06/30/2023 AA 01.502.022,150,00091282CCU3United States Treasury Note/Bond0.125% 08/31/2023 AA 671.661.016,300,00091282CAW1United States Treasury Note/Bond0.250% 11/15/2023 AA 01.871.872.962,125,00091282CBE0United States Treasury Note/Bond0.125% 01/15/2024 AA 2.042.040.992,150,00091282CBM2United States Treasury Note/Bond0.125% 02/15/2024 AA 2.132.121.002,150,00091282CCT6United States Treasury Note/Bond0.375% 08/15/2024 AA 2.622.611.006,280,000912828Z78United States Treasury Note/Bond1.500% 01/31/2027 AA .265.094.883.0230,000912828ZE3United States Treasury Note/Bond0.625% 03/31/2027 AA 11,485,00091282CBB6United States Treasury Note/Bond0.625% 12/31/2027 AA 05.890.671: Includes accrued income.
JRB STABLE VALUE INTEREST FUND SHORT/INTERMEDIATE PORTFOLIO PORTFOLIO HOLDINGSDecember 31, 2021Security AmortizedCost ( )MarketValue ( )AccruedIncome ( )Par ValueCUSIP250,000912828YS3United States Treasury Note/Bond1.750% 11/15/2029 AA United States Treasury Note/Bond1.500% 02/15/2030 AA United States Treasury Note/Bond0.625% 08/15/2030 AA /Aaa98.4993.36886,3741,774,00091282CBL4United States Treasury Note/Bond1.125% 02/15/2031 AA /Aaa96.2397.161,450,00091282CCB5United States Treasury Note/Bond1.625% 05/15/2031 AA /Aaa103.201,075,00091282CCS8United States Treasury Note/Bond1.250% 08/15/2031 AA /Aaa99.56TOTAL U.S. GOVERNMENTTotal MarketValue ( )1Eff. Dur. % of(yrs) PortfolioOTHER U.S. GOVERNMENTAgency Multi-Family1,070,000GFWD542 1FN DUS 6Y8M/6Y2M 2ND1.700% 03/01/2028 AA 6.325.930.5135,2723140JAU89Fannie Mae PoolFLT 06/01/2022 AA 199,6233138EPJX3Fannie Mae PoolFLT 11/01/2022 AA 140.09736,7473140HRTF0Fannie Mae Pool3.410% 11/01/2023 AA .340.36840,0003140HSPL9Fannie Mae Pool3.120% 01/01/2024 AA .520.41838,8493140HSUW9Fannie Mae Pool3.100% 02/01/2024 AA .580.41740,0003140HTNY1Fannie Mae Pool2.800% 04/01/2024 AA 1.760.361,000,0003140HWNH1Fannie Mae Pool2.100% 09/01/2024 AA /Aaa99.98101.96999,7961,019,5901,8081,021,3981
STABLE VALUE PORTFOLIO REVIEW - JRB STABLE VALUE INTEREST FUND Fourth Quarter 2021 1: Blended Yield is net of all fees, including book value contract fees, Galliard investment management fees, and, if applicable, external manager fees, Wells Fargo collective fund administrative fees, and plan administrative reimbursement.