Transcription
PRODUCT OVERVIEWOpenText Magellan BI & ReportingIncrease the value of applications with realtime, interactive, highly scalableanalytics and appealing visualizations, reports and dashboardsCreate user-friendlyand modern reports,dashboards andvisualizationsIn a digital world, organizations demand analytics-poweredapplications that deliver insights and information, andempower employees, customers and partners to take action.Organizations want to use big data from a wide range ofsources to understand customers and increase engagementEmbed analyticsquickly andseamlesslyand loyalty. IT teams want to deliver high-scale, mobile-ready,self-service analytics enhanced with interactive reports andvisualizations. Users, meanwhile, want to connect with theirinformation and complete important tasks quickly and on anyEnable self-servicedata exploration withminimal need for ITProvision andanalyze very largedata volumes easilywith robust opensource toolsdevice.OpenText Magellan BI & Reporting addresses these requirements. It providesusers with relevant information in context and empowers them to make dataexploration a part of their day-to-day experience.It is a highly scalable, enterprise-grade deployment server for secure, interactiveanalytics applications. Part of OpenText Magellan Analytics Suite, it is thefoundation for delivering custom stand-alone and embedded visualizations.Drawing on the robust, proven open-source technologies Apache Hadoop, Sparkand NiFi, it can easily ingest and analyze extremely large data volumes.Magellan BI & Reporting enables users to design, deploy and manage secure,interactive web applications, reports and dashboards fed by multiple data sources.It supports high volumes of users and its wide range of integration APIs, including
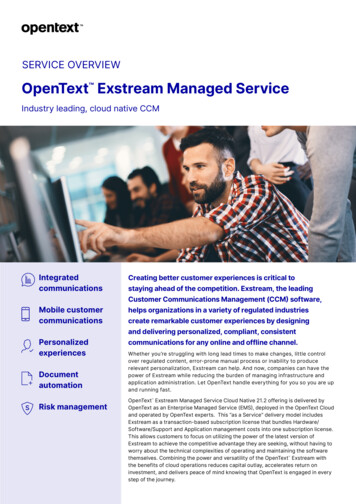
Features : Explore data using interactivefeatures, such as drill-downs,sorting, filtering and aggregating. Connect and combine multipledata sources and formats. Use a broad range of APIs, such asREST and JavaScript, to integrateanalytics into any application. Work offline in PDF or Microsoft Office formats for Microsoft Excel , Microsoft Word andMicrosoft PowerPoint . Get automated visualizationoptions for every type of user,from casual to sophisticated,based on data types.REST and JavaScript , allow for easy embedding of content into any application.Magellan BI & Reporting displays optimally on any device, intelligently resizing andrepositioning its results on both mobile and desktop screens. The solution is easy todeploy either on-premises or in the cloud.By providing all users with realtime information and self-service business analytics,Magellan BI & Reporting meets business-critical requirements. It enables moderndashboard creation and ad hoc reporting leveraging a fully “What You See IsWhat You Get” (WYSIWYG) authoring experience in a flexible, visually appealingenvironment designed to drive user autonomy. It leverages Apache NiFi tools forhigh-volume ETL capacity, with the scale required to deliver customer-facingapplications to millions of users.Magellan BI & Reporting transforms any data into meaningful insights with relevant,appealing graphics and smart visualizations, from bar or ring charts to word clouds,treemaps and histograms, so users can easily see and understand informationtrends. Businesses can embed these personalized analytic dashboards andinteractive visualizations into their own applications, workflows and processes formaximum impact. Create modern dashboardsleveraging a fully WYSIWYGauthoring experience and auto-fitcapabilities.Magellan BI & Reporting gives organizations a 360-degree view of theirperformance.Visualization options for every level of self-service accessMagellan BI & Reporting is equipped with data reporting and auto-fit displayfeatures that enable a full range of self-service capabilities for any user, regardlessof skillset.Depending on the level of interactivity and data blending needed, users can choosefrom: OpenText Magellan Interactive Viewer for built-in functions that emphasizesimplicity and ease of use. OpenText Magellan Dashboards for visual appeal to showcase key indicators. OpenText Magellan Analytics Studio for sophisticated, powerful reporting withthe ability to add new data sources on the fly.OpenText Magellan BI & Reporting2/5
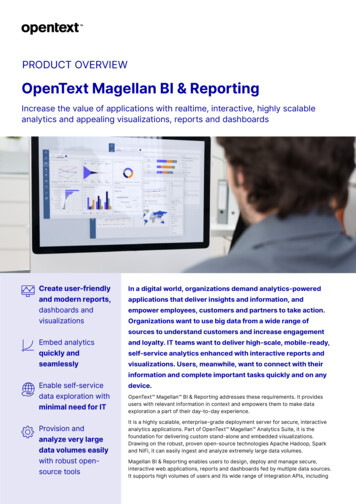
Quick, convenient data exploration with Magellan Interactive ViewerOpenText servicesavailable: OpenText Learning ServicesMagellan BI & ReportingMagellan Interactive Viewer is an easy-to-use viewing option pre-packaged withMagellan BI & Reporting. Within a few minutes of being introduced to the intuitiveinterface, even the most non-technical users can start accessing and customizingcontent based on their unique needs and preferences. Users can modify, save andshare reports, dashboards and data visualizations with just a few clicks. OpenText Managed Services OpenText Consulting Services FasTrak Implementation Servicesfor Magellan BI & ReportingUpdates at a glance with the flexible Magellan DashboardsFor a richer reporting experience, the dashboards component aggregates multipledata sources and serves up realtime results in appealing and smart graphicvisualizations. Auto-fit features make it easy to create dashboards with complexand irregular layouts, putting data at the user’s fingertips. Designed to be usedwithout training, dashboards are quick to assemble, personalize and share. Stateof-the-art charts, gadgets, tables and graphical selectors, including cross-filteringand global-scope options, allow users to illustrate and explore data without ITsupport.OpenText Magellan BI & Reporting3/5
Full-featured ad hoc reporting for business users with Magellan Analytics StudioMagellan Analytics Studio provides the most sophisticated ad hoc reporting designoptions. Drag-and-drop functionality in this integrated development environmentallows advanced users to assemble and format reports for personalized businessinsights. Users can blend, transform and apply business logic to data, add newsources on the fly and effortlessly create ad hoc reports in the browser. MagellanAnalytics Studio includes hundreds of HTML5 charts, gadgets and maps,commercial data drivers, a metadata layer and cube design, and caching featuresfor creating interactive and analytic content.Magellan BI & Reporting componentsMagellan BI & ReportingDesign, deploy and manage secure, interactive web applications, reports anddashboards fed by any data source in any format leveraging smart and auto-fitfeatures. Embed analytic content into any application and display on any device.OpenText Magellan Interactive ViewerModify, save and share reports, dashboards and data visualizations with just afew clicks. This intuitive, user-friendly viewing option is packaged with MagellanAnalytics Suite.OpenText Magellan DashboardsAggregate multiple data sources and serve up realtime results in appealing graphicvisualizations for a richer reporting experience. Users can illustrate and exploredata without IT support.OpenText Magellan Analytics StudioAssemble reports with drag-and-drop ease by using the most powerful ad hocreporting design options. Blend and explore data, add new sources on the fly andcreate personalized reports within the browser.Magellan Analytics Suite: Delivering more insight from dataMagellan BI & Reporting delivers even more value as part of the Magellan AnalyticsSuite. As an integrated whole, the suite helps organizations gain insight, improvedecision-making and boost operational efficiency by providing hands-on access tointeractive dashboards, reports and data visualizations. It is seamlessly integratedwith big data-capable advanced and predictive analytics to identify patterns andtrends.Leveraging all data, whether it comes from databases, business applications, CRMrecords, Internet of Things or social media, in relevant, interactive visualizationson any device increases opportunities for growth. Magellan Analytics Suite offersrobust, enterprise-level security, scalability to millions of users and data integrity,while requiring only minimal IT intervention.OpenText Magellan: Adding the power of AI to analyticsOpenText Magellan provides ultimate predictive and prescriptive analyticscapability and is a natural extension of Magellan Analytics Suite. It is a powerful,flexible AI and analytics platform that derives insights from both structured andunstructured data, identifying key topics, people, events, concerns and othercrucial information in text.OpenText Magellan BI & Reporting4/5
Squeeze every drop of value from dataRead the latest blogpostsKeep up to dateLearn moreMagellan BI & Reporting »Read about customer MRDM »Magellan combines cutting-edge, open source machine learning with advanced,predictive analytics, enterprise-grade business intelligence and the capacity toacquire, merge, manage and analyze big data and big content stored in EnterpriseInformation Management (EIM) systems.Magellan enables machine-assisted decision-making by automating repetitive, lowlevel processes and business optimization. As a result, organizations can streamlineoperations, respond more quickly to changing needs and operate more profitably.About OpenTextOpenText, The Information Company, enables organizations to gain insight throughmarket leading information management solutions, on-premises or in the cloud. Formore information about OpenText (NASDAQ: OTEX, TSX: OTEX) visit: opentext.com.Connect with us: OpenText CEO Mark Barrenechea’s blog Twitter LinkedInopentext.com/contactCopyright 2021 Open Text. All Rights Reserved. Trademarks owned by Open Text.For more information, visit: on 05.21 18111EN5/5
Magellan BI & Reporting OpenText Managed Services OpenText Consulting Services FasTrak Implementation Services for Magellan BI & Reporting. Quick, convenient data exploration with Magellan Interactive Viewer. Magellan Interactive Viewer is an easy-to-use viewing option pre-packaged with . Magellan BI & Reporting.