Transcription
Delaware Data: State DemographicBackgroundDelaware is the second smallest state in the United States, with total landmass equaling 1,949square miles (US Census Bureau, n.d.). There are three counties in the state: New Castle County,the most populated county, and Sussex and Kent Counties, which are primarily rural. Accordingto the most recent data available from the United States Census, the state population isestimated at 952,065. The demographic snapshot indicates that 70% of the state population isreported as White, 22% as Black or African American, 9% as Hispanic or Latino, 4% as Asian, andthe remaining population of the state identifies as Pacific Islander/Native Hawaiian, AmericanIndian/Alaska Native. From 2011-2015, 13% of Delawareans spoke a language other than Englishat home (US Census Bureau, n.d.).The median age in Delaware during the 2011-2015 timeframe analyzed by the AmericanCommunity Survey was 39.3 years. Currently, individuals aged 18 and under comprise 21.6% ofthe State’s overall population (US Census Bureau, n.d.). However, Delaware’s population ischanging in key ways. In particular, the population is aging. Since 2000, the population betweenthe ages of 60 to 84 increased by 52% and the population over the age of 85 increased by 70%.This trend is particularly pronounced in Sussex County, where the population over 85 increasedby 106% since 2000. Delawareans aged 65 and older comprise 17% of the total population(DelawareFOCUS.org, n.d.).The median household income from 2011 through 2015 was 60,509. In February 2017, theunemployment rate was 4.5% with over 21,000 people currently unemployed (US Bureau ofLabor Statistics, n.d.). In 2015, 7% of the Delaware population was uninsured. About one in five11
was enrolled in Medicaid, and one in six was enrolled in Medicare (Kaiser Foundation, n.d.). From2013 – 2015, 20% of children in the state lived below the federal poverty line. In 2015, 71,393families were enrolled in the Supplemental Nutrition Assistance Program, and 5,258 familiesreceived Temporary Assistance for Needy Families. Two in five children were raised in one-parentfamilies (Center for Community Research and Service, 2016).Due to unique tax and corporate policies and access to the Delaware Court of Chancery,Delaware has attracted more than half of all U.S. publicly traded companies to incorporate in thestate. For this reason, Delaware is often named as the “corporate capital of the world.” One ofDelaware’s major industries is corporate financing and banking. Additionally, Delaware’seconomy is also driven by chemical manufacturing, aviation, health services, tourism, andagriculture. In Kent and Sussex County, agriculture has greater predominance. The state’s largestagricultural output is broiler chickens, followed by soybeans and corn. Many thousands ofpeople, from across the country, visit Delaware’s beach resort towns every year, making tourisma great driver of economic development in Sussex County (State of Delaware Office of EconomicDevelopment, n.d.). Delaware has also become a retirement destination, which accounts, in part,for the growth in population of older citizens.New Castle CountyThe northernmost and most densely populated county, New Castle County had an estimated538,479 residents during the 2010 Census. Delaware’s largest city, Wilmington, is located in NewCastle, with an estimated 70,851 people living in the city in 2010 (US Census Bureau, n.d.). Thereis an upsurge in the number of people in the downtown business district during the day, withmuch of that population leaving the city for homes in the suburban outlying areas at night.Recent residential and business developments along the waterfront in the city were designed, inpart, to attract more working professionals to the city to live, and for dining and entertainment.Efforts to motivate locals to dine and entertain in the city are hampered by concerns over high12
crime rates. In 2014, Newsweek featured an article on the troubling homicide rate within thecity, entitled, Murder Town USA (Jones, 2014). Attention to increasing homicide rates led localresidents and policymakers to call gun violence a public health epidemic, and epidemiologistsfrom the CDC treated it as such and spent several months in 2015 identifying risk factors that leadto gun violence within the city (Sumner et al., 2015).Newark, the state’s third largest city, with 31,454 people in 2010, is also located in New CastleCounty (US Census Bureau, n.d.). Delaware’s flagship university, the University of Delaware, islocated in the city. Towns in lower New Castle County have seen explosive growth in the past twodecades. Between the 2000 and 2010 Census reporting periods, Middletown grew by 206%, andTownsend by 492%.Kent CountyDover, the capitol and the state’s second largest city, is located in Kent County. An estimated36,047 people lived in Dover in 2010 (US Census Bureau, n.d.). The city is home to the Dover AirForce Base, and the Dover Downs International Speedway. Delaware State University and WesleyCollege are based in Dover, and Delaware Technical and Community College and WilmingtonUniversity also have locations in the city. Recent residential developments have attracted morepeople to Kent County. Two towns saw large increases in populations from 2000-2010; Cheswoldincreased by 341% during this time period, and Clayton by 129%. Kent County had an overall 28%increase in population between 2000-2010, when the US Census estimated the population at162,349.Sussex CountySussex County, the southernmost of the three, is home to several beach resort towns thatsupport a large influx of people during the warmer months, but do not host a large year-round13
population. During the tourist season, tremendous congestion and traffic is evident in thesecoastal towns. Milford, Georgetown, and Seaford are the three largest cities in the county, all ofwhich are inland from the coast and have primarily year-round populations. Poultry processing isa major industry in Sussex County, and a significant immigrant worker population is associatedwith the industry. From 2000-2010, Sussex County experienced a 26% increase in its populationwhen the US Census reported 197,110 residents. These official numbers may not actually reflectlocal realities, as some of the population growth is likely due to migrant and immigrant workersthat may not be counted on the Census.Medically Underserved AreasThe Health Resources and Services Administration (HRSA) uses existing data to determine areasof the country that are medically underserved, and lack access to primary care doctors.Occasionally, areas do not fit official criteria for being medically underserved, but localstakeholders, aware of local context and realities, can petition to designate the area as medicallyunderserved if additional data shows that the population does have difficulty in accessing primarycare. This is considered the Governor’s Exception Criteria by the HRSA. In Delaware, much of thesouthern and eastern communities in New Castle County are currently considered a MedicallyUnderserved Area (MUA), under the Governor’s Exception Criteria. All of Kent County isconsidered an MUA, under the same criteria. Sussex County is considered a MUA, under theHRSA coding criteria (Health Resource and Services Administration, n.d.).In addition to physical health concerns, about a third of adults reported poor mental healthstatus in 2015 (Kaiser Family Foundation, 2015). These factors, coupled with under-resourcedservice areas, amplify the need for preventative health services, including strategies to bolsterbehavioral health. (For an interactive map of areas of need within the state, visit the DelawareHealth Tracker 2017 SocioNeeds Index.)14
An Overview of the 2017 Delaware State EpidemiologicalProfile ReportThe 2017 Delaware State Epidemiological Profile Report highlights the most recently availabledata on substance use among various populations. It is intended to provide decision-makers withinformation to support needs assessment, strategic planning, and evaluation. The report beginswith an overview of consumption patterns of select substances. Following the overview,individual chapters present narrative summaries for each substance category, which highlightselect findings, followed by graphs and charts detailing reported trends and use. The report alsofeatures a special topic, adverse childhood experiences (ACES) and their association withsubstance use. Finally, the report includes data related to protective factors, which are key toprevention efforts. References are included at the end of the report, alphabetized within chaptergroups.15
Overview: Statewide Consumption Patternsof Select Substances16
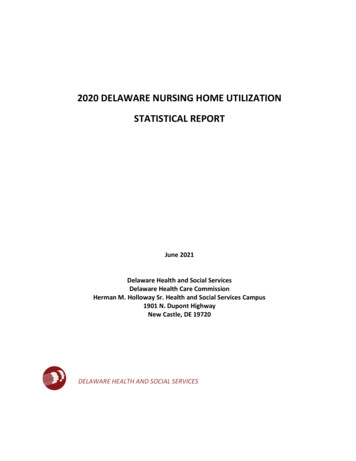
2016 Delaware School SurveyPercent of Delaware 8th and 11th grade students reporting use of selected substances in thepast 30 days30%25%20%15%10%5%0%8th Grade11th GradeFigure 1 Reported use of selected substances in the past 30 days among Delaware 8th/11 th gradersBack to table of figuresSource: “2016 Delaware School Survey.” Center for Drug and Health Studies, University of Delaware.17
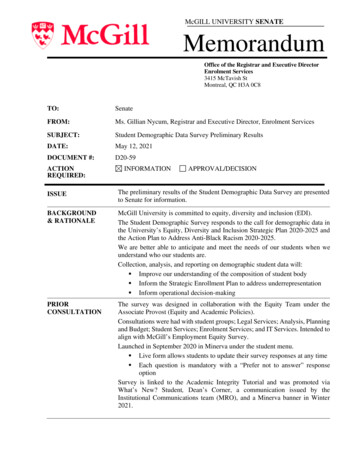
2016 Delaware School SurveyCigarettes: Percentage of 8th and 11th public school studentswho reported using in the past month by zip-codeFigure 2 Past month cigarette use mapBack to table of figuresSource:“2016 Delaware School Survey.” Center for Drug and Health Studies, University of Delaware.18
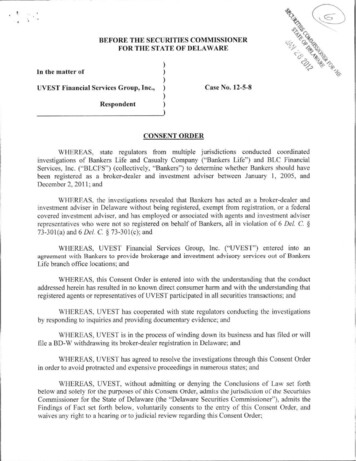
2016 Delaware School SurveyAlcohol: Percentage of 8th and 11th public school studentswho reported drinking in the past month by zip-codeFigure 3 Past month alcohol use mapBack to table of figuresSource:“2016 Delaware School Survey.” Center for Drug and Health Studies, University of Delaware.19
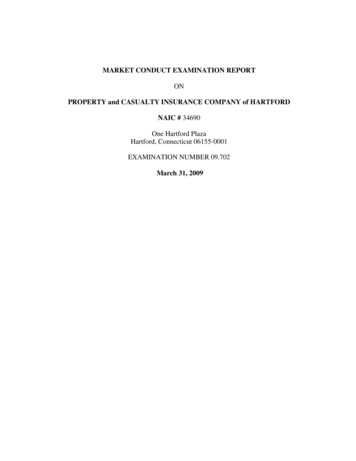
2016 Delaware School SurveyMarijuana: Percentage of 8th and 11th public school studentswho reported using in the past month by zip-codeFigure 4 Past month marijuana use mapBack to table of figuresSource:“2016 Delaware School Survey.” Center for Drug and Health Studies, University of Delaware.20
2016 Delaware School SurveyPain Medications: Percentage of 8th and 11th public school studentswho reported using in the past month by zip-codeFigure 5 Past month pain killer use mapBack to table of figuresSource:“2016 Delaware School Survey.” Center for Drug and Health Studies, University of Delaware.21
Kent County Dover, the capitol and the state's second largest city, is located in Kent County. An estimated 36,047 people lived in Dover in 2010 (US Census Bureau, n.d.). The city is home to the Dover Air . (For an interactive map of areas of need within the state, visit the Delaware Health Tracker 2017 SocioNeeds Index.) 15