Transcription
2020 DELAWARE NURSING HOME UTILIZATIONSTATISTICAL REPORTJune 2021Delaware Health and Social ServicesDelaware Health Care CommissionHerman M. Holloway Sr. Health and Social Services Campus1901 N. Dupont HighwayNew Castle, DE 19720DELAWARE HEALTH AND SOCIAL SERVICES
EXECUTIVE SUMMARYIn 2020, 48 Delaware nursing homes operated 4,953 licensed beds. Most Delaware nursinghomes (46 of 48; 96%) were privately owned and operated in 2020. Private facilities operated 94% of allnursing home beds in Delaware. Delaware’s two publicly-operated nursing home facilities (GovernorBacon Health Center (GBHC) and the Delaware Hospital for the Chronically Ill) operated the remaining 6%of nursing home beds in 2020.In 2020, 8,238 patients were admitted to Delaware nursing homes. In the same year, nursinghomes discharged 8,758 patients. Fifty-one percent of patients discharged from Delaware nursing homesin 2020 were discharged home. Admissions and discharges to Delaware nursing homes follow racialdemographic trends across Delaware. In 2020, White patients accounted for 76% of nursing homeadmissions and discharges. Patients of color accounted for 24% of nursing home admissions anddischarges in 2020, with Black patients representing 22% of all admissions and discharges. Patients 75-84years and 85 years or older accounted for 31% and 30%, respectively, of 2020 Delaware nursing homeadmissions. Twenty-four percent of 2020 nursing home admissions were individuals ages 65-74.Individuals under the age of 65 accounted for 16% of 2020 admissions. Similar age-related trends wereobserved for 2020 discharges.The 2020 Delaware Nursing Home Utilization Statistical Report (DNHUSR) highlights many of theeffects of the COVID-19 pandemic on Delaware nursing home utilization trends. Nationwide, the COVID-19pandemic profoundly impacted nursing homes and other long-term care facilities that cared for individualsmost vulnerable to the effects of the coronavirus. By June 2021, residents of long-term care facilitiesaccounted for 758 of Delaware’s 1,677 COVID-19 deaths (45%); individuals ages 65 accounted for 83% ofCOVID-19 deaths in Delaware. In 2020, Delaware nursing homes admitted 30% fewer patients comparedto 2019. From 2019 to 2020, the aggregate occupancy rate for private Delaware nursing homes fell from86% to 77%. Future versions of the DNHUSR will monitor the long-term impacts of the COVID-19 pandemicon nursing home utilization trends.The Delaware Health Care Commission (DHCC) continues to monitor annual nursing homeadmissions data to identify newly-emerging trends pertaining to long-term care and rehabilitationsservices within Delaware. Long-term care utilization surveillance includes monitoring projected changesin population size at the county and state levels. The growing size and the changing demographics ofDelaware’s population are central to the understanding of the distribution of nursing homes, the numberof licensed nursing home beds, and their utilization.
TABLE OF CONTENTSINTRODUCTION . 1STATEWIDE POPULATION PROJECTIONS . 1PART 1: 2020 DELAWARE NURSING HOME UTILIZATION STATISTICS . 4NUMBER OF FACILITIES AND LICENSED BEDS . 4BILLABLE PATIENT DAYS . 4OCCUPANCY RATES . 7ADMISSIONS. 9DISCHARGES . 12SOURCE OF PAYMENT . 16PART 2: 2020 FACILITY-LEVEL NURSING HOME UTILIZATION STATISTICS . 17APPENDIX A: 2020 NURSING HOME TRENDS AMONG THE UNDER 65 POPULATION . 52
ACKNOWLEDGEMENTSThis report was funded by the Delaware Health and Social Services, Health Care Commission; it isthe product of collaborative support from the Delaware Health Care Facilities Association, the Division ofServices for Aging and Adults with Physical Disabilities, and all Delaware nursing homes. The Health CareCommission thanks these stakeholders and other subject matter experts who provided backgroundinformation, analysis, and feedback to inform the development of this report.
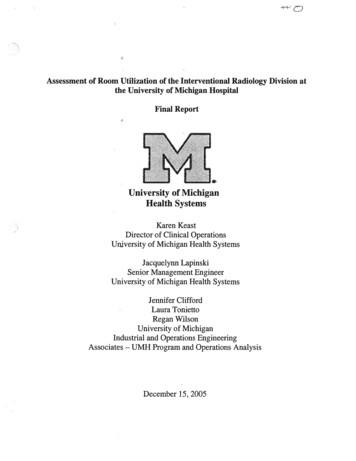
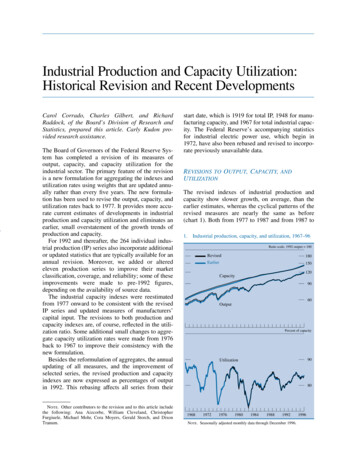
INTRODUCTIONThis, the 34th edition of the Delaware Nursing Home Utilization Statistical Report (DNHUSR),summarizes Delaware nursing home trend data for January 2020 – December 2020. Data summarized inthe DNHUSR are submitted on a monthly basis by Delaware nursing homes1, and aggregated at the endof the reporting year to yield annual trend data by nursing home facility and county. The DNHUSRpresents 2020 Delaware nursing home data in two main sections. Part 1, Delaware Nursing HomeUtilization Statistics, highlights historical facility utilization trend data from 2010 through 2020. Datapresented in this section are aggregated to the state- and county-levels. Part 2, Facility-Level NursingHome Utilization Statistics, presents facility data, including total patient days, occupancy rates,percentage of patients by source of payment, and annual admissions and discharges.The 2020 DNHUSR highlights many of the effects of the COVID-19 pandemic on Delaware nursinghome utilization trends. Nationwide, the COVID-19 pandemic profoundly impacted nursing homes andother long-term care facilities that cared for individuals most vulnerable to the effects of the coronavirus.By June 2021, residents of long-term care facilities accounted for 758 of Delaware’s 1,677 COVID-19deaths (45%); individuals ages 65 accounted for 83% of COVID-19 deaths in Delaware. 2 In 2020,Delaware nursing homes admitted 30.3% fewer patients compared to 2019. From 2019 to 2020, theaggregate occupancy rate for private Delaware nursing homes fell from 86.2% to 77.1%. Future iterationsof the DNHUSR will monitor the long-term impacts of the COVID-19 pandemic on nursing home utilizationtrends.STATEWIDE POPULATION PROJECTIONSThe growing size and the changing demographics of Delaware’s population are central to theunderstanding of the distribution of nursing homes, the number of licensed nursing home beds, and theirutilization. DHCC analyzed 2020 Delaware Population Consortium data to provide the context withinwhich to evaluate Delaware’s ability to meet nursing home bed demand. Figure 1 shows the projectedincrease of Delaware’s total population from 2020 to 2050. Figure 2 shows the projected populationincrease over the same time period among Delawareans ages 65 and older.1Excluded from this report are facilities that serve individuals under the age of 18, as well as Intermediate CareFacilities for Individuals with Intellectual Developmental Disabilities (ICF/IID). ICF/IID facilities provide active andcomprehensive and individualized treatment and rehabilitation services to promote functional status elaware.gov/locations/state/deaths1
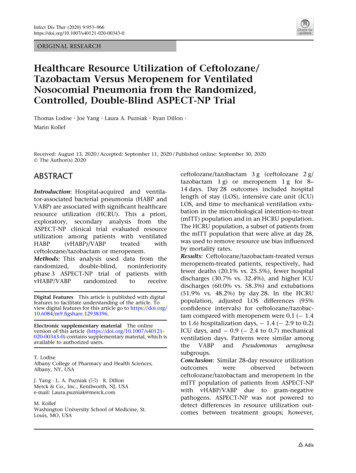
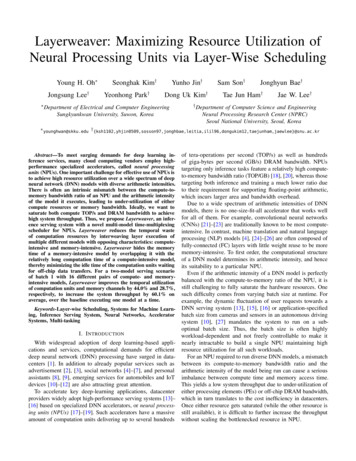
Between 2020 and 2050, Delaware’s total population is expected to increase 7.7% (from 979,920in 2020 to 1,055,289 in 2050). Overall population growth is distributed unevenly across Delaware’scounties. From 2020-2050, New Castle and Kent Counties are expected to experience a 1.3% and 4.3%increase in total population, respectively; total population growth for Sussex County is estimated at25.1% for the same time period.Figure 1: Delaware Population Projections (2020-2050), Overall Population, by CountySource: Annual Population Projections, Delaware Population Consortium, Version 2020.0, October 2020.Projected population growth is more dramatic among older Delawareans. From 2020 to 2050, thestatewide population of Delawareans ages 65 and older is expected to increase 41.1% (from 186,045 to262,581). The most dramatic increases in cohort size are projected among the oldest subpopulations.From 2020 to 2050, the number of Delawareans ages 65-69, 75-79, 80-84, and 85 are projected toincrease 8.7%, 7.1%, 36.6%, 86.3%, and 158.1%, respectively (Figure 2).2
Figure 2: Delaware Population Projections (2020-2050), Age 65 , by Age CohortSource: Annual Population Projections, Delaware Population Consortium, Version 2020.0, October 2020.3
PART 1: 2020 DELAWARE NURSING HOME UTILIZATION STATISTICSNUMBER OF FACILITIES AND LICENSED BEDSIn 2020, 48 Delaware nursing homes operated 4,953 licensed beds. Most Delaware nursing homes –46 out of 48 (96%) – were privately owned and operated in 2020. Private facilities operated 94% of all nursinghome beds in Delaware. Delaware’s two publicly-operated nursing home facilities (Governor Bacon HealthCenter (GBHC) and the Delaware Hospital for the Chronically Ill) operated the remaining 6% of nursing homebeds in 2020. In March 2020, Polaris Healthcare & Rehabilitation Center, a 26-bed private nursing home facilityin Sussex County, opened to patients. In June 2020, GBHC, a 78-bed public nursing home in New CastleCounty, closed permanently. Partial-year data for GBHC is included in the 2020 DNHUSR.Table 1: Delaware Nursing Home Beds, by County and Facility Type, 2010-2020Private FacilitiesNew CastleCountyYearBeds 647647622010-2020% Change3.9%2019-2020% 2020Homes2626272727272727272727Kent PrivatePublicFacilitiesAll FacilitiesBeds Homes Beds Homes1,234 434,39531,234 434,39531,264 444,50531,264 444,58531,264 444,58531,264 444,58231,264 444,58921,264 444,58321,264 454,65721,264 454,64521,290 -0.7%-0.3%2.1%0.5%0.0%0.5%BILLABLE PATIENT DAYSA commonly-used measure of nursing home utilization is the number of billable patient daysgenerated by a facility over a given time period. A billable patient day represents a unit of time (i.e., one day)during which the facility’s services are used by one patient. For example, if a nursing home has 100 patients4
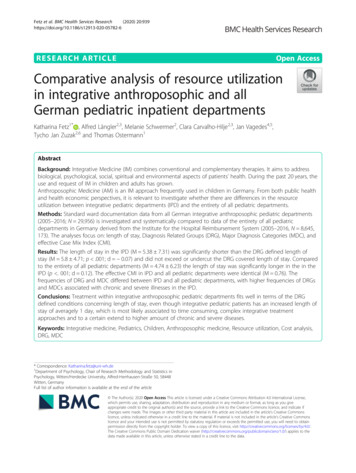
on a day, the facility has generated 100 billable patient days for that 24-hour period. If a facility’s number ofbillable patient days increases from one time period to the next, it is an indication that the facility is caring formore patients, caring for patients for longer periods of time, or a combination of these two factors.Mathematically, billable patient days per facility per year are calculated by summing each facility’s monthlybillable patient days over a 12-month period.From 2010-2019, annual billable patient days for private facilities in Kent, and Sussex remained stable(Table 2; Figure 3). Private facilities in New Castle County experienced an increase in annual billable patientdays from 2010-2014 before stabilizing from 2015-2019. Consistent trends in annual billable patient days areobserved even within the context of ongoing national expansion of home and community-based services andsupports that shift the locus of long-term care away from nursing homes. In 2020, the COVID-19 pandemicreduced the number of billable patient days private facilities in all three counties. From 2019-2020, annualbillable patient days declined 10.0%, 8.2%, and 11.6% in privately-owned New Castle, Kent, and Sussex nursinghome facilities. Billable patient days in public facilities have steadily declined from 2010-2020.5
Table 2: Delaware Nursing Homes, Number of Billable Patient Days Utilized by Year, Facility Type, andCounty, 2010-2020Private FacilitiesPublicAll FacilitiesNew CastleSussexTotalYearFacilitiesKent 4140,0641,352,3052010-2020% % Change-10.0%-8.2%-11.6%-10.2%-26.0%-10.7%Figure 3: Delaware Nursing Homes, Number of Billable Patient Days Utilized by Year, Facility Type, andCounty, 2010-20206
OCCUPANCY RATESOccupancy rates are helpful for putting facilities’ utilization data within the context of availableresources. A facility’s occupancy rate reflects the percentage of available beds occupied by patientsthroughout the reporting year. Occupancy rates were weighted based on the number of days a facility wasopen during the reporting year. Mathematically, for facilities that were open 365 days of the reporting year,Weighted Occupancy Rate [(Number of Billable Patient Days) / (Number of Licensed Bed Days)] * 100%where (Number of Licensed Bed Days) equaled the number of licensed beds in a facility (calculated as theaverage number of beds over the entire 12-month period) multiplied by 365. If a facility was open fewer than365 days of the reporting year, the same weighted occupancy formula was used with the exception that(Number of Licensed Bed Days) equaled the number of licensed beds multiplied by the actual number of daysthe facility was open.In 2020, private nursing homes in New Castle, Kent, and Sussex Counties operated at 78.7%, 72.0%,and 76.6% occupancy, respectively (Table 3; Figure 4). In 2020, Delaware’s two public nursing homescollectively operated at 48.0% occupancy. Prior to the pandemic (i.e., from 2010-2019) occupancy rates forprivate nursing homes consistently approached or exceeded 90%. The comparatively lower occupancy rate forKent County private nursing homes relative to New Castle County and Sussex County private facilities, reflectsa facility-related nuance: the Delaware Veterans Home (a larger, 150-bed facility) operates at a comparativelylower-occupancy (46.0% in 2020) due to admissions-based patient criteria.7
Table 3: Delaware Nursing Homes, Weighted Occupancy Rates, 2010-2020, by Facility Type and CountyPrivate 201920202010-2020% Change2019-2020% %-24.9%-13.7%-10.6%-8.4%-10.1%New %Figure 4: Delaware Nursing Homes, Weighted Occupancy Rates, 2010-2020, by Facility Type and County8
ADMISSIONSIn 2020, Delaware nursing homes admitted 8,238 patients. As shown in Table 4 and Figure 5, annualadmissions to private facilities sharply declined in 2020 amid the COVID-19 pandemic. From 2019-2020,private nursing home admissions fell 29.9%, 34.2%, and 29.6% in New Castle, Kent, and Sussex Counties,respectively. Prior to the pandemic (i.e., from 2010-2019), private nursing home admissions in all threecounties fluctuated within a fairly narrow range: approximately 6,000-7,000 admissions per year in New CastleCounty, approximately 3,000-4,000 admissions per year in Kent County, and approximately 1,300-2,000admissions per year in Sussex County.Conversely, annual admissions to public nursing homes have fluctuated erratically. Over the pastdecade, public nursing home admissions peaked in 2010 (119 admissions) before declining through 2019. Thefalling number of public facility admissions reflect facility closures and/or reduction in the number of availablelicensed public beds. In 2020, public nursing home admissions rose sharply to 33; however, this data pointreflects the transfer of patients from one public nursing home facility to another (i.e., from GBHC to DelawareHospital for the Chronically Ill) prior to the closure of GBHC in June 2020.9
Table 4: Delaware Nursing Homes, Total Number of Nursing Home Admissions, 2010-2020, by Facility Typeand CountyPrivate FacilitiesPublicYearAll FacilitiesNew 2010-2020% Change2019-2020% -26.0%-29.9%-34.2%-29.6%-30.6%1000.0%-30.3%Figure 5: Delaware Nursing Homes, Total Number of Nursing Home Admissions, 2010-2020, by Facility Typeand County10
White patients accounted for 75.8% of all 2020 Delaware nursing home admissions (Table 5). Blackpatients and patients of other races accounted for 21.6% and 2.6% of 2020 nursing home admissions,respectively. This racial breakdown of nursing home admissions is in line with Delaware’s demographicdistribution. Patients 75-84 years and 85 years or older accounted for 31.2% and 29.7%, respectively, of 2020Delaware nursing home admissions. Twenty-three percent of 2020 nursing home admissions were individualsages 65-74. The youngest category of nursing home patients – those under age 65 – accounted for 15.6% of2020 admissions. (Refer to Appendix A for further information on Delaware nursing home admissions anddischarges among the under 65 population.)Table 5: Number (Percentage) of Delaware Nursing Home Admissions, by Race and Age, 2020AgeTotal (by race)Under6565-74 yrs.75-84 yrs.85 568(31.2%)2,449(29.7%)8,238(100.0%)RaceTotal (by age)The percentage of 2020 admissions under the age of 65 was higher among Black patients (25.6%) andpatients of other races (20.9%) relative to White patients (12.6%) (Figure 6). Individuals under the age of 74accounted for 54% of Black admissions and 54.1% of admissions among patients of other races; in comparison,just 34.3% of White admissions were patients under the age of 74. Accordingly, patients ages 85 and olderaccounted for a higher percentage of White admissions (33.7%) relative to Black admissions (17.6%) andadmissions among patients of other races (15.3%).11
Figure 6: Racial Breakdown of Delaware Nursing Home Admissions, 2020, by Race and AgeDISCHARGESIn 2020, Delaware nursing homes discharged 8,758 patients (Table 6; Figure 7), reflecting a sharpdecline in discharges relative to the previous year and coinciding with the COVID-19 pandemic. From 20192020, private nursing home discharges fell 20.1%, 33.9%, and 22.3% in New Castle, Kent, and Sussex Counties,respectively. Prior to the pandemic (i.e., from 2010-2019), private nursing home discharge trends mirroredadmission trends; that is, discharges from private nursing home facilities in all three counties fluctuated withina narrow range. Similar to public nursing home admissions, discharges from public nursing homes havefluctuated erratically over time. The falling number of public facility discharges reflect facility closures and/orreduction in the number of available licensed public beds. From 2019-2020, public nursing home dischargesincreased from 34 to 61; this increase largely reflects discharged patients from GBHC prior to the facility’sclosure in June 2020.12
Table 6: Delaware Nursing Home Discharges, by Facility Type and County, 2010-2020Private FacilitiesPublicNew CastleKentSussexTotalYearFacilitiesAll 10-2020% % Change-20.1%-33.9%-22.3%-23.2%79.4%-22.9%Figure 7: Delaware Nursing Home Discharges, 2010-2020, by Facility Type and County13
As in previous years, in 2020, discharge destination varied greatly by facility type (Table 7). Half of allpatients discharged from private facilities in 2020 returned to their own home or a relative’s home. Comparedto private nursing home discharges, a larger percentage of patients discharged from public facilities weredischarged due to death (49.2% vs. 16.1%, respectively).Table 7: Number (Percentage) of Delaware Nursing Home Discharges, by Facility Type and DischargeDestination, 2020Discharge DestinationOwn (1.0%)8,758(100.0%)Facility TypeAll FacilitiesDischarge statistics mirror admission statistics in terms of patient race and age (Table 8; Figure 8).White patients accounted for 75.7% of Delaware nursing home discharges in 2020. Black patients and patientsof other races accounted for 21.6% and 2.7% of 2020 nursing home discharges, respectively. Individuals 75-84years and 85 years accounted for 29.9% and 34.0% of 2020 Delaware nursing home discharges, respectively.Just over one-fifth (22.1%) of 2020 nursing home discharges were individuals ages 65-74. The youngestcategory of nursing home patients – those under age 65 – accounted for the remaining 14.0% of 2020discharges.Relative to White patients, comparatively larger percentages of Black patients and patients of otherwere under the age of 74 (Figure 8). Fifty-three percent of Black discharges and 45.7% of discharges amongpatients of other races represented individuals under the age of 74; in comparison, just 30.8% of Whitedischarges were patients ages 74 and younger. Accordingly, patients ages 85 and older accounted for a higherpercentage of White discharges (38.3%) relative to Black discharges (20.6%) and discharges among patients ofother races (21.4%).14
Table 8: Number (Percentage) of Delaware Nursing Home Discharges, by Race and Age, 2020AgeTotal (by race)Under6565-74 yrs.75-84 yrs.85 22(29.9%)2,978(34.0%)8,758(75.8%)RaceTotal (by age)Figure 8: Racial Breakdown of Delaware Nursing Home Discharges, 2020, by Age15
SOURCE OF PAYMENTPatient payment source for nursing home care varied by type of facility (Figure 9). In 2020, the majorityof private and public nursing home patients used Medicaid as a source of payment, though a larger percentageof public nursing home patients used Medicaid as a source of payment relative to private nursing homepatients (86.2% vs. 63.7%, respectively). In 2020, 14.6% of private Delaware nursing home patients usedMedicare as a source of payment compared to just 3.3% of public nursing home patients. Sixteen percent ofprivate nursing home residents and 6.3% of public nursing home patients self-paid for their care. A differentpayment source was utilized by 5.8% of private nursing home patients and 4.2% of public nursing homepatients.Figure 9: Percentage of Delaware Nursing Home Patients by Payment Source and Facility Type, 202016
PART 2: 2020 FACILITY-LEVEL NURSING HOME UTILIZATION STATISTICSTable 9Total Billable Patient Days by Facility, 2020Nursing Home2020PatientDaysNCC (Private)Nursing Home2020PatientDaysKent County (Private)Brackenville Center31,413Cadia Rehab Capitol36,594Brandywine Nursing & Rehab46,710Courtland Manor21,219Cadia Rehab Broadmeadow35,935Delaware Veterans Home24,619Cadia Rehab Pike CreekCadia Rehab SilversideChurchman VillageForwood ManorFoulk Manor NorthFoulk Manor South37,40638,19328,53815,32413,10810,120Pinnacle Rehab & HealthSilver Lake CenterThe Center at Eden HillWestminster VillageKent County (Private) Total45,96937,61213,48720,662200,162Gilpin HallHillside CenterJeanne Jugan Residence31,03035,42610,543Sussex County (Private)Atlantic ShoresCadia Rehab Renaissance57,51636,180Kentmere Rehab & HealthcareKutz Rehab & Nursing33,64928,132Country Rest HomeDelmar Nursing & Rehab18,14527,302ManorCare Pike Creek44,240Harbor Health Care50,316ManorCare Wilmington40,285Harrison Senior Living34,167MillcroftNew Castle Health & RehabNewark ManorParkview Nursing & RehabRegal Heights Healthcare & RehabRegency Healthcare & RehabShipley Manor Health CareStonegatesWeston Senior Living CenterWBC Cokesbury VillageWBC Country HouseNCC (Private) 0695,37412,68613,693752,439Lofland Park CenterMilford CenterPolaris HealthcareSeaford CenterThe Moorings at LewesWBC Manor HouseSussex County (Private) al Private FacilitiesPublic FacilitiesDE Hosp for Chronically IllGovernor Bacon Health CenterPublic TotalTotal All : NCC New Castle County.17
Table 10Weighted Occupancy Rates by Facility, Type, and County, 2020BillablePatient Days2020Number ofLicensed Beds2020(weighted)Licensed andywine Nursing & Rehab31,41346,71010416937,96061,68582.8%75.7%Cadia Rehab Broadmeadow35,93512043,80082.0%Cadia Rehab Pike Creek37,40613047,45078.8%Cadia Rehab Silverside38,19311742,70589.4%Churchman Village28,53810136,86577.4%Forwood Manor15,3247226,28058.3%Foulk Manor North13,1084616,79078.1%Foulk Manor South10,1204616,79060.3%Gilpin Hall31,0309635,04088.6%Hillside Center35,42610638,69091.6%Jeanne Jugan Residence10,5434014,60072.2%Kentmere Rehab & Healthcare33,64910437,96088.6%Kutz Rehab & Nursing28,1329032,85085.6%ManorCare Pike Creek44,24017764,60568.5%ManorCare ,15052.0%New Castle Health & Rehab39,34112043,80089.8%Newark Manor21,2476724,45586.9%Parkview Nursing & Rehab43,19915054,75078.9%Regal Heights Healthcare & Rehab55,39017262,78088.2%Regency Healthcare & Rehab31,24210036,50085.6%Shipley Manor Health 1%Weston Senior Living Center5,374196,93577.5%WBC Cokesbury Village12,6864516,42577.2%WBC Country HouseNCC (Private) rsing HomeNCC (Private)Brackenville Center18
Table 10(Continued)Weighted Occupancy Rates by Facility, Type, and County, 2020Nursing HomeBillablePatient Days2020Number ofLicensed Beds2020(weighted)Licensed BedDays2020(weighted)Occupancy nt County (Private)Cadia Rehab CapitolCourtland ManorDelaware Veterans HomePinnacle Rehab & HealthSilver Lake CenterThe Center at Eden HillWestminster VillageKent County (Private) TotalSussex County (Private)Atlantic ShoresCadia Rehab RenaissanceCountry Rest HomeDelmar Nursing & RehabHarbor Health CareHarrison Senior LivingLofland Park CenterMilford CenterPolaris HealthcareSeaford CenterThe Moorings at LewesWBC Manor HouseSussex County (Private) TotalTotal Private FacilitiesPublic FacilitiesDE Hosp for Chronically IllGovernor Bacon Health CenterPublic TotalTotal All FacilitiesNotes: NCC New Castle County. Weighted occupancy rates for individual facilities are calculated as the ratio of Billable Patient Days andLicensed Bed Days. Licensed Bed Days are calculated as (Number of Licensed beds (as of December of the reporting year))*(Total days thefacility was open during the reporting year). Weighted occupancy rates at county, facility type, and state levels are calculated as the ratio ofBillable Patient Days (sum of each facility in the category) and Licensed Bed Days (sum of each facility in the category).19
Table 11Patient Source of Payment by Facility, Type, and County, 2020Nursing HomeMedicaidMedicareSelf-PayOther*TotalNCC (Private Facilities)12.7%23.6%5.0%100%Brandywine Nursing & Rehab58.4%85.5%8.8%5.7%0.0%100%Cadia Rehab Broadmeadow62.8%22.3%9.0%5.9%100%Cadia Rehab Pike Creek49.0%31.1%6.8%13.1%100%Cadia Rehab SilversideChurchman VillageForwood ManorFoulk Manor .8%33.7%6.0%3.2%100%100%34
1 INTRODUCTION This, the 34th edition of the Delaware Nursing Home Utilization Statistical Report (DNHUSR), summarizes Delaware nursing home trend data for January 2020 - December 2020. Data summarized in the DNHUSR are submitted on a monthly basis by Delaware nursing homes1, and aggregated at the end of the reporting year to yield annual trend data by nursing home facility and county.