Transcription
QlikView FullBrowser UserManualUser ManualHenrik Steen8-13-2014
CREATE DATE2014-08-13CHANGE DATE2014-09-16OWNERHenrik SteenREVISION01PAGE1.Table of Content1Introduction . 32QlikView AccessPoint . 33Interface. 343.1Object .43.2Working with Objects .43.3Help .4Tool Bars . 44.1Navigation Toolbar .45Sheet. 56Container . 57Charts . 68Drill-down and Cyclic Groups (Dimensions) . 69Cyclic Groups (Expressions) . 710 Selections . 710.1 Filters .710.2 Right-click on Filters .810.3 Associative Search .910.4 Select in Chart.910.5 Search Object . 1011 Bookmarks. 1011.1 Add Bookmark . 1011.2 Bookmark Administration . 1112 Pivot Table . 1212.1 Horizontal and Vertical Columns in a Pivot Table . 1212.2 Expand all/Collapse all in a Pivot Table . 1413 Notes and Comments . 1414 Object Menu (Export Data, etc.) . 1414.1 Export Data . 15Endeavor AB, 411 18 GÖTEBORG, Norra Liden 2A 46 31 40 68 80, info@endeavor.se, www.endeavor.se
CREATE DATE2014-08-13CHANGE DATE2014-09-16OWNERHenrik SteenREVISION01PAGE2.14.2 Copy . 1515 Chart Types . 1515.1 Bar chart (incl. trellis chart) . 1515.2 Line chart . 1615.3 Combo chart . 1615.4 Radar chart . 1715.5 Gauge chart . 1715.6 Scatter chart . 1715.7 Grid chart . 1815.8 Pie chart . 1815.9 Funnel chart . 1915.10 Block chart . 1915.11 Straight table (incl. mini chart). 1915.12 Pivot table . 2015.13 Mekko Chart . 2015.14 Container (contains several charts) . 2015.15 List Box (with expressions) . 21Endeavor AB, 411 18 GÖTEBORG, Norra Liden 2A 46 31 40 68 80, info@endeavor.se, www.endeavor.se
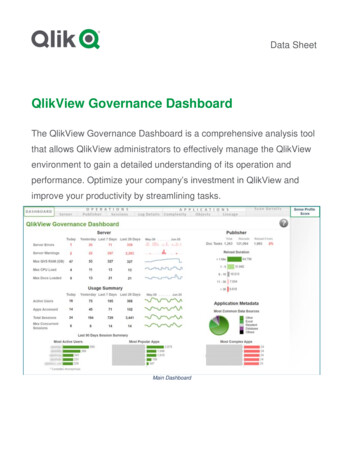
CREATE DATE2014-08-13CHANGE DATE2014-09-16OWNERHenrik SteenREVISION01PAGE3.1 IntroductionThis document is a brief manual for QlikView Full Browser client, first and foremost written forQlikView business users.2 QlikView AccessPointQlikView is accessed through a web browser (Internet Explorer, Chrome, Safari, etc.) or the QlikViewiOS application. The QlikView Plugin is only available for Internet Explorer, but the Ajax client isavailable on all browser, including mobile devices.The Full Browser client requires no installation on the client machine.3 InterfaceTool barSheetSelection onToolbarSheetsThe QlikView navigation toolbar contains buttons for the most frequently neededfunctions when using QlikView for analyzing data.A QlikView document can have one or several sheets on which sheet objects areplaced. Each sheet can contain many sheet objects.List boxes and multi boxes are used to make selections in the documentSelectionobjectsChartCharts and tables are sheet objects that can show numbers very compactly. It ispossible e.g. to show sums of money, distributed over different fields such asyear, month, account number, etc.Charts and tables can be set to display either the frequencies of different valuesof a field, or a calculated entity, e.g. the sum of the possible values of a field. Inboth cases, a certain field must be chosen as x-axis, i.e. this field will be used tolabel the slices of the pie, the different bars in the bar chart and the rows in theEndeavor AB, 411 18 GÖTEBORG, Norra Liden 2A 46 31 40 68 80, info@endeavor.se, www.endeavor.se
CREATE DATE2014-08-13CHANGE DATE2014-09-16ContainerOWNERHenrik SteenREVISION01PAGE4.pivot table, respectively.Containers can be used to group objects on the same sheet.3.1 ObjectObject is a central QlikView terms. Everything that’s visible on the sheet is an object.List boxes, charts, icons and graphics are all objects, but different types of objects.3.2 Working with ObjectsEach object has a menu with commands, accessed by right-clicking the object. For some objectsthere is more than one menu. The menu displayed depends on where in the object you right-click.Right-click on the caption to access the standard object menu.3.3 HelpQlikView has a built-in help where object descriptions can be found. Right-click an object and choose“Help” to have a look at the specific help content.4 Tool BarsThere are several toolbars available in QlikView Plugin. The toolbars are shown in the top of the webpage. The user can add and remove toolbars. The most important toolbar is the navigation toolbar.4.1 Navigation ToolbarCommandDescriptionClearClears selections (which are not locked).Clear contains a drop-down menu with additional commandsReverts to the preceding logical state. Applies to value selections and allthe selection commands. QlikView maintains a list of the 100 lateststates. Each Back will take one step further back in the list.Reverts to the logical state before a Back command. Toggle between twostates by alternating between the Back and Forward commands.Undo layout changes.Redo layout changes.Locks all the current value selections. The commands Clear, Back andForward do not affect locked selections.Unlocks all the currently locked value selections.Opens the Current Selections dialog in which it is possible to see theselections that are active.Opens the notes pane. Notes and comments can be added to all objectswhen connected to a QlikView server, allowing users to create and sharenotes about the current object.Opens the Repository pane with objects, dimension, expressions andbookmarks. The Repository pane is used by the user to create and editcharts, list boxes, etc.Opens the New Sheet Object pane. The New Sheet Object pane is usedby the user to create charts, list boxes, etc.BackForwardUndo LayoutRedo ositoryNew SheetObjectEndeavor AB, 411 18 GÖTEBORG, Norra Liden 2A 46 31 40 68 80, info@endeavor.se, www.endeavor.se
CREATE DATE2014-08-13CHANGE DATE2014-09-16Select t ReportShare SessionMoreMoreMoreOpen HelpMail withBookmark asa Link.DocumentSupportInfo.CloseOWNERHenrik SteenREVISION01PAGE5.Opens the Select Fields pane. The Select Fields pane is used by the userto add list boxes or edit charts, etc.Opens the Add Bookmark Pane.Opens the Remove Bookmark Pane.The bookmark drop-down contains list of all bookmarks in the documentand offers a way of changing bookmarks.The report drop-down contains a list of all reports in the document.Share your QlikView session to collaborate with other people (requiressession collaboration to be enabled on QlikView Server).Contains additional commands.Open on-line help.Creates a mail with a URL link to the current server document. Atemporary server bookmark will be created (including layout state) andencoded in the URL.The mail recipient will be able to use the URL link to open the serverdocument and see what you see, obviously provided that he has accessrights to the document and data therein.Opens the Document Support Information dialog, displaying a list ofsupport data pertaining to the active document.Closes the QlikView document and frees resources on the server.5 SheetA QlikView document can have one or several sheets on which sheet objects are placed. Each sheetcan contain sheet objects. The sheets have no connection with the logic, if two fields are logicallyconnected, it does not matter if they are put on the same sheet or on different sheets. The logicalresult when making selections will still be the same.6 ContainerContainers are sheet objects which can contain other sheet objects (containers, charts, list boxes,etc.). Containers is a way to effectively use the screen real-estate. Use the tabs in the Containerobject to switch between the charts.Endeavor AB, 411 18 GÖTEBORG, Norra Liden 2A 46 31 40 68 80, info@endeavor.se, www.endeavor.se
CREATE DATE2014-08-13CHANGE DATE2014-09-16OWNERHenrik SteenREVISION01PAGE6.7 ChartsCharts are used to analyze the data. There are quite a few different types of charts, which includesgraphs as well as tables. The different types can be configured in different styles and layouts. Seesection Chart Types for examples.Charts have the possibility to use Fast Change. This enables the user to switch between differentchart types, while still analyzing the same data, e.g. switching from a bar chart to a straight table.This enables sorting and viewing of the exact figures even for a bar chart.Data traditionally displayed along the X axis are called dimensions, which is what we view our data“by” (e.g. by Month, by Salesperson or by Region).Data traditionally displayed along the Y axis are named as expression, which is the actual data; forexample Sales margin, Turnover or Number of Orders.Some charts have a caption. By right-clicking the Fast Change icon at the top right corner, theavailable char types are displayed. Selecting one of these will change the chart layout.8 Drill-down and Cyclic Groups (Dimensions)Two or more dimension can be used as a pre-defined group. Groups can be either as drill-down orcyclic, both explained below.Drill-down groups are visualized with an arrow pointing up.A cyclic group is visualized with a semi-circle arrow.By clicking the cyclic group symbol, the current dimension changes to the next dimension in the predefined group. Right-clicking the symbol will display all dimensions the group contains.Drill-down group example: Customer Group Customer Invoice No Invoice Row.Cyclic group example: Customer, Item Group, Sales person, Item.Endeavor AB, 411 18 GÖTEBORG, Norra Liden 2A 46 31 40 68 80, info@endeavor.se, www.endeavor.se
CREATE DATE2014-08-13CHANGE DATE2014-09-16OWNERHenrik SteenREVISION01PAGE7.A drill-down enables a logic drill through the data as a hierarchy, while the cyclic group enables alarge variety of dimension but the same expression(s) instead of creating multiple objects.9 Cyclic Groups (Expressions)A chart can have several expressions visible, though it might not always be preferable. Instead itcould be more user-friendly to enable a rotation of different expressions in the same chart with thesame dimension(s).The symbol for a cyclic group is a circle arrow.chart.This is placed in the bottom left corner of theA cyclic group may look like this: Turnover, Gross margin, Gross profit, Turnover, Gross margin, Grossprofit, and so on.The main aspect here is that the dimension stays the same, even if we are analyzing differentexpressions.10 Selections10.1 FiltersThe purpose of filter is to select the information to view in charts and other objects. If the selectionsaffect objects in other sheets, this is highlighted with a green dot next to the affected sheet name inthe tab row.If a filter consists of a group (cyclic or drill-down) it’s represented with the appropriate icon:orin the top-right corner of the filter box.Endeavor AB, 411 18 GÖTEBORG, Norra Liden 2A 46 31 40 68 80, info@endeavor.se, www.endeavor.se
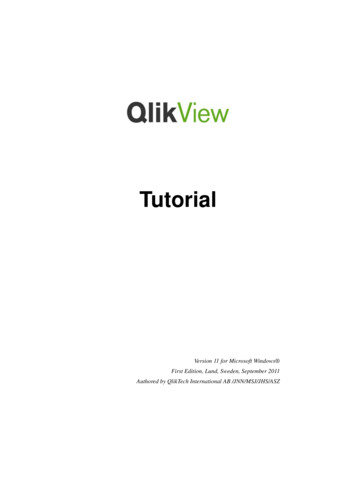
CREATE DATE2014-08-13CHANGE DATE2014-09-16OWNERHenrik SteenREVISION01PAGE8.If you made a regular selection, this is represented with a green color.If the items are white, this implies they are associated with your currentselections and still selectable.If the selection is locked, this is visualized with a blue color.If the items appear with a gray background, this implies they are not associated with your currentselection. Selecting these will clear other selections.Your current selections are displayed in the Current Selection box. However, the Current Selectionbox is limited to showing only the field name from the QlikView document, no caption can be set.It is also possible to adjust the selections directly in the Current Selections box. Use the icons(Lock/Unlock, Clear, Drop-down list) or right-click on an item.10.2 Right-click on FiltersIf you right-click on a filter box you will see a menu with several commands related to the field in thefilter box. The same menu will also appear if you right-click on a field in the current selections box.Endeavor AB, 411 18 GÖTEBORG, Norra Liden 2A 46 31 40 68 80, info@endeavor.se, www.endeavor.se
CREATE DATE2014-08-13CHANGE DATE2014-09-16OWNERHenrik edSelectPossibleClear otherfieldsLockUnlockAll excluded values in the list box are selected.All non-excluded values in the list box are selected.Clears the selections in all the other sheet objects, while maintaining the ones inthe current list box.Locks the selected value(s) in the active list box.Unlocks the locked value(s) in the active list box.10.3 Associative SearchBy clicking the plus sign in the search control, it is possible to enter the associative search logic. Thismeans that it is possible to search in other fields and get the result set in the field to which thesearch control belongs. It is then also possible to simultaneously search in several fields.10.4 Select in ChartFurthermore, it’s possible to make selections direct in the chart or table. This is done by left-clickingand selecting an area or a single cell.Endeavor AB, 411 18 GÖTEBORG, Norra Liden 2A 46 31 40 68 80, info@endeavor.se, www.endeavor.se
CREATE DATE2014-08-13CHANGE DATE2014-09-16OWNERHenrik SteenREVISION01PAGE10.10.5 Search ObjectIn QlikView 9 a search object was added. A search object allows the user to search in several fields atthe same time while taking up a small amount of screen space. However, the search object is limitedto showing only the field name from the QlikView document, no caption can be set.11 Bookmarks11.1 Add BookmarkAs previously mentioned, the bookmarks are added by the bookmark commands in the toolbar. Thefollowing dialog is shown when a new bookmark is added:Endeavor AB, 411 18 GÖTEBORG, Norra Liden 2A 46 31 40 68 80, info@endeavor.se, www.endeavor.se
CREATE DATE2014-08-13CHANGE DATE2014-09-16OWNERHenrik SteenREVISION01PAGE11OptionsDescriptionShare Bookmarkwith OthersIncludeSelections inBookmarkMake bookmarkapply on top ofcurrent selectionInclude LayoutStateMarking this check box will immediately share the bookmark for use by otherauthenticated users of the same server document.By marking the check box the bookmark will include the selections made inthe application.Include ScrollpositionsInclude InputField Values.By marking the check box, the bookmark will be applied without first clearingexisting selections in the document.By marking the check box, the bookmark will store information about thesheet from which it was created and the state of all sheet objects on thatsheet.By marking the check box, the bookmark will store information about thescrolling position in the charts.By marking this check box, the values in input fields will be stored in thebookmark.11.2 Bookmark AdministrationBookmark administration is performed in the repository Pane which can be opened from thenavigation tool bar. In the dialog it is possible to edit and remove your own bookmarks and selectwhich of the shared bookmarks to display.Endeavor AB, 411 18 GÖTEBORG, Norra Liden 2A 46 31 40 68 80, info@endeavor.se, www.endeavor.se
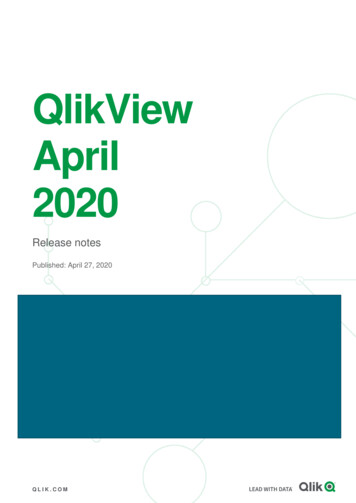
CREATE DATE2014-08-13CHANGE DATE2014-09-16OWNERHenrik SteenREVISION01PAGE12OptionsDescriptionShowMark this check box if you want the bookmark to appear in bookmark objectlistings and in the Bookmarks menu.Share Bookmark with Others.Sharing.12 Pivot Table12.1 Horizontal and Vertical Columns in a Pivot TableDragging and drop a dimension to choose whether it should be viewed horizontal or vertical. You caneasily transform a pivot table to fit your personal needs even better.Let’s start in the pivot table:Endeavor AB, 411 18 GÖTEBORG, Norra Liden 2A 46 31 40 68 80, info@endeavor.se, www.endeavor.se
CREATE DATE2014-08-13CHANGE DATE2014-09-16OWNERHenrik SteenREVISION01PAGE13.Click and hold the label "Project" with the left mouse button. While holding the button, drag thecolumn to the right and upwards until the green horizontal line is visible and then release the button.The column "Project" should now be placed horizontal instead of vertical giving you a result asbelow.The same technique can be used to order columns differently, e.g. changes the pivoting group order.Endeavor AB, 411 18 GÖTEBORG, Norra Liden 2A 46 31 40 68 80, info@endeavor.se, www.endeavor.se
CREATE DATE2014-08-13CHANGE DATE2014-09-16OWNERHenrik SteenREVISION01PAGE14.12.2 Expand all/Collapse all in a Pivot TableUsing the and - signs in the pivot table dimensions to expand or collapse many rows becomestedious after some time. Right-click on the dimension and use Expand all or Collapse all to expand orcollapse the entire dimension.13 Notes and CommentsNotes and comments can be added to all objects when connected to a QlikView server, allowingusers to create and share notes about the current object.Notes are shared with other QlikView users, and these users can respond by leaving their owncomments. It is also possible to save a snapshot (bookmark) of the data with each note.When right-clicking an object, it is possible to add a new note and to view existing notes, by selectingNotes from the context menu. After having selected Add a New Note or View Attached Notes, allobjects in the current document with existing notes are supplied with an indication in the top leftcorner. The number of attached notes for each object is displayed in the indication.14 Object Menu (Export Data, etc.)To see the available operations available on a chart you can always right-click the chart. The rightclick menu contains commands for printing, exporting and more.Endeavor AB, 411 18 GÖTEBORG, Norra Liden 2A 46 31 40 68 80, info@endeavor.se, www.endeavor.se
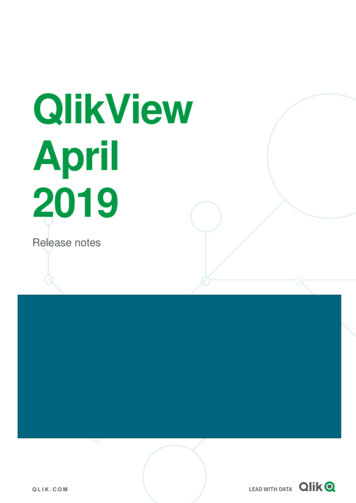
CREATE DATE2014-08-13CHANGE DATE2014-09-16OWNERHenrik SteenREVISION01PAGE15.14.1 Export DataUse Export or Send to Excel to get the data from QlikView to another application. Send to Excel willdownload an Excel file with the data from the chart and Export downloads a file with the data inComma-separated-values (CSV).14.2 CopyThe Copy command will copy a sheet object and allow you to paste a copy in the QlikView document.15 Chart TypesThis is a list of the chart types that exist in QlikView. Depending on the chart settings, the chart typemay look different from the examples presented here.15.1 Bar chart (incl. trellis chart)Endeavor AB, 411 18 GÖTEBORG, Norra Liden 2A 46 31 40 68 80, info@endeavor.se, www.endeavor.se
CREATE DATE2014-08-13CHANGE DATE2014-09-16OWNERHenrik SteenREVISION01PAGE16.15.2 Line chart15.3 Combo chartEndeavor AB, 411 18 GÖTEBORG, Norra Liden 2A 46 31 40 68 80, info@endeavor.se, www.endeavor.se
CREATE DATE2014-08-13CHANGE DATE2014-09-16OWNERHenrik SteenREVISION01PAGE17.15.4 Radar chart15.5 Gauge chart15.6 Scatter chartEndeavor AB, 411 18 GÖTEBORG, Norra Liden 2A 46 31 40 68 80, info@endeavor.se, www.endeavor.se
CREATE DATE2014-08-13CHANGE DATE2014-09-16OWNERHenrik SteenREVISION01PAGE18.15.7 Grid chart15.8 Pie chartEndeavor AB, 411 18 GÖTEBORG, Norra Liden 2A 46 31 40 68 80, info@endeavor.se, www.endeavor.se
CREATE DATE2014-08-13CHANGE DATE2014-09-16OWNERHenrik SteenREVISION01PAGE19.15.9 Funnel chart15.10Block chart15.11Straight table (incl. mini chart)Endeavor AB, 411 18 GÖTEBORG, Norra Liden 2A 46 31 40 68 80, info@endeavor.se, www.endeavor.se
CREATE DATE2014-08-13CHANGE DATE2014-09-16OWNERHenrik SteenREVISION0115.12Pivot table15.13Mekko Chart15.14Container (contains several charts)Endeavor AB, 411 18 GÖTEBORG, Norra Liden 2APAGE20. 46 31 40 68 80, info@endeavor.se, www.endeavor.se
CREATE DATE2014-08-1315.15CHANGE DATE2014-09-16OWNERHenrik SteenREVISION01PAGE21.List Box (with expressions)Endeavor AB, 411 18 GÖTEBORG, Norra Liden 2A 46 31 40 68 80, info@endeavor.se, www.endeavor.se
This document is a brief manual for QlikView Full Browser client, first and foremost written for QlikView business users. 2 QlikView AccessPoint QlikView is accessed through a web browser (Internet Explorer, Chrome, Safari, etc.) or the QlikView iOS application. The QlikView Plugin is only available for Internet Explorer, but the Ajax client is