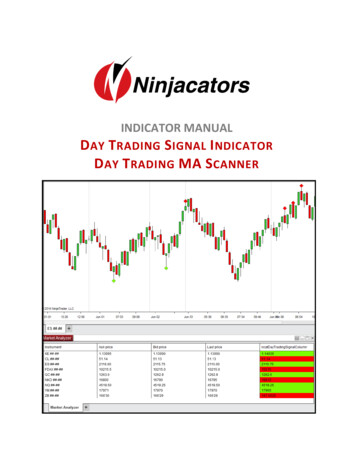
Transcription
Technical GuideRAG Rating Indicator ValuesIntroductionThis document sets out Public Health England’s standard approach to the use of RAGratings for indicator values in relation to comparator or benchmark values.RAG (Red-Amber-Green) ratings, also known as ‘traffic lighting,’ are used to summariseindicator values, where green denotes a ‘favourable’ value, red an ‘unfavourable’ value andamber a ‘neutral’ value.These colours are used in different visualisations. One method is in a matrix, typicallyreferred to as a ‘tartan rug.’ This matrix usually has columns for each area or organisation,and rows for each indicator. Each cell then has a background colour of red, amber or greenwhich is determined by the indicator value, with a contrasting text colour.The same methodology is also used to highlight favourable and unfavourable values in otherpresentations, for example on spine charts1 or in key messages for profiles.There are different fundamental approaches to assigning RAG ratings:1. arbitrary or subjective criteria or targets2. statistical significanceApproach 1 is common in performance management. For example, some performancemonitoring systems can be set to ‘trigger’ at /– 10%, say, or when a fixed target is missed,without regard to the statistical properties of the indicator being PHDS Guidance - Spine Charts.pdfPublic Health Data ScienceVersion: 20 June 2017Page 1
This document focuses on the second approach: definitions should be based on statisticalcomparisons with a comparator; indicator values should only be given red or green RAGratings if they are statistically significantly higher or lower than the comparator.However, there are circumstances where additional criteria might be applied in addition tostatistical significance (see Additional criteria below).Terminology and colouring conventionsUsually, when comparing a value to a comparator, red corresponds to a value that issignificantly ‘worse,’ green to a value that is significantly ‘better,’ and amber indicates thatthere is no significant difference.When the polarity of the indicator (that is higher values are ‘worse’ or higher values are‘better’) is unequivocal the terms ‘better’ and ‘worse’ should be used, and the colours red,amber and green are appropriate. Metadata should define clearly the polarity of the indicator,as well as detailing the data sources and methodology. This approach should be usedwhenever it is appropriate as it makes results a lot easier to interpret.Where it is inappropriate to label high or low values as ‘better’ or ‘worse,’ for exampleproportion of ethnic minorities, or the proportion of pregnancies terminated, the terms ‘higher’and ‘lower’ should be used with neutral colouring such as shades of blue, from light to dark.Labelling must not imply that high values of such indicators, for example, are ‘worse.’ 2Comparative methodsThere are a number of methods that are commonly used for making the comparisonsrequired for RAG rating. These include use of: confidence intervals (CIs) statistical process control (SPC) hypothesis testingConfidence intervals and SPC are derived from summary statistics (for example, meanvalues, standard deviations, counts) whereas often hypothesis (statistical) tests may requirecalculations from raw data. However there are cases when using confidence intervals isinappropriate, cases when SPC is not applicable and cases where neither is appropriate.2Some PHE profile publications have used neutral colouring for all indicators but this is confusing and notrecommended.Page 2
Whether each approach is appropriate will be determined by the following factors:1. the type of comparator2. the type of indicatorThe table below summarises which methods are likely to be appropriate for differentindicator and comparator types. Note that there will be exceptions to these generalisations.The types are explained in the sections that follow.Type of indicatorCounts/ratesProportionsNormal variatesOthers (for example, lifeexpectancy, syntheticestimates etc.)Fixed referencevalueCIs SPC TestCIs SPC TestCIs SPC TestType of comparatorReferencepopulation valueCIs SPCTestCIs SPCTestCIs SPCTestReference samplevalueCIs SPC TestCIs SPC TestCIs SPC TestCIsCIsCIsSPCTestSPCTestSPCTestKeyRed: method probably not applicable or appropriateAmber: method not ideal, but acceptable under many circumstancesGreen: method probably appropriateTypes of comparatorBroadly there are three types of comparator:1. A fixed reference value (for example, 95% target for screening coverage)2. A reference population indicator value (for example, England life expectancyat birth)3. A reference sample comparator (for example, comparison of mortality ratesfor a geography with a baseline time period, or comparison of areas withpeers)A key characteristic of these different comparator types is whether the comparator value istreated as being a fixed parameter value (as in 1), or whether it has inherent uncertainty, thatis, its own confidence interval (as in 3).A reference population comparator (2) is typically treated as being a fixed value, particularlywhen the reference population is much larger than that of the area being compared, so itsconfidence interval is very much narrower. Most of the uncertainty derives from the smallPage 3
sample value, so it is convenient to ignore the uncertainty in the reference population value.This is reasonable, when necessary, although it should be described carefully. In particular,it is generally not appropriate to state that, with regard to an indicator, one sub-geography issignificantly better or worse than England, when that geography lies within England. Ratherthe indicator should be described as being significantly higher or lower than the mean (ormedian, for example, as appropriate) for England.Values of indicators being compared should be independent of each other. For the examplein the previous paragraph, the England value is not completely independent of the subgeography being compared, but if the sub-geography is small, its influence on the Englandvalue is very small and so can be ignored. Another example is overlapping 3 or 5-yearperiods, where sequential time periods share two-thirds or four-fifths of the data they arederived from: these can never be compared using methods that assume independence –they require more complex methods and should be avoided: compare only distinct timeperiods, for example, 2001-2005 can be compared with 2006-2010, but 2005-09 cannot.However, in some cases where samples are not independent a simple alternative approachcan be used. For example, if observations relate to a fixed group of subjects (ororganisations, for example) in two separate time periods then it is not usually appropriate toassume that the observations are independent. In this case it may be appropriate tocompare the increase (or reduction) in the indicator value between the two periods for eachsubject. This then becomes a comparison with a fixed reference value of zero.In the following discussion types 1 and 2 (as defined above) are considered jointly as relatingto a fixed reference value, and type 3 separately as relating to comparison of two variables.Types of indicatorDifferent methods are required according to the type of value that an indicator can take.Generally, indicators can be: counts and rates (for example, hospital admissions, admission rates ormortality rates) proportions (for example, prevalence of a condition or percentage lowbirthweight) normal variates (any indicator can typically be treated as a normal variate if itis an average of a sufficiently large sample of events/cases) others (for example, indicators whose underlying distributional properties arecomplex, for example, synthetic estimates based on survey data, lifeexpectancy, and so on)Indicator types are often assumed to have a particular statistical distribution. For example,continuous indicators may be normally distributed, and even if the underlying distribution isPage 4
non-normal, they can be treated as approximately normally-distributed if they are based on alarge enough sample, or if the number of cases is large (the central limit theorem ofdistribution theory states that any distribution tends to the normal distribution as the samplebecomes large). For many public health indicators, the distributional properties are simpleand known, for example, counts (and rates that are counts divided by a population) arecommonly assumed to be Poisson-distributed, and proportions are assumed to be binomiallydistributed.3 APHO Technical Briefing 3: Common Public Health Statistics and theirConfidence Intervals4 describes the methods used to calculate confidence intervals for thesetypes of indicator, based on the appropriate underlying distributions. It is important tounderstand, and verify, such assumptions, as they have an impact on the assessment ofstatistical significance, and so may affect an indicator’s RAG rating. Appendix 1 deals witheach type of indicator in a little more detail.Some indicators are derived from more complex distributions. For example, life expectancyhas no simple underpinning distribution, as it is the result of combining death rates fordifferent age groups using a life table. Confidence intervals can be calculated by making anormal approximation, but life expectancies for different areas cannot be compared usingsignificance tests or SPC approaches. The same is true for synthetic estimates based onmodels which combine multiple predictor variables, each of which has its own uncertainty.Significance tests however may be possible using more advanced techniques such asmultiple regression or bootstrapping/simulation.Confidence intervalsConfidence intervals are associated with an estimate obtained from data, such as anindicator value. A confidence interval is defined in terms of a confidence level (often denotedas (1–α) 100%, where α is the ‘significance level’) and calculated using observed data. Theinterval is described by a lower confidence limit (LCL) and an upper confidence limit (UCL).RAG ratings are defined as red or green if a fixed reference value falls above the UCL orbelow the LCL respectively, and amber otherwise.In the case of a comparator which has uncertainty itself, confidence intervals cannot simplybe used. If two confidence intervals do not overlap then it is accurate to state that theindicators differ at the appropriate significance level. However, where confidence intervals dooverlap it is does not follow that there is no evidence that the indicator values differsignificantly. In such a case hypothesis testing can often be used (see example underHypothesis testing below).3Departures from these assumed distributions should be checked though, as these could lead to bias and/orover- or cuments/APHO Tech Briefing 3 Common PH Stats and CIs.pdfPage 5
Definitions of confidence intervals for many public health indicators are given in APHOTechnical Briefing 3: Common Public Health Statistics and their Confidence Intervals.5Statistical process controlAlternative, but generally equivalent methods are frequently available through statisticalprocess control (SPC). Rather than comparing the reference value with confidence intervalsaround an indicator value, SPC compares an indicator value with ‘control limits’ around areference value. Indicators within control limits are considered to exhibit ‘common cause’variation only and are classified as amber.Indicator values that fall outside of control limits are considered to be a result of ‘specialcause’ variation (that is, they are different as the result of underlying causes, such as socioeconomic or other determinants) and are classified as red or green.Control limits are often defined as multiples of the standard deviation (σ) about the referencevalue (μ).6Control limits vary according to some characteristics, such as population size. Control limitsand data points in such a case can be plotted against this characteristic in the form of afunnel plot.Further details of SPC methods are given in APHO Technical Briefing 2: Statistical processcontrol methods in public health intelligence.7Hypothesis testingHypothesis testing can be used to test for significance relative to a fixed reference or avariable comparator, with RAG ratings being set as red or green if the observed indicatorvalue falls in the upper or lower critical region, and amber if no significant difference is found.However in the case of the fixed reference confidence interval and SPC methods aregenerally equivalent to hypothesis tests, and are often simpler to implement and so are notdescribed here. Instead the focus here is on comparisons with a variable comparator.Appendix 1 provides more information about hypothesis tests for different indicator O Tech Briefing 3 Common PH Stats and CIs.pdfOccasionally five rating bands are defined in terms of whether the indicator is less than the reference μ–3σ,between μ–3σ and μ–2σ, between μ–2σ and μ 2σ, between μ 2σ and μ 3σ, or greater than μ 3σ.7https://fingertips.phe.org.uk/documents/APHO Tech Briefing 2 SPC Methods.pdf6Page 6
Additional criteriaIn the introduction, we state that RAG ratings “should be based on statistical comparisonswith a comparator; indicator values should only be given red or green RAG ratings if they arestatistically significantly higher or lower than the comparator.” While this is true (that is, red orgreen flags should not normally be used unless the differences are statistically significant),there are times when additional criteria might be applied.Values of indicators based on common events in large populations can be highly statisticallysignificant even when the absolute differences from the comparator are very small. Forexample, comparing total admission rates for whole Clinical Commissioning Groups or localauthorities, where a rate may appear almost on the centre line of a spine chart, but issignificantly higher or lower. In fact, sometimes the values for almost all areas beingcompared are significantly different from the comparator. This is not incorrect – it is astatement that they are not varying randomly: they vary as a result of systematic influences,for example, socioeconomic conditions or other determinants.However, it may be desirable only to focus on a subset of those significant values, forexample, to focus attention on the largest differences. Setting such criteria is essentiallysubjective, unless there is scientific justification for ignoring smaller differences: in clinicaltrials, the clinician has to set a level of difference which is ‘clinically significant,’ that is, theminimum difference that would matter for patient outcomes or decisions on treatment. It ishard to see the equivalent in measuring population health outcomes, but it would be alongthe lines of ‘even if 1% excess deaths is statistically significant, no-one will change policy asa result of such a small change.’ Whether this is justifiable is dubious. However, having spinecharts with red and green dots hovering around the centre line, or having a RAG chart withalmost identical values coloured red and green respectively, may be considered confusing.One possible use of such additional criteria is when targets are involved: for example, if thecomparator is a target range, say, ‘the local area should be within /–5% of the nationalaverage’ – even if the local area is significantly worse than the national average, if it is withinthe target range it may be inappropriate to flag it as red.If, for any reason, a minimum threshold difference is set, for example, only differences thatdiffer from the reference value by more than 5% and are statistically significantly different areflagged red or green, then this criterion should be stated clearly and the reason for it shouldbe documented.Page 7
ChecklistIn defining RAG ratings there are a number of considerations. These include:1. The ‘polarity’ of the indicator: is higher or lower better?2. What type of comparator is being used?3. What is the indicator type?4. Are all assumptions and definitions clearly stated?5. Are all definitions and parameters appropriately documented?6. Is the method used appropriate? (For example, is a distributional assumptionor an assumption of independence valid.)Page 8
APPENDIX 1 – Technical detailsNormal variatesWhen comparing indicators that are assumed to be independent and normally distributedwith values 𝑋1 and 𝑋2 and standard deviations 𝜎1 and 𝜎2 respectively it is possible to use theWald test. The Wald statistic𝑋1 𝑋2 𝜎12 𝜎22is compared with the standard normal distribution.Thereby it is possible to determine whether any difference in the indicator value isstatistically significant at the α significance level.For example, if 𝑋1 10.0 and 𝑋2 10.5 and 𝜎1 0.1 and 𝜎2 0.2 then the Wald statistic iscalculated as –2.24 which is significant at the α 0.05 level. However if confidence intervalsare calculated, the confidence interval for 𝑋1 is (9.80, 10.20) and the confidence intervalfor 𝑋2 is (10.11, 10.89). That is, the confidence intervals overlap. This illustrates the dangerof using confidence intervals to assess difference with a variable comparator.A refinement of the Wald test is possible where 𝑋1 is the mean of 𝑁1 normally distributedobservations and 𝑋2 is the mean of 𝑁2 normally distributed observations. In this case theWald statistic corresponds to a Welsh t-test statistic, and rather than being compared to thestandard normal distribution it should, more accurately, be compared with the t-distribution(𝜎12 𝜎22 )2𝜎241 (𝑁1 1) (𝑁2 1)with 𝜎4degrees of freedom. (Note that 𝜎1 and 𝜎2 are the standard deviations(or standard errors) of 𝑋1 and 𝑋2 and not the standard deviations of the underlyingobservations.) When 𝑁1 and 𝑁2 are large the t-distribution is well approximated by thestandard normal distribution.Alternative non-parametric methods such as the Mann-Whitney U test and the KolmogorovSmirnov test are available where distributions cannot reasonably be assumed to be normal.Such methods are not described in detail within this guidance document.Counts and ratesHypothesis tests for counts and rates are also possible. More general techniques, such asPoisson regression, can be applied to compare two groups and it is also possible to use aLikelihood Ratio Test (LRT) which makes parametric assumptions. Alternatively, nonparametric methods can be used, as described above.Page 9
ProportionsProportions can be compared between two (or more) groups using logistic regression. It isalso possible to compare proportions between two groups by tabulating results into a 2x2table in terms of outcome by group. Such a table can then be analysed using a chi-squaretest for homogeneity with Yates’ continuity correction. Alternatively, where there counts arerelatively low, an exact test may be possible.Power and type I errorIndicator values are random variables. That is, an indicator reflects ‘common cause’, orrandom variation, as well as ‘special cause’, or systematic variation. The power of a test, orRAG rating, reflects the likelihood that an indicator will be red or green given that there issome special cause variation. This depends on many things, including the test being used,the size of the special cause effect, the number of observations underlying the indicator andthe variability of these underlying observations. Ideally power will be high, and indicators willbe correctly classified as red or green in such cases, rather than being flagged as amber.However, if there is no special cause variation, and the only difference between an indicatorand its comparator is random, there is still a risk of the indicator being misclassified as red orgreen. This is known as a type I error, or a ‘false positive’.With 95% confidence there is a 5% risk that each such indicator is misclassified; that is, onein twenty red or green ratings could be expected even where all the underlying distributionsare essentially amber.This problem of type I errors is particularly important to consider when a number of RAGratings are being produced, for example on a ‘tartan rug.’ Such a scenario is often referred toas ‘multiple testing’. Methods, such as Bonferroni correction, are possible which effectivelyshrink the size of critical regions representing red and green ratings. The effect of this isunfortunately also to reduce power. Alternatively, it is important that users of RAG ratingsunderstand the risk of type I errors and the danger of over-interpreting relatively smallnumbers of red or green indicators.Page 10
APPENDIX 2 – Colouring conventionsThere are two particular issues to bear in mind when choosing colours for RAG ratings:1. accessibility guidelines for colour blindness: the choice of red, amber andgreen should be checked using a tool such as Vischeck.82. monochrome printing: again, the choice of colours should be checked toensure they are distinguishable when printed in black and white.The example colours here are used in Fingertips. The red is clearly distinguishable from theothers for those with colour blindness and for black and white printing (as long as a key isprovided) as it is much darker than the amber or the green, but the amber and green areharder to differentiate.ColourRGB – screen coloursNearest PantoneRedR 192, G 0, B 0485 2XAmberR 255, G 192, B 0116 2XGreenR 146, G 208, B 80367DisplayPHE Technical GuidesThis document forms part of a suite of PHE technical guides that are available on theFingertips website: p://www.vischeck.com/vischeck/Page 11
2. A reference population indicator value (for example, England life expectancy at birth) 3. A reference sample comparator (for example, comparison of mortality rates for a geography with a baseline time period, or comparison of areas with peers) A key characteristic of these different comparator types is whether the comparator value is