Transcription
Supplementary AppendixThis appendix has been provided by the authors to give readers additional information about their work.Supplement to: Patel RM, Kandefer S, Walsh MC, et al. Causes and timing of death in extremely premature infants from 2000 through 2011. N Engl J Med 2015;372:331-40. DOI: 10.1056/NEJMoa1403489
SUPPLEMENTARY APPENDIXTable of ContentsInvestigatorsPages 2 - 4MethodsPage 5 - 6Figure S1. Kaplan-Meier estimates of survival from birth to 120 postnataldays from 2000 to 2011Page 7Figure S2. Kaplan-Meier estimates for specific causes of death by birthyear cohort from 2000 to 2011Pages 8 - 11Table S1. Definitions of the coded causes of deathPages 12 - 13Table S2. Additional characteristics of the cohort: extremely preterm livebirths and deaths over timePage 14Table S3. Subgroup analysis of continuous and non-continuous NeonatalResearch Network participating centers from 2000 to 2011Page 15Table S4. Sensitivity to potential misclassification of cause-specific mortalitydue to immaturity, RDS and BPDPage 16Table S5. Characteristics of extremely preterm deaths coded as “Other”Page 17Table S6. Proportionate causes of death among extremely preterm infantsfrom 2000 to 2011Page 18Table S7. Characteristics of immaturity-related deaths by birth yearcohort and gestational agePage 19Table S8. Relative changes in overall and cause-specific mortality from2000 to 2011Page 20Supplement to:Ravi M. Patel, MD MSc; Sarah Kandefer, BS; Michele C. Walsh, MD MS; Edward F. Bell, MD;Waldemar A. Carlo, MD; Abbot R. Laptook, MD; Pablo J. Sánchez, MD; Seetha Shankaran,MD; Krisa P. Van Meurs, MD; M. Bethany Ball, BS CCRC; Ellen C. Hale, RN BS CCRC; NancyS. Newman, RN; Abhik Das, PhD; Rosemary D. Higgins, MD; Barbara J. Stoll, MD for theEunice Kennedy Shriver National Institute of Child Health and Human Development NeonatalResearch Network. Causes and Timing of Death in Extremely Premature Infants from 2000 to2011. New England Journal of Medicine.1
InvestigatorsData collected at participating sites of the NICHD Neonatal Research Network (NRN) weretransmitted to RTI International, the data coordinating center (DCC) for the network, whichstored, managed and analyzed the data for this study. On behalf of the NRN, Dr. Abhik Das(DCC Principal Investigator) and Ms. Sarah Kandefer (DCC Statistician) had full access to allthe data in the study and take responsibility for the integrity of the data and accuracy of the dataanalysis and reporting. Marie G. Gantz, PhD, provided input and expertise for supplementarydata analysis.In addition to the authors, the following investigators and sites participated in this study: NRNSteering Committee Chairs - Alan H. Jobe, MD PhD from the University of Cincinnati (20032006); Michael S. Caplan, MD from the University of Chicago, Pritzker School of Medicine(2006-2011); Alpert Medical School of Brown University and Women & Infants Hospital ofRhode Island (U10 HD27904) – William Oh, MD; Angelita M. Hensman, RN BSN; Kristin Basso,RN MaT; Case Western Reserve University, Rainbow Babies & Children's Hospital (U10HD21364, M01 RR80) – Avroy A. Fanaroff, MD; Children's Mercy Hospital (U10 HD68284) –William E. Truog, MD; Cheri Gauldin, RN BSN CCRC; Cincinnati Children's Hospital MedicalCenter, University Hospital, and Good Samaritan Hospital (U10 HD27853, M01 RR8084) – KurtSchibler, MD; Edward F. Donovan, MD; Barbara Alexander, RN; Kate Bridges, MD; CathyGrisby, BSN CCRC; Marcia Worley Mersmann, RN; Holly L. Mincey, RN BSN; Jody Hessling,RN; Lenora Jackson; Kristin Kirker; Estelle E. Fischer, MHSA MBA; Greg Muthig, BS; DukeUniversity School of Medicine, University Hospital, Alamance Regional Medical Center, andDurham Regional Hospital (U10 HD40492, M01 RR30) – Ronald N. Goldberg, MD; C. MichaelCotten, MD MHS; Kathy J. Auten, MSHS; Kimberley A. Fisher, PhD FNP-BC IBCLC; Melody B.Lohmeyer, RN MSN; Sandra Grimes, RN BSN; Katherine A. Foy, RN; Emory University,Children’s Healthcare of Atlanta, Grady Memorial Hospital, and Emory University HospitalMidtown (U10 HD27851, M01 RR39) – David P. Carlton, MD; Eunice Kennedy Shriver NationalInstitute of Child Health and Human Development – Linda L. Wright, MD; Elizabeth M. McClure,MEd; Stephanie Wilson Archer, MA; Indiana University, University Hospital, Methodist Hospital,Riley Hospital for Children, and Wishard Health Services (U10 HD27856, M01 RR750) – BrendaB. Poindexter, MD MS; James A. Lemons, MD; Dianne E. Herron, RN; Lucy C. Miller, RN BSNCCRC; Leslie Dawn Wilson, BSN CCRC; Nationwide Children’s Hospital and the Ohio StateUniversity Medical Center (U10 HD68278) – Leif D. Nelin, MD; Sudarshan R. Jadcherla, MD;Christine A. Fortney, PhD RN; Nehal A. Parikh, MD. Bronte Clifford, Amanda Daubenmire,Karen Leonhart, Melanie Stein, Erin Wishloff; RTI International (U10 HD36790) – Marie G.Gantz, PhD; W. Kenneth Poole, PhD; Dennis Wallace, PhD; Jeanette O’Donnell Auman, BS;Margaret Crawford, BS CCRP; Betty K. Hastings; Carolyn M. Petrie Huitema, MS CCRP; KristinM. Zaterka-Baxter, RN BSN CCRP; Stanford University, California Pacific Medical Center,Dominican Hospital, El Camino Hospital, and Lucile Packard Children's Hospital (U10 HD27880,M01 RR70) – David K. Stevenson, MD; Marian M. Adams, MD; Charles E. Ahlfors, MD; AndrewW. Palmquist, RN; Melinda S. Proud, RCP; Robert D. Stebbins, MD; Tufts Medical Center,Floating Hospital for Children (U10 HD53119, M01 RR54) – Ivan D. Frantz III, MD; Brenda L.MacKinnon, RNC; Ellen Nylen, RN BSN; Anne Furey, MPH; University of Alabama atBirmingham Health System and Children’s Hospital of Alabama (U10 HD34216, M01 RR32) –2
Namasivayam Ambalavanan, MD; Monica V. Collins, RN BSN MaEd; Shirley S. Cosby, RNBSN; University of California - Los Angeles, Mattel Children's Hospital, Santa Monica Hospital,Los Robles Hospital and Medical Center, and Olive View Medical Center (U10 HD68270) –Uday Devaskar, MD; Meena Garg, MD; Teresa Chanlaw, MPH; Rachel Geller, RN BSN;University of California – San Diego Medical Center and Sharp Mary Birch Hospital for Womenand Newborns (U10 HD40461) – Neil N. Finer, MD; Maynard R. Rasmussen MD; Paul R.Wozniak, MD; Kathy Arnell, RNC; Renee Bridge, RN; Clarence Demetrio, RN; Wade Rich,BSHS RRT; University of Iowa and Mercy Medical Center (U10 HD53109, M01 RR59) – KarenJ. Johnson, RN BSN; Donia B. Campbell, RNC-NIC; John A. Widness, MD; Dan L. Ellsbury,MD; Tarah T. Colaizy, MD MPH; University of Miami, Holtz Children's Hospital (U10 HD21397,M01 RR16587) – Charles R. Bauer, MD; Shahnaz Duara, MD; Ruth Everett-Thomas, RN MSN;Amy Mur Worth, RN MS; University of New Mexico Health Sciences Center (U10 HD27881,U10 HD53089, M01 RR997) – Kristi L. Watterberg, MD; Lu-Ann Papile, MD; Robin K. Ohls, MD;Conra Backstrom Lacy, RN; Rebecca A. Montman, BSN RNC; University of Pennsylvania,Hospital of the University of Pennsylvania, Pennsylvania Hospital, and Children's Hospital ofPhiladelphia (U10 HD68244) – Barbara Schmidt, MD MSc; Haresh Kirpalani, MB MSc; Sara B.DeMauro, MD MSCE; Aasma S. Chaudhary, BS RRT; Soraya Abbasi, MD; Toni Mancini, RNBSN CCRC; Dara Cucinotta; University of Rochester Medical Center, Golisano Children'sHospital, and the University of Buffalo Women's and Children's Hospital of Buffalo (U10HD68263, U10 HD40521, M01 RR44, UL1 TR42) – Carl T. D’Angio, MD; Dale L. Phelps, MD;Ronnie Guillet, MD PhD; Satyan Lakshminrusimha, MD; Linda J. Reubens, RN CCRC, EricaBurnell, RN; Mary Rowan, RN; Cassandra A. Horihan, MS; Holly I.M. Wadkins; Ann MarieReynolds, MD; Karen Wynn; University of Tennessee Health Science Center (U10 HD21415) –Sheldon B. Korones, MD; Tina Hudson, RN BSN; University of Texas Southwestern MedicalCenter at Dallas, Parkland Health & Hospital System and Children's Medical Center Dallas (U10HD40689, M01 RR633) – Charles R. Rosenfeld, MD; Walid A. Salhab, MD; Luc P. Brion, MD;P. Jeannette Burchfield, RN BSN; Alicia Guzman; Gaynelle Hensley, RN; Melissa H. Leps, RN;Susie Madison, RN; Nancy A. Miller, RN; Diana M. Vasil, RNC-NIC; Lizette E. Torres, RN; LijunChen, PhD RN; University of Texas Health Science Center at Houston Medical School,Children's Memorial Hermann Hospital, and Lyndon Baines Johnson General Hospital/HarrisCounty Hospital District (U10 HD21373) – Jon E. Tyson, MD MPH; Kathleen A. Kennedy, MDMPH; Esther G. Akpa, RN BSN; Patricia Ann Orekoya, RN BSN; Beverly Foley Harris, RN BSN;Claudia I. Franco, RNC MSN; Anna E. Lis, RN BSN; Sara Martin, RN BSN; Georgia E.McDavid, RN; Patti L. Pierce Tate, RCP; Maegan C. Simmons, RN; University of Utah MedicalCenter, Intermountain Medical Center, LDS Hospital, and Primary Children's Medical Center(U10 HD53124, M01 RR64) – Roger G. Faix, MD; Bradley A. Yoder, MD; Karie Bird, RN; JillBurnett, RNC BSN; Jennifer J. Jensen, RN BSN; Karen A. Osborne, RN BSN CCRC; CynthiaSpencer, RNC BSN; Kimberlee Weaver-Lewis, RN MS; Wake Forest University Baptist MedicalCenter, Brenner Children's Hospital, and Forsyth Medical Center (U10 HD40498, M01 RR7122)– T. Michael O’Shea, MD MPH; Nancy J. Peters, RN CCRP; Wayne State University, HutzelWomen’s Hospital, and Children’s Hospital of Michigan (U10 HD21385) – Rebecca Bara, RNBSN; Mary E. Johnson, RN BSN, Kara Sawaya, RN BSN; Yale University, Yale-New HavenChildren’s Hospital, and Bridgeport Hospital (U10 HD27871, UL1 RR24139, M01 RR125, M013
RR6022) – Richard A. Ehrenkranz, MD; Harris Jacobs, MD; Patricia Cervone, RN; PatriciaGettner, RN; Monica Konstantino, RN BSN; JoAnn Poulsen, RN; Janet Taft, RN BSN.4
Supplementary MethodsStatistical methods for subgroup analysesIn order to account for potential differences in mortality estimates and changes in mortality overtime due to the addition and attrition of some centers over the period of the study, we performedtwo post-hoc subgroup analysis. These two analyses evaluated for heterogeneity in thechanges in overall and immaturity-related mortality over the three periods of the study from2000 to 2011 among infants born at centers that were and were not continuous participants ofthe Neonatal Research Network (NRN) over the 12 year period. The results of both of thesesugroup analyses are reported in Supplementary Table S3. For both of these analyses, wecompared the effect of birth cohort period in the 11 of 25 centers that were continuousparticipants of the NRN from 2000 to 2011 to the 14 of 25 centers that were non-continuousparticipants of the NRN using interaction terms in our logistic regression models. Heterogenity inthe risk of mortality over time was assessed by specifying an interaction between the parameterfor center type (continuous or non-continous) and the parameter for birth cohort period.Heterogenity was determined to be present if the P value was 0.05 for the interaction termbetween the three birth cohort periods and center type based on Type 3 tests of effects in thelogistic regression analysis. The regression model included adjustment for the followingvariables: gestational age, birth weight, gender, race, multiple gestation, small for gestationalage and individual center. Individual center was included to control for the individual centereffects. As the main effect of individual center included any effect of the two center types, anadditional main effect for center type was not added. We performed no formal adjustment formultiple comparisons, to be consistent with our overall statistical approach for the primaryanalysis. As two subgroup analyses were performed and reported, the probability of our findinga significant difference that was due to chance alone was approximately 10% (based on anoverall alpha of 0.05).5
Methods for sensitivity analysesWe performed sensitivity analyses to evaluate for changes in mortality estimates afteraccounting for potential misclassification of deaths due to immaturity, respiratory distresssyndrome (RDS) and Bronchopulmonary dysplasia (BPD). The results of these analyses arereported in Supplementary Table S4. For cause-specific deaths due to immaturity, weevaluated the impact on cause-specific mortality estimates after limiting the analysis to onlyimmaturity-related deaths 24 weeks gestation. For cause-specific deaths due to RDS andBPD, we evaluated the impact of misclassification of these deaths by limiting the analysis tocause-specific deaths that occurred within the postnatal age criteria that were defined inSupplementary Table S1. We also combined both RDS- and BPD-related deaths into a causespecific mortality due to pulmonary causes, to reflect the clinical continuum between these twodisorders.Two coding approaches were used to evaluate the sensitivity of cause-specific mortalityestimates to misclassification. For approach 1, we coded all cause-specific deaths not meetinglisted criterion as missing (removed from both the numerator and denominator of estimates). Forapproach 2, we coded all cause-specific deaths not meeting listed criterion as not having thecause-specific event (removed from only the numerator of estimates). We reported estimatesfrom both of these approaches, as approach 1 could potentially overestimate cause-specificmortality while approach 2 could potentially underestimate cause-specific mortality.6
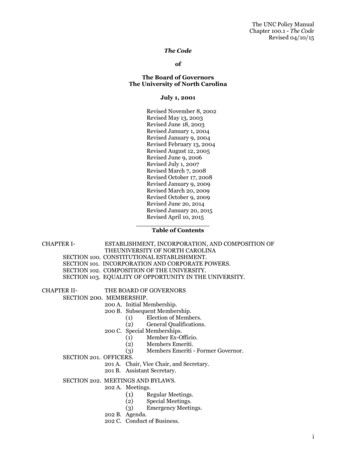
Figure S1. Kaplan-Meier estimates of survival from birth to 120 postnatal days from 2000 to2011.Legend: Wilcoxon P value of 0.02 for comparison of survival by birth year cohort.# survivorsBirth 53427
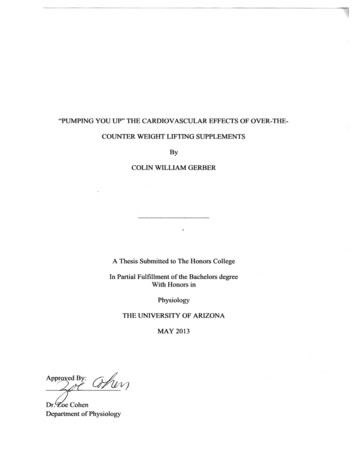
Figure S2. Kaplan-Meier estimates for specific causes of death by birth year cohort from 2000to 2011.Legend: Wilcoxon P values for comparison of survival by birth year cohort are shown.Infants with competing causes of death censored at the time of death.8
Figure S2 (continued). Kaplan-Meier estimates for specific causes of death by birth yearcohort from 2000 to 2011.Legend: Wilcoxon P values for comparison of survival by birth year cohort are shown.Infants with competing causes of death censored at the time of death.9
Figure S2 (continued). Kaplan-Meier estimates for specific causes of death by birth yearcohort from 2000 to 2011.Legend: Wilcoxon P values for comparison of survival by birth year cohort are shown.Infants with competing causes of death censored at the time of death.10
Figure S2 (continued). Kaplan-Meier estimates for specific causes of death by birth yearcohort from 2000 to 2011.Legend: Wilcoxon P values for comparison of survival by birth year cohort are shown.Infants with competing causes of death censored at the time of death.11
Table S1. Definitions of the coded causes of deathA. Primary causesof deathSubcausesCongenitalanomaly Congenital malformation - Congenital malformations that areincompatible with life, or incompatible with life without drasticsurgical or other measures to maintain life such as achromosomal defect, inborn error of metabolism, neural tubedefect, congenital heart disease, or renal abnormality. If an infanthad respiratory distress syndrome or intracranial hemorrhage butwas allowed to die because his/her main problem was thecongenital malformation, then congenital malformation was codedas the cause of death.Respiratorydistress syndrome(RDS) RDS - Severe respiratory insufficiency in the presence of RDSduring the first 28 days of life (i.e., increasing oxygen andventilatory pressure requirements, pneumothorax,pneumopericardium) RDS with severe intracranial hemorrhage - Infants with severerespiratory insufficiency in the presence of RDS during the first 28days of life with severe (grade III-IV) intracranial hemorrhage. RDS with infection - Infants with severe respiratory distress inthe presence of RDS during the first 28 days who have afulminant pulmonary or other infection. If an infant had sepsis (e.g.group B streptococcal sepsis) with a clinical presentation ofrespiratory distress, or respiratory distress syndrome with anintercurrent infection, then RDS with infection was coded as thecause of death. RDS with massive pulmonary hemorrhage - Infants withrespiratory distress syndrome diagnosed during the first 28 daysof life and massive pulmonary hemorrhage.Bronchopulmonarydysplasia (BPD) BPD - Infants with chronic lung disease requiring oxygen forgreater than 28 days with progressive respiratory insufficiency,with or without cor pulmonale. BPD with infection - Infants with chronic lung disease requiringoxygen for more than 28 days with progressive respiratoryinsufficiency, who developed a severe intercurrent infection. BPD with severe CNS injury - Infants with chronic lung diseaserequiring oxygen for greater than 28 days with progressiverespiratory insufficiency and extubated prior to death because ofsevere brain atrophy, hydrocephalus, or related CNS injury.12
Infection Suspect sepsis/infection - infants with clinical presentation ofsepticemia or localized infection without positive cultures duringlife or on autopsy. Proven sepsis/infection - Septicemia or localized infection withpositive blood or organ cultures (e.g. septicemia, meningitis).Necrotizingenterocolitis (NEC) NEC - Proven NEC, stage IIA or higher by Bell’s criteria NEC with sepsis - Proven NEC (stage IIA or higher by Bell’scriteria) with positive blood or peritoneal fluid cultures Spontaneous perforation - Infants with acute gastrointestinalperforation diagnosed by x-ray without classic radiographicfindings of necrotizing enterocolitis or findings of necrotizingenterocolitis at surgery or autopsy, including pathologicspecimens Short Bowel Syndrome* - infants with small bowel resectioncharacterized by malabsorption, diarrhea and failure to thrive.Central nervoussystem (CNS)injury Severe intracranial hemorrhage - Severe intracranialhemorrhage (grade III-IV) with a clinical presentation of centralnervous system decompensation (e.g. seizures, apneas, etc.) inthe absence of severe respiratory distress syndrome requiringhigh ventilator settings. Severe intracranial hemorrhage with infection with cultureproven or suspected - infants with severe intracranialhemorrhage (grade III or IV) i.e., documented blood/echodensityin the ventricle with ventriculomegaly and/or blood/echodensity inthe parenchyma with infection, as defined aboveImmaturity Immaturity - Infants 24 weeks who die in the absence ofinfection, RDS, or massive intracranial bleed. Or infants offeredonly comfort care and/or those who died prior to a diagnosticevaluation.Other Other - Infants with other causes of death such as severeasphyxia with multi-system failure, severe metabolic disease, andsevere trauma. Cardiorespiratory arrest was not used as a causeof death.Unknown Unknown – The cause of death was investigated but could not beestablished.*Subcause of short bowel syndrome added on 4/1/2011. Prior to this, these infants were categorizedunder the subcause of NEC.13
Table S2. Additional characteristics of the cohort: extremely preterm live births and deaths over timePatient 3Live births*Maternal age in yr, mean SD‡,§Primigravid, n (%)Maternal diabetes, n (%)‡, 2004-20072008-2011Deaths†n 7440n 7684n 7124n 2043n 2193n 183927.0 6.627.1 6.627.4 6.426.5 6.726.8 6.627.1 6.42287 (30.8)2425 (31.6)2213 (31.1)629 (30.8)686 (31.3)557 (30.4)284 (3.8)356 (4.6)354 (5.0)68 (3.3)91 (4.2)84 (4.6)‡,¶1394 (18.8)1715 (22.3)1744 (24.5)277 (13.6)345 (15.8)364 (19.9)Antepartum hemorrhage, n (%)1376 (18.5)1492 (19.4)1331 (18.7)418 (20.5)482 (22.0)399 (21.8)Maternal hypertension, n (%)‡,¶Any prenatal care, n (%)Mother received prenatalglucocorticoids, n (%)‡, GA 22-23 weeks6931 (93.2)7190 (93.7)6780 (95.3)1879 (92.1)2015 (92.1)1737 (94.9)5882 (79.1)6071 (79.3)5942 (83.6)1252 (61.4)1314 (60.0)1193 (65.1)431 (42.4)392 (38.0)426 (44.7)302 (36.2)255 (30.5)257 (34.9)GA 24-25 weeks1832 (84.3)1960 (84.9)1883 (90.1)564 (77.5)670 (79.2)564 (86.6)GA 26-28 weeksMother received prenatalantibiotics, n (%)‡,§PROM 18hr, n (%)‡, 3619 (85.3)3719 (86.2)3633 (89.4)386 (80.8)389 (76.6)372 (83.6)5458 (73.4)5072 (66.3)4942 (69.9)1374 (67.4)1338 (61.3)1135 (62.8)1737 (25.3)1550 (22.1)1319 (20.7)406 (22.4)399 (20.4)304 (19.0)Intubated in DR, n (%)‡,§5198 (69.9)5048 (65.7)4657 (65.4)1372 (67.3)1416 (64.7)1157 (62.9)GA 22-23 weeks545 (53.4)527 (51.2)499 (52.0)380 (45.4)342 (41.0)283 (38.2)GA 24-25 weeks1862 (85.8)1936 (83.4)1793 (85.7)612 (84.4)714 (84.4)534 (82.2)2791 (65.8)2585 (59.7)2365 (58.1)380 (79.7)360 (70.9)340 (75.9)2104 (28.3)2593 (34.9)2502 (38.5)943 (46.2)1064 (55.1)857 (69.8)GA 22-23 weeks299 (29.3)326 (38.4)344 (62.4)202 (24.1)201 (30.7)180 (54.1)GA 24-25 weeks956 (44.0)1212 (53.4)1116 (57.1)451 (62.0)550 (68.9)402 (77.6)GA 26-28 weeks849 (20.0)1055 (24.5)1042 (26.1)290 (60.7)313 (65.3)275 (72.9)GA 26-28 weeksUnderwent HFV for 1d, n (%)‡,¶Abbreviations: SD, standard deviation; GA, gestational age; PROM, prolonged rupture of membranes; DR, delivery room; HFV, highfrequency ventilation.* Information for live births was missing as follows (n): 6 for maternal age, 12 for primigravid, 26 for any prenatal care, 50 for prenatalglucocorticoids, 94 for prenatal antibiotics, 2018 for PROM 18hr, 15 for intubation, 886 for need for HFV.† Information for deaths was missing as follows (n): 4 for maternal age, 10 for primigravid, 17 for any prenatal care, 12 for prenatalglucocorticoids, 45 for prenatal antibiotics, 709 for PROM 18hr, 10 for intubation, 872 for need for HFV.‡ P 0.001 from Mantel-Haenszel χ2 test (categorical variables) or Kruskal-Wallis test (continuous variables) for comparison of variablesamong three birth year periods for live births.§ P 0.01 for comparison of variables among three birth year periods for deaths. P 0.05 for comparison of variables among three birth year periods for deaths.¶ P 0.001 for comparison of variables among three birth year periods for deaths.14
Table S3. Subgroup analysis of continuous and non-continuous Neonatal Research Networkcenters from 2000 to 2011Descriptive characteristicsIntubated in delivery room, n (%)- continuous participating centers- non-continuous participating centersDeath within 12 hours of birth, n (%)- continuous participating centers- non-continuous participating centersComfort care in delivery room, n (%)†- continuous participating centers- non-continuous participating centersUnderwent surfactant therapy, n (%)- continuous participating centers- non-continuous participating centersUnderwent HFV for 1d, n (%)- continuous participating centers- non-continuous participating centers2000-20032004-20072008-2011P Value*3610 (67.7)1588 (75.7)3496 (63.4)1552 (71.6)3146 (62.6)1511 (72.1) 0.0010.01651 (12.2)184 (8.8)666 (12.1)177 (8.2)581 (11.6)188 (9.0)0.320.80431 (8.1)96 (4.6)464 (8.4)107 (4.9)401 (8.0)119 (5.7)0.870.103927 (73.6)1610 (77.6)4036 (73.2)1715 (79.1)3672 (73.1)1669 (79.8)0.560.081440 (27.0)664 (31.6)1619 (30.6)974 (45.9)1517 (33.0)985 (51.8) 0.001 0.0011543 / 5338500 / 21021702 / 5515491 / 21691385 / 5028454 / 2096Mortality outcomesIn-hospital deaths / inborn live births, n- continuous participating centers- non-continuous participating centersOverall mortality rate, deaths per 1000 live births (95% CI)‡- continuous participating centers289 (277-301)309 (297-321)275 (263-288)- non-continuous participating centers238 (220-257)226 (209-245)217 (199-235)0.19§Cause-specific mortality rate due to immaturity, deaths per 1000 live births (95% CI)‡- continuous participating centers - non-continuous participating centers 90 (82-97)92 (84-99)86 (78-93)77 (67-89)56 (46-65)71 (60-83) 0.01§Abbreviations: CI, confidence interval. HFV, high frequency ventilation.Continuous participating centers include data from 11 out of 25 centers that part of the Neonatal Research Networkfrom 2000 to 2011. Information was missing as follows (n): 8 for intubation and comfort care, 6 for surfactant therapy,and 646 for need for HFV. Non-continuous participating centers include data from 14 out of 25 centers that were noncontinuous participants in the Neonatal Research Network from 2000 to 2011. Information was missing as follows (n): 7for intubation and comfort care, 32 for surfactant therapy, and 240 for need for HFV.* Result from Mantel-Haenszel χ2 test for categorical comparisons among three birth year periods for live births.† Comfort care in delivery room defined as no endotracheal intubation and death within 12 hours of birth.‡ Estimates of mortality are provided with unadjusted confidence intervals using the exact (Clopper-Pearson) method.§ P value reported indicates results of test for statistical interaction between birth-year period and center-type(continuous vs. non-continuous participating centers), after adjustment for gestational age, birth weight, gender, race,multiple gestation, small for gestational age and individual center. Adjusted comparisons of cause-specific mortality due to immaturity were significantly different (P 0.05) between2000-2003 and 2008-2011 for continuous participating centers and significantly different between 2000-2003 and 20042007 for non-continuous participating centers (mortality was higher in the 2000-2003 period for both center types).15
Table S4. Sensitivity to potential misclassification of cause-specific mortality due to immaturity, RDSand BPDCause-specific mortality rate per 1000 livebirths (95% CI)*2000-20032004-20072008-2011All YearsPValue†86 (80-93)72 (67-79)71 (66-78)81 (75-88)73 (67-79)72 (66-78)81 (75-88)70 (64-76)69 (63-75)83 (79-87)72 (68-75)71 (68-74)0.040.250.2765 (60-71)63 (58-69)63 (58-70)69 (63-75)66 (61-72)66 (61-72)56 (51-62)55 (50-61)55 (50-61)64 (60-67)62 (59-65)62 (59-65)0.020.050.0518 (15-21)15 (13-18)15 (12-18)15 (13-18)14 (12-17)14 (12-17)12 (10-15)12 (9-14)12 (9-14)15 (13-17)14 (12-15)14 (12-15)0.090.610.6383 (77-90)84 (78-90)68 (63-74)79 (75-82)0.002Immaturity- all coded deaths- only deaths 24 weeks gestation (approach 1)‡- only deaths 24 weeks gestation (approach 2)§RDS- all coded deaths- only deaths 28 postnatal days (approach 1)‡- only deaths 28 postnatal days (approach 2)§BPD- all coded deaths- only deaths 28 postnatal days (approach 1)‡- only deaths 28 postnatal days (approach 2)§Pulmonary (RDS and BPD) Abbreviations: CI, confidence interval; RDS, respiratory distress syndrome; BPD, Bronchopulmonary dysplasia.* Estimates of mortality are provided with unadjusted confidence intervals using the exact (Clopper-Pearson) method.† Adjusted statistical comparisons of differences in mortality across the three periods were performed using the Wald χ2 test inlogistic regression and adjusted for center, gestational age, birth weight, gender, race, multiple gestation, and small forgestational age.‡ Approach 1 set all cause-specific deaths not meeting listed criterion as missing (removed from both the numerator anddenominator of estimates).§ Approach 2 set all cause-specific deaths not meeting listed criterion as not having the cause-specific event (removed fromonly the numerator of estimates). Includes all coded cause-specific deaths due to both RDS and BPD.16
Table S5. Characteristics of extremely preterm deaths coded as “Other”OtherNon-Other*P value†25.2 1.6723 208241 (41.8)159 (27.6)26.5 6.6456 (79.2)6 (4-7)24.8 1.6697 1941296 (42.6)856 (28.1)26.7 6.52404 (79.0)6 (4-7) 0.0010.0050.780.630.320.960.28OtherNon-Other*113 (94.2)215 (46.0)75 (13.0)147 (29.5)43 (8.6)293 (50.9)297 (91.1)1194 (49.4)692 (22.7)1039 (38.8)159 (6.0)1418 (46.8)139 (24.1)178 (30.9)130 (22.6)88 (15.3)41 (7.1)605 (19.9)917 (30.1)893 (29.3)459 (15.1)171 (5.6)Patient CharacteristicsGestational age, weeks (mean SD)Birthweight, grams (mean SD)Female, n (%)Multiple gestation, n (%)Maternal Age, y (mean SD)Prenatal glucocorticoids, n (%)5-min Apgar score, median (IQR)Description of comorbid conditionsComorbiditiesBPD (for infants surviving to 36wk PMA)SepsisNECSevere IVH (Grade 3 or 4)PVLPDANumber of comorbid conditions, n (%)01234 or moreAbbreviations: SD, standard deviation; IQR, interquartile range; BPD, Bronchopulmonary dysplasia;PMA, postmenstrual age; NEC, necrotizing enterocolitis; IVH, intraventricular hemorrhage; PVL,periventricular leukomalacia; PDA, patent ductus arteriosus.Only includes infants who survived beyond 12 hours of age. Information was missing as follows (n): 1 forbirth weight, 1 for sex, 1 for maternal age, 3 for antenatal steroids, 13 for 5 min Apgar score, 3176 forBPD (includes infants who died prior to BPD evaluation), 736 for sepsis, 2 for NEC, 447 for Severe IVH,448 for PVL, 13 for PDA.* Includes deaths caused by congenital anomalies, RDS, BPD, Infection, NEC, CNS injury andimmaturity.† Student's t-tests and Wilcoxon tests used to compare means and medians, respectively. Categoricalcomparisons performed using the χ2 test.17
Table S6. Proportionate causes of death among extremely preterm infants from 2000 to2011Cause of death2000-20032004-20072008-2011All Yearsn 2043n 2193n 1839n 6075Congenital anomalies116 (5.7)109 (5.0)92 (5.0)317 (5.2)RDS487 (23.8)529 (24.1)401 (21.8)1417 (23.3)BPD134 (6.6)116 (5.3)86 (4.7)336 (5.5)Infection161 (7.9)186 (8.5)136 (7.4)483 (8.0)NEC172 (8.4)223 (10.2)217 (11.8)612 (10.1)CNS injury49 (2.4)84 (3.8)73 (4.0)206 (3.4)Immaturity640 (31.3)626 (28.6)578 (31.4)1844 (30.4)Other276 (13.5)311 (14.2)243 (13.2)830 (13.7)Unknown8 (0.4)9 (0.4)13 (0.7)30 (0.5)Deaths 0-12 hr of life*n 837n 845n 771n 2453Congenital anomalies79 (9.4)74 (8.8)65 (8.4)218 (8.9)RDS95 (11.4)98 (11.6)75 (9.7)268 (10.9)Infection25 (3.0)20 (2.4)26 (3.4)71 (2.9)Immaturity548 (65.5)564 (66.8)524 (68.0)1636 (66.7)Other88 (10.5)88 (10.4)78 (10.1)254 (10.4)2 (0.2)1 (0.1)2 (0.3)5 (0.2)n 1206n 1347n 1067n 362037 (3.1)35 (2.6)27 (2.5)99 (2.7)RDS392 (32.5)431 (32.0)326 (30.6)1149 (31.7)BPD134 (11.1)116 (8.6)86 (8.1)336 (9.3)Infection136 (11.3)166 (12.3)110 (10.3)412 (11.4)NEC172 (14.3)223 (16.6)217 (20.3)612 (16.9)CNS injury49 (4.1)84 (6.2)72 (6.8)205 (5.7)Immaturity92 (7.6)62 (4.6)54 (5.1)208 (5.7)188 (15.6)223 (16.6)1
BSN; Mary E. Johnson, RN BSN, Kara Sawaya, RN BSN; Yale University, Yale-New Haven Children's Hospital, and Bridgeport Hospital (U10 HD27871, UL1 RR24139, M01 RR125, M01 4