Transcription
BIS BulletinNo 36E-commerce in the pandemic andbeyondViviana Alfonso, Codruta Boar, Jon Frost, Leonardo Gambacortaand Jing Liu12 January 2021
BIS Bulletins are written by staff members of the Bank for International Settlements, and from time to timeby other economists, and are published by the Bank. The papers are on subjects of topical interest and aretechnical in character. The views expressed in them are those of their authors and not necessarily the viewsof the BIS. The authors are grateful to Ilaria Mattei for excellent analysis and research assistance, to EmmaClaggett for editing and to Louisa Wagner for administrative support.The editor of the BIS Bulletin series is Hyun Song Shin.This publication is available on the BIS website (www.bis.org). Bank for International Settlements 2020. All rights reserved. Brief excerpts may be reproduced ortranslated provided the source is stated.ISSN: 2708-0420 (online)ISBN: 978-92-9197-450-3 (online)
Viviana AlfonsoCodruta BoarJon FrostLeonardo GambacortaJing bis.orgE-commerce in the pandemic and beyondKey takeaways E-commerce has ramped up during the pandemic around the world. The growth has differed acrosssectors and over different stages of the pandemic. Novel data sources can help to follow these trends. The growth of e-commerce has been higher in countries where there were more stringent containmentmeasures and where e-commerce was initially less developed. Some changes in consumers’ shopping habits and payment behaviour may be longer-lasting. This mayhave implications for structural change and the growth of the digital economy.The Covid-19 pandemic has accelerated the adoption of e-commerce. This Bulletin introduces novel datasources to assess these developments. It looks at conjunctural developments and how these may persistand lead to more structural changes after the pandemic has abated.Data sources to assess e-commerceWhen the Covid-19 pandemic hit, the shift from bricks-and-mortar to digital shopping had been underway for some time. Since 2017, e-commerce revenues have risen from an estimated 1.4 trillion to 2.4 trillion, or about 2.7% of global output (Graph 1, left-hand panel). Recent estimates are that 3.5 billionindividuals globally (about 47% of the population) use e-commerce platforms today. China is the largestmarket, followed by the United States, Japan, the United Kingdom and Germany. The pandemic hasaccelerated this shift. The restrictions on mobility imposed to fight the spread of the virus led to a surgein online demand for many goods and services. As individuals stayed home, the online share of retail salesin China, Germany, the UK and US rose by 4–7 percentage points in 2020 (centre panel). In China and theUS, the share has recently fallen again, but remains well above its pre-pandemic level. In Latin America,one of the regions with the lowest penetration of e-commerce, in just two months consumers on theMercado Libre platform made the number of purchases they usually did in a year. The days between onlinepurchases have declined for both frequent and less frequent customers (right-hand panel).A variety of data sources give insights on e-commerce. Some countries have official statistics on onlineretail sales (eg from the US Census Bureau and the National Bureau of Statistics of China). For a widerrange of countries, there are novel sources, such as estimates from private sector market survey sourceslike Statista, and surveys from IBM, GlobalWebIndex, Contentsquare and others. Finally, private sectorfirms collect relevant data on online sales and transactions such as card-not-present (CNP) payments. CNPtransactions are remote (online) payments and payments with a smartphone app where the card is notphysically presented. These are distinct from “contactless” payments, where the card is present but nosignature or PIN code entry is needed (BIS (2020); Auer et al (2020)).This Bulletin draws on the range of available data collected from these sources and in collaborationwith firms like Mercado Libre and two global card networks. Table A1 in the online appendix givesBIS Bulletin1
descriptive statistics of selected variables. The data can also shed light on differences in e-commercedevelopments across countries and sectors of economic activity.E-commerce has been rising, and has accelerated in the pandemicOnline orders in retail industry inselected countries1USD bnShare of e-commerce in overall retailsales has spiked2Graph 1Days between each purchase onMercado Libre in Latin America3mn% of total retail salesNumber of 002,900131004502,60095002,300171819Revenue (lhs):ChinaUnited StatesJapanUnited KingdomOther countries20Number ofusers (rhs):World0515161718ChinaUnited StatesJapanUnited KingdomGermany1920LoyalFrequent Occasionalcustomers customers customersPre Covid-19Covid-19The black vertical line in the centre panel indicates 11 March 2020 (World Health Organization declares the Covid-19 to be a pandemic).1Data as of August 2020. 2 Data as of November (US), October (CN) and September 2020 (DE, JP and UK).24 February 2019 to 23 February 2020. Covid-19: from 24 February 2020 to 19 April 2020.3Pre Covid-19: fromSources: JPMorgan, Cross Sector; Mercado Libre; National Bureau of Statistics of China; Statista, Digital Market Outlook; US Census Bureau.Due to its online nature, e-commerce can help statistical agencies to collect real-time data. Forinstance, in the US, response rates to CPI surveys were lower and the number of uncollected pricesincreased during March, April and May 2020. The Bureau of Labor Statistics had to rely on data from onlineprices for some categories such as food at home and full-service restaurants to construct consumer priceindices (Bureau of Labor Statistics (2020)). Information on online purchases is also useful because it canaccount for product variety and changing consumer expenditure shares that more precisely track actualdemand and inflation (Jaravell and O’Connell (2020)).E-commerce in the Covid-19 pandemicIn terms of e-commerce, the pandemic unfolded in three basic stages: (i) a precautionary stage; (ii) astockpiling stage; and (iii) a shelter at home stage. Proprietary data from Mercado Libre shed light onwhich products saw the highest demand in each stage (Graph 2, left-hand panel). Initially, as the Covid-19virus spread across Asia, Europe and the Americas, consumers made precautionary purchases of medicalsupplies, eg hand sanitiser, disinfectant and facemasks. In the second stage, after a pandemic was declared,consumers stockpiled household essentials such as personal care products and non-perishable foodstuffs.This is consistent with uncertainty about the length of government containment measures. Finally, in thethird stage, technological goods, exercise equipment and entertainment and education services were inhigh demand. This reflects the fact that more activities were being conducted at home, and teleworkingand home schooling became more prevalent. This stage was particularly important in the Americas. Whilein some countries in Asia and Europe lockdowns were often in place for a matter of weeks, in some partsof the US and Latin America, non-essential retailers were closed for months. In late 2020, in the light of asecond wave of infections, many countries tightened containment measures again.2BIS Bulletin
Different sectors of the economy were affected differently. Online orders in the retail industry roseworldwide, and the mix of goods demanded corresponded very much to the stage in the pandemic. Datafrom Contentsquare indicate that traffic to supermarket web pages grew up to 270% at the peak of thelockdown (Graph 2, centre panel). Retailers of technology and sports equipment also saw a significantincrease in the number of visits to their online stores. By contrast, visits to tourism pages fell by 80%.Online prices increased along with excess demandTop 20 most demanded products inLatin America in the three stages1Graph 2Web traffic by industry2Online retail prices increased in thepandemicyoy % changeIndex, 6-12 Jan 2020 100Index, W0 sks:818FacemasksHand santiserHealth productsDisposable glovesSafety masksSafety lensesThermometersVit & supplementsBeauty & personal careFacial careDiapersHair dyeSkin careHome care & laundryHeadsetsWall & ceiling lightsVideo gamesResistance bandsAudio & video cablesBoard games0Stage:1850Feb 20Apr 20Jun 20Sep 19 Dec 19 Mar 20 Jun 20ElectronicsComputersFurniture& beddingGroceriesTech retailSports equipmentTelecomTourismGroceriesHome & gardenMedical equipment& suppliesPrecautionaryStockpilingShelter at homeChange in sales from 24 February to 3 May 2020 versus same period in 2019.2Weekly data.Sources: Adobe Analytics; Contentsquare; Mercado Libre.Prices of many online products rose in the pandemic. Excess demand caused some products to goout of stock in the short term. Moreover, the cancellation of passenger flights significantly reducedtransport capacity for cross-border postal shipments and other small deliveries. As a result, manycustomers faced delays or cancellations of their orders (WTO (2020)).Supply chain factors, shortages and spikes in demand contributed to a sudden increase in online(including shipping) prices (Graph 2, right-hand panel). The reversal in the deflationary price trend isparticularly evident for computers, home products and medical equipment sold online. Grocery prices roseslightly, especially since April. While the macroeconomic effects were limited, the change in online productprices reflects the well documented ability of e-commerce retailers to quickly adjust their prices to onlinecompetition (Cavallo (2018)).E-commerce is driving greater use of remote payments. Around the globe, overall card transactionsfell during the pandemic as economic activity contracted. Again, some sectors were more heavily impactedthan others, in line with the economy-wide reallocation (Graph 3, left-hand panel). Yet among cardpayments, CNP transactions in particular have risen. Once again, selected sectors have seen a greaterincrease in the CNP transaction share (Graph 3, right-hand panel). There are indications that the shock toconsumer behaviour may become structural. In particular, while the share of CNP transactions has fallenfrom its pandemic-period peaks, it remains higher than its pre-pandemic level in a number of economies,notably emerging market economies (EMEs). While some sector-specific shocks are probably temporary(Chen et al (2020)), others may indicate a longer-term reallocation of economic activity (Carstens (2020)).BIS Bulletin3
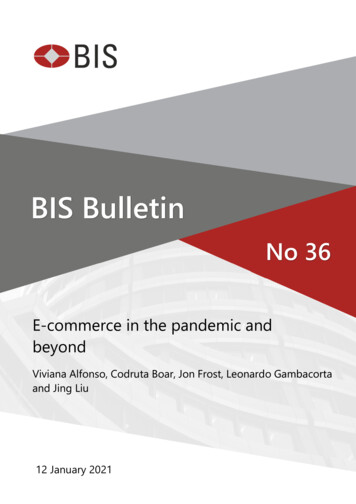
The pandemic has led to shifts in card payment behaviour1Evolution of transaction card values across sectors ofeconomic activity2Graph 3Card-not-present (CNP) transactions rose more in somesectors3Index, W1 Sep 2019 100% of total transaction value12575100607545503025150Sep 19Nov 19Jan 20Mar 2025th percentileMay 20Median0Sep 19Nov 19Jan 20Mar 20May 2075th percentileThe black vertical line indicates 11 March 2020, when the World Health Organization declared Covid-19 to be a pandemic.1Data for 18 countries and 34 sectors over September 2019–June 2020. 2 Total net transaction value (includes all transaction types) inUSD. 3 Share of CNP value measured in USD over the total net transaction value in USD.Source: a global card network.E-commerce platforms are also adapting their product offerings and services. For instance, some haveoffered new products and employed automated technologies such as robots and drones for last-miledelivery. Some have used new channels for commerce such as livestreaming on social media, andintroduced new services such as online education and telemedicine in their overall offerings (see onlineannex).E-commerce beyond the pandemicThe pandemic has intensified a “catching-up” process in e-commerce growth among countries. Prior tothe pandemic, there was a strong correlation between e-commerce revenues to GDP and the innovationcapacity of an economy (Graph 4, left-hand panel), as measured by the WIPO Global Innovation Index(WIPO (2020)). During the pandemic, e-commerce growth has been faster where containment measureswere stricter, as measured by the Oxford Covid-19 Government Response Tracker stringency index(Graph 4, centre panel).Interestingly, the growth has been higher where e-commerce was less developed. The lower the levelof e-commerce in a given country in 2019, the higher its growth rate during the Covid-19 pandemic. Thisimplies that countries with very low e-commerce volumes have been catching up (Graph 4, right-handpanel). This is broadly confirmed in regressions analysis, also controlling for the possible presence ofoutliers (see online appendix).Changes in consumer behaviour may be long-lasting. For large parts of the population, the closureof physical stores has forced consumers to question deep-seated shopping habits. In a sample of 18countries, a rising share of adults expects to shop online more frequently after the pandemic. Especially inEMEs, this share has increased since April (Graph 5, left-hand panel panel). Consumers expect both athome delivery and “buy online, pick up in-store” to rise (GlobalWebIndex (2020)).4BIS Bulletin
E-commerce development.y 5.49 0.421xwhere R2 0.2581.51.20.90.6353025200.3203040506070y 37.7 -10.3x2where R 0.22440E-commerce revenues(% of GDP, 2019)1.8 has grown more where ecommerce was less developed40353025201535Global innovation index145556575E-commerce revenues(% change, 2019–20)y 0.636 0.0148xwhere R2 0.209 has grown more in countries withstronger containment measuresE-commerce revenues(% change, 2019–20) was higher in more innovativecountries prior to the pandemicGraph 4150.5 0.8 1.0 1.3 1.5 1.8 2.0Stringency index2E-commerce revenues(% of GDP, 2019)The WIPO Global Innovation Index (GII) measures an economy’s innovation performance. The GII is an aggregate measure of the innovativeactivities of economies based on (i) knowledge and technology outputs and (ii) creative outputs. The score ranges between 0 and 100. Thehigher the score, the more innovative the country. 2 The Oxford Covid-19 Government Response Tracker stringency index is calculated asan average of the following component indicators: school closing, workplace closing, cancel public events, restrictions on gathering size, closepublic transport, stay at home requirements, restrictions on internal movement, restrictions on international travel, public informationcampaign. The index is the simple average of the number of measures adopted in each country over 1 January–18 October 2020.1Sources: WIPO; Oxford Covid-19 Government Response Tracker; Statista.Similarly, a survey by IBM (2020) of 3,450 executives in 20 countries finds that more than three quartersexpect more shopping and customer service interactions to take place online after Covid-19. E-commercemay thus continue to thrive. That would echo the experience during the 2003 SARS epidemic, when thenumber of e-commerce firms in Asia rose from very low levels (South China Morning Post (2020)). Trendsin e-commerce diffusion that would have otherwise taken several years to unfold materialised in a fewmonths. Younger users, in particular, report spending more time shopping online than before theCovid-19 and changes in consumer behaviourShare who expect to continue shopping online after theoutbreakGraph 5Especially younger cohorts report spending more timeshopping onlinePer cent% of respondents in the age group56504840403032202410016JP FR AU NZ DE ES IT US GB SG PH BR CN ZA INWave 3(22 Apr–27 Apr 2020):Advanced economiesEmerging marketeconomiesWave 5(29 Jun–2 Jul 2020):More timeshoppingonlineAge range:No changeshoppingonline16–2324–37Less ource: GlobalWebIndex.BIS Bulletin5
pandemic (Graph 5, right-hand panel). As these cohorts age, these habits may have a structurally importantimpact on aggregate retail behaviour in coming decades.ReferencesAuer, R, J Frost, T Lammer, T Rice and A Wadsworth (2020): “Inclusive payments for the post-pandemicworld”, SUERF Policy Notes, no 193.Bank for International Settlements (2020): “Central banks in the digital era”, Annual Economic Report 2020,June, Chapter III.Bureau of Labor Statistics (2020): “Effects of COVID-19 pandemic and response on the consumer priceindex”, accessed 15 December.Carstens, A (2020): “The Great Reallocation”, Project Syndicate, 12 October.Cavallo, A (2018): “More Amazon effects: online competition and pricing behaviors”, NBER Working Paper25138.Chen, S, D Igan, N Pierri and A Presbitero (2020): “Tracking the economic impact of COVID-19 andmitigation policies in Europe and the United States”, IMF Working Paper, no 20/125.GlobalWebIndex (2020): “GWI Coronavirus Research: Multi-market research wave 3”, 29 April.IBM (2020): “COVID-19 and the future of business”, September.Jaravell, X and M O’Connell (2020): “Inflation Spike and Falling Product Variety during the GreatLockdown”, CEPR Discussion Paper 14880.South China Morning Post (2020): “Will the coronavirus crisis, like Sars, give birth to the next big thing inChina tech?”, 7 March.World Intellectual Property Organization (WIPO) (2020): “Global innovation index 2020: Global InnovationIndex 2020: who will finance innovation?”, September.World Trade Organisation (WTO) (2020): “E-commerce, trade and the Covid-19 pandemic”, 4 May.6BIS Bulletin
Previous issues in this seriesNo 35The recession-mortality nexus and Covid-1915 December 2020Sebastian Doerr and Boris HofmannNo 34Central bank swap lines and cross-border14 December 2020 bank flowsIñaki Aldasoro, Christian Cabanilla,Piti Disyatat, Torsten Ehlers, PatrickMcGuire and Goetz von PeterNo 33What comes next? Recovery from an uneven02 December 2020 recessionDaniel ReesNo 32Monetary policy response in emerging12 November 2020 market economies: why was it different thistime?Ana Aguilar and Carlos CantúNo 3109 October 2020Bankruptcies, unemployment and reallocation Ryan Banerjee, Enisse Kharroubifrom Covid-19and Ulf LewrickNo 3009 October 2020The outlook for business bankruptciesRyan Banerjee, Giulio Cornelli andEgon ZakrajšekNo 2914 August 2020Bonds and syndicated loans during theCovid-19 crisis: decoupled again?Tirupam Goel and Jose MariaSerenaNo 2823 July 2020Inflation at risk from Covid-19Ryan Banerjee, Aaron Mehrotra andFabrizio ZampolliNo 2716 July 2020Global banks’ dollar funding needs andcentral bank swap linesIñaki Aldasoro, Torsten Ehlers,Patrick McGuire andGoetz von PeterNo 2601 July 2020Corporate credit markets after the initialpandemic shockSirio Aramonte and Fernando AvalosNo 2526 June 2020Investors’ risk attitudes in the pandemic andthe stock market: new evidence based oninternet searchesMarlene Amstad, Giulio Cornelli,Leonardo Gambacorta and Dora XiaNo 2419 June 2020Trade credit, trade finance, and the Covid-19CrisisFrédéric Boissay, Nikhil Patel andHyun Song ShinNo 2317 June 2020The fiscal response to the Covid-19 crisis inadvanced and emerging market economiesEnrique Alberola, Yavuz Arslan,Gong Cheng and Richhild MoessnerNo 2215 June 2020How are household finances holding upagainst the Covid-19 shock?Anna ZabaiNo 2106 June 2020Central banks’ response to Covid-19 inadvanced economiesPaolo Cavallino and Fiorella De FioreAll issues are available on our website www.bis.org.BIS Bulletin7
E-commerce beyond the pandemic The pandemic has intensified a “catching-up” process in e-commerce growth among countries. Prior to the pandemic, there was a strong correlation between e-commerce revenues to GDP and the innovation capacity of an economy (Graph 4, left-hand panel), as me