Transcription
Brief Introduction toEarned Value Management (EVM)12/25/0612/25/06EVM IntroductionEVM Introduction11
Outline Introduction to the basic rationale and elements of EVM Issues of actually implementing an EVM tracking scheme Background materials12/25/0612/25/06EVM IntroductionEVM Introduction22
The Problem A successful program manager says: “We completed the projectwe promised to deliver in the time we promised and with thebudget we asked for.” The standard source of information about the status of theproject is the status of the budget, which only tells you howquickly and how completely you are spending the money youhave. What you really want to track is how quickly and howcompletely you are accomplishing the work you promised to do.(under)Budget The coupling of money spent to work doneVarianceor schedule consumed is loose and nonlinear. Also, the expenditure track is a(behind)(ahead)Scheduleone-dimensional projection of aVariancetwo-dimensional problem.12/25/06EVM Introduction3(over)12/25/06EVM Introduction3
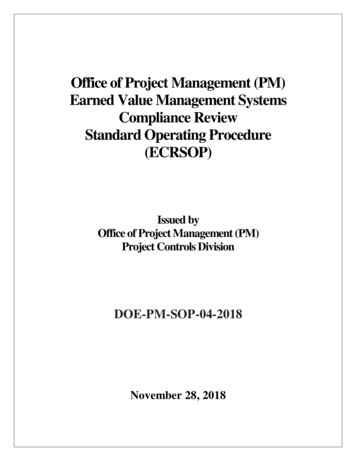
Why You Need to Know BothCost and Schedule Variances Project A is in good shape, under budget and ahead of schedule. Project B is over budget, but if we realize (under) BudgetVarianceit is ahead of schedule, we canslow the effort to save money.DA Project D’s cost variance looks(behind)better than A’s, but if we(ahead)Schedulerealize it is behind schedule,Variancewe can spend more to catch up. Project C looks just like B if weCBonly look at the cost variance, butwe can’t slow down to save money.(over)And it looks just like D if we only look atschedule, but we can’t spend more to catch up. It’s time to rescope!12/25/0612/25/06EVM IntroductionEVM Introduction44
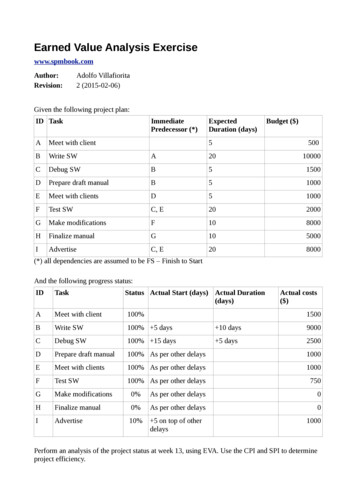
So What Do We Have to Work With?1. DEFINE THE WORK AND ORGANIZE TEAMSCONTRACT BUDGET BASEMANAGEMENT RESERVE (MR) 3. ALLOCATE BUDGETS10040Each chunk of workcorresponds to achunk of budget anda chunk of schedule.BASELINE2. SCHEDULE THE WORK601525TIME303012/25/0612/25/06EVM IntroductionEVM Introduction55
The Basic Idea For each chunk of work, define its ‘value’ as the budgetassigned to it. When you complete that chunk of work, you have ‘earned’ itsvalue. The total earned value to date gives you a point on the ( ,time)graph – the Budgeted Cost of Work Performed (BCWP). You could compare this to the actual amount of work that youwere supposed to have completed by this point in the schedule,as measured by its budgeted cost – the Budgeted Cost of WorkScheduled (BCWS), another point on the ( ,time) graph. You could also compare it to the actual amount spent tocomplete the chunks of work done to date – the Actual Cost ofWork Performed (ACWP), a third point on the ( ,time) graph. Look at what information these comparisons give about thestatus of the project.12/25/0612/25/06EVM IntroductionEVM Introduction66
Budgeted Cost of Work Scheduled(BCWS)Month 1BCWS 1,000Month 4BCWS 1,000Month 2BCWS 1,000Month 3BCWS 1,000Total Budget 5,000to be spent over 5 monthsWe plan to deploy 1 standeach month at an estimatedcost of 1,000.BCWS each month 1,000Month 5BCWS VM IntroductionEVM Introduction77
Budgeted Cost of Work Performed(BCWP)We’re at the end of thesecond month, but only1 stand is complete.Value of work performed seline.12/25/0612/25/06EVM IntroductionEVM Introduction88
BUDGET BASEDSchedule Variance(SV)BC WSBC WPOf the work we scheduled to have done,how much did we budget for it to cost?Of the work we actually performed,how much did we budget for it to lars)formula:formula:SVSV BCWPBCWP--BCWSBCWSexample:example:SVSV BCWPBCWP--BCWSBCWS 1,000 1,000-- 2,000 2,000SV SV - 1,000- 1,000 (negative(negative behindbehindschedule)schedule)12/25/0612/25/06EVM IntroductionEVM Introduction99
Schedule Variance(SV)5,000BCWS“the baseline”sv BCWP“earned value”TIME12/25/0612/25/06EVM IntroductionEVM Introduction5 months1010
Actual Cost of Work Performed(ACWP)Labor came to 1,300,and materials cost 1,100. That first standcost dgetbudget12/25/0612/25/06EVM IntroductionEVM Introduction1111
BC WPAC WPPERFORMANCE BASEDCost Variance(CV)Of the work we actually performed,how much did we budget for it to cost?Of the work we actually performed,how much did it actually andactualactualcostcostformula:formula:CVCV BCWPBCWP--ACWPACWPexample:example:CVCV BCWPBCWP--ACWPACWP 1,000 1,000-- 2,400 2,400CV CV - 1,400- 1,400 (negative(negative costcostoverrun)overrun)12/25/0612/25/06EVM IntroductionEVM Introduction1212
Cost Variance(CV)5,000ACWP“actual cost”cv BCWP“earned value”TIME12/25/0612/25/06EVM IntroductionEVM Introduction5 months1313
Note That We Can IsolateSchedule and Cost Variances5,000BCWSACWP cvsvBCWPTIMEschedule variance BCWP - BCWS negative numbercost variance BCWP - ACWP negative number12/25/0612/25/06EVM IntroductionEVM Introduction5 st1414
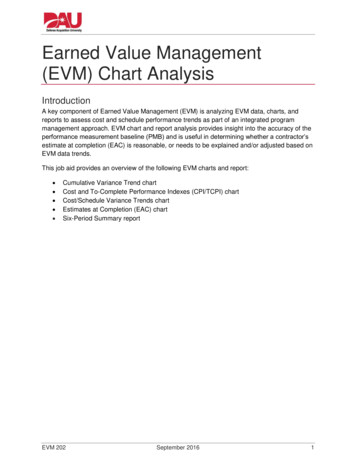
Where are the significant problems?By tracking and sorting on variances, wecan isolate the troublesome WBSWBSDESCRIPTIONProj Ofcr %Comp %Spentelements.sorted by CV ( .11Price85.04Troop35.40BrownPrice12/25/06CV % VAC VAC -187.20.844 -130.8 -18.49 -87.00.932 -45.2-7.26 -36.894.350.901 -26.4-10.95 0.037.080.955 -24.2-4.75 -24.845.7048.510.942 -17.4-6.16 -3.271.6275.230.952 -17.4-5.03 -30.8MANAGEMENT DATA Simmons84.1898.100.858 -13.2-16.54 -16.0SENSORSSmith20.8721.490.971 -10.6-2.94 -21.6Blair17.8718.900.945 -7.8-5.78 -6.2Hall60.8261.660.986 -5.6-1.38 -2.0Novak38.5152.800.729 -4.6-37.10 0.00.000.00 439.23600PCC23200COMMUNICATIONS3G&AGEN & ADMIN42200SYS ENGINEERING53800I&A62100PROJ MANAGEMENT72300FUNC INTEGRA852009310010 4000SPARES11 6200SYSTEM TEST12 5100ENG DATA13 MRMGT RESERVE14 UBUNDIST BUDGET0.00.015 COM COST OF MONEY12/25/06CV-296.2 -17.6210.0Troop41.1341.131.000 Smart100.0098.021.020 COMP PROGRAMSPino46.4644.661.04020 6300PCC TESTBond23.1322.641.02121 3400ADPEZepka41.8939.7922 3300AUX EQUIPTideman27.5724.3316 3700DATA DISPLAY17 OVOVERHEAD18 6100TEST FACILITIES19 35000.00.00.00 2.01.98 0.0 3.43.87 -1.4 4.22.10 0.01.053 12.65.02 4.61.133 78.211.73 8.40.00.0EVM IntroductionEVM Introduction0.00.01515
Performance Indices“GOOD”We can also get a sense of the overall performanceof the project by tracking performance indices.1.2COSTCOSTPERFPERFINDEXINDEX(CPI)(CPI) I)(SPI) 12/25/06EVM IntroductionEVM Introduction1616
Budget at Completion(BAC)The most important markers of the overallperformance of the project look atpredictions of the variances at the end.These require several quantities, the firstbeing the Budget at Completion.sum of all BCWS BAC 5,000 5,000 sed,thethecumulativecumulativeBCWSBCWS BACBACe.g.,e.g., 5,000 5,000 5,000 5,00012/25/0612/25/06EVM IntroductionEVM Introduction1717
What will be the final cost? Estimate at Completion (EAC)– defined as actual cost to date estimated cost of work remaining– usually develop comprehensive EAC at least annually reported by WBS in cost performance report– should examine on monthly basis– consider the following in EAC generation: performance to dateimpact of approved corrective action plansknown/anticipated downstream problemsbest estimate of the cost to complete remaining work– also called latest revised estimate (LRE), indicated final cost, etc.ACWP ETC EAC12/25/0612/25/06EVM IntroductionEVM Introduction1818
Getting the Estimate at CompletionJust a few little glitches .We should be able to dothe complete job .ack let’s see, for about 7,50012/25/0612/25/06EVM IntroductionEVM Introduction1919
Determining EAC via Statistics Common EAC Formulae:EAC BAC/CPI ACWPcum Budgeted Cost of Work RemainingCPI3 ACWPcum Budgeted Cost of Work Remaining.8(CPI) .2(SPI) ACWPcum Budgeted Cost of Work RemainingCPI * SPI12/25/0612/25/06EVM IntroductionEVM Introduction2020
Other methods of EAC calculation “Grass Roots” or formal EAC– detailed build-up from the lowest level detail– hours, rates, bill of material, etc. Average of statistical formulae Show range of EACs (optimistic, most probable,pessimistic) Complete schedule risk analysis for remaining work,estimate work remaining12/25/0612/25/06EVM IntroductionEVM Introduction2121
Variance at Completion(VAC)B ACwhat the total job is supposedto costE ACwhat the total job is expectedto ctedexpectedtotocost.cost.FORMULA:FORMULA:VACVAC BACBAC--EACEACExample:Example:VACVAC 5,000 5,000-- 7,500 7,500VACVAC -- 2,500 2,500 (negative(negative overrun)overrun)12/25/0612/25/06EVM IntroductionEVM Introduction2222
Variance at Completion(VAC)VAC Budget at Completion - Estimate at Completion BAC - EACEACVACBAC TIME12/25/0612/25/06EVM IntroductionEVM Introduction2323
VAC is Particularly Importantfor Government Contracts Variance at Completion vs. Contractor Loss– Positive VAC: EAC BACunderruncontractor gainshare areaoverruncontractor partial losscontractor loss (100%)– Negative VAC: EAC BAC EAC ceiling Government develops top level EAC for comparison– Government will limit progress payments if EAC is greater thanceiling– Government needs forecast of fund requirements May still have time to change the final outcome12/25/0612/25/06EVM IntroductionEVM Introduction2424
Probably the BiggestSelling Point for EVM A survey of over 800 military programs showed that no programever improved performance better than the following EACcalculation:EAC BAC/CPI,at the15%-complete point in the program. Thus, there is strong empirical evidence that EVM translates earlyinformation into essential guidance for program re-baselining.12/25/0612/25/06EVM IntroductionEVM Introduction2525
EVM AnalysesThere are a wide variety of indicators to play with in EVM.TermSymbolFormulaChecklist Actions% DoneBCWPBACRatio of work accomplished in terms of the total amount of work to do.CPI or PFBCWPACWPRatio of work accomplished against money spent (an efficiency rating: WorkDone for Resources Expended)To CompletePerformance Indexor Verification FactorTCPI or VFBAC - BCWPEAC - ACWPRatio of work remaining against money remaining (Efficiency which must beachieved to complete the remaining work with the expected remaining money)Schedule Performance IndexSPIBCWPBCWSSchedule CorrelationSC or S/CPCUMSVPercent CompleteCost Performance Indexor Performance Factor1)Independent EstimateAt CompletionIEACAverage PerformancePCUMAverage ExpectedPerformance To Finish12/25/0612/25/06P TO GORatio of work accomplished against what should have been done (EfficiencyRating: Work done as compared to what should have been done)Ratio of Schedule Variance (SV) in terms of average amount of workaccomplished (in weeks or months). It indicates a correlation to program trueschedule conditionBACPF2)BAC - BCWPACWP .8CPI .2SPICalculation of a projected Estimate At Completion to compare with the CAM'sEstimate At Completion:1) Ration of total work to be done against experienced cost efficiency2) Sunk costs added to a ratio of remaining work against weighted cost andschedule efficienciesBCWPcumDuration (wks or mos)Since ACWP BeganAverage rate at which work has been accomplished since work beganBCWPcumDuration (wks or mos)From Time Now toManager's StatedCompletion DateAverage rate at which work must be accomplished in the future to finish on thedate the CAM has forecasted for completion of the work.EVM IntroductionEVM Introduction2626
EVM AnalysesThere are a wide variety of analytic techniques to play with in EVM. Sort on significant variances– eliminate almost complete, just starting, etc. Graph and analyze trends Look at comparative data– e.g. cumulative performance vs. projected performance Examine written analysis by contractor– does it answer why?– adequacy of corrective action plans Analysis of schedule trends, critical path Analysis of EAC 6EVM IntroductionEVM Introduction2727
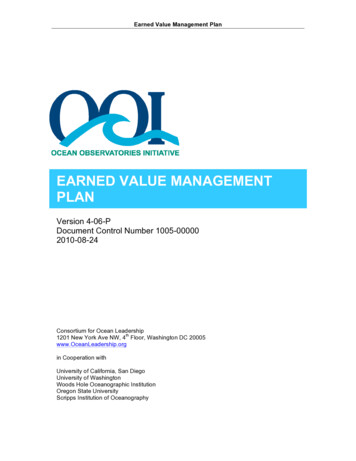
Graphical EVM AnalysesPercent of DollarsMEGA HERZ ELEC & VEN Cost/Schedule VarianceF04695-86-C-0050 MOH-2 RDPR FPI POP: 01 MAR 1992 - 15 SEP 199319921993MAY JUN JUL AUG SEP OCT NOV DEC JAN30.0Overall cost and schedule PACWPCVSV1.41.41.5-0.1-0.0Dollars In Millions2.22.54.25.62.22.73.85.32.23.04.25.60.0 -0.3 -0.5 -0.3-0.00.2 -0.4 -0.37.36.97.3-0.5-0.4PMB: 20.4% COMP: 32.9MR: 0.4KTR MR LRE: 0.0COST VARIANCECURRENT FUNDING: 10.0SCHEDULE VARIANCEPO EPC: 24.0PROJ FUNDING: 23.0EAC realismAt CompletionKTRPO20.820.820.820.820.823.00.0-2.2MEGA HERZ ELEC & VEN F04695-86-C-0050 RDPR FPIEstimates at CompletionElement: 3600PO MR LRE: 0.0AS OF: JAN 93OPR: MR B. TECHPROGRAM: Mohawk VehicleDollars In Millions0.30.61.00.20.50.90.20.50.90.0 -0.0 -0.0-0.1 -0.1 -0.1Cost Drivers, Cause8.0Name: 56.55.55.77
formula: CV BCWP - ACWP example: CV BCWP - ACWP 1,000 - 2,400 CV - 1,400 (negative cost overrun) COST VARIANCE is the difference between budgeted cost and actual cost formula: CV BCWP - ACWP example: CV BCWP - ACWP 1,000 - 2,400 CV - 1,400 (negative cost overrun) PERFORMANCE BASEDFile Size: 290KBPage Count: 43