Transcription
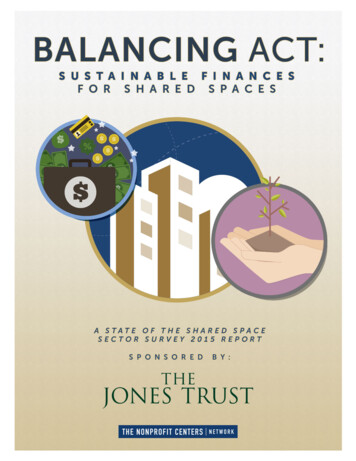
Balancing Act: Sustainable Finances for Shared Spaces
IntroductionDuring the 2015 State of the Shared Space Sector survey, NCN found that aFinancial Health of Shared Spaceslarge proportion of mission driven shared spaces are operating as successfulsocial enterprises. Over 70% of nonprofit centers were operating at a breakeven or profitable financial position. At the same time, The Nonprofit CentersBreak-EvenNetwork has heard from many of its members that traditional nonprofit funding21%streams, like major gifts or foundation grants, are difficult for them to attain. It isSurplusimportant to analyze the practices of the profitable centers to understand how to56%Deficithelp those centers that are running a deficit and to help new spaces avoid major23%pitfalls.For this research we sought to answer the following key questions: How does square footage influence a center’s profitability?Do differences in tenant mix and duration influence profitability?Are there any unexpected indicators of profitability?MethodologyFor the purpose of all of the reports generated by the 2015 State of the Shared Space Sector survey, the definition of “shared space” or“nonprofit center” is a physical facility that intentionally houses more than one nonprofit organization with a social purpose. The data forthis report was gathered in January 2015, when The Nonprofit Centers Network sent an electronic survey with 86 questions to 624 eitherknown or potential nonprofit centers. NCN maintains a database of intentionally created shared spaces that contained contact informationfor 393 nonprofit centers at the time of the study. 140 centers responded for a response rate of 22%. To bolster the completeness of thefinancial component of the survey, additional data was requested from all centers that reported their total square footage for their center.The data set was then run through a series of regression models to determine how much of the variation in profitability could be explainedthrough the variables that were collected.Profitability and Shared SpaceDuring the 2015 State of the Shared Space Sector Survey, 56% of respondents reported a financial surplus between 5,000 and 2Million. At the same time, almost a quarter of the sample is running a deficit of 15,000 or more. The remaining respondents reporteda surplus or a deficit within 5,000, so this group is considered “Break Even” for the purposes of this report.FundraisingIt is important to note that profitable centers are not simply better at fundraising than their counterparts. As many practitioners know,shared space is a challenging nonprofit mission to convince funders to support. Profitable groups have found ways to maximize theirearned revenue, as fewer profitable groups report that they have to fundraise for operating costs. In contrast, two-thirds of the centersrunning at a loss report fundraising for operations at least once a year.Gross Square Footage by Financial PositionSquare Footage80,00070,000One of the most striking areas of difference between profitable and unprofitable60,000shared spaces was in the size of the space.50,000At 67,000 square feet, the average profitable center was approximately 20,00040,000square feet larger than the average center running a loss. On average, breakeven centers are only slightly larger than those that are running a loss. Based 30,000on statistical modeling done with the data, each additional square foot of space 20,000is associated with a 3.05 increase in net revenues.10,000ProfitLossBreak Even1BalancingAct: SustainableFinancesforinSharedManaging Collaboration:Staffing& SalariesShared SpacesSpace
How your center is divided between rentable and common area also matters. Forthe purposes of this report, common area includes anything that is not rentable,60,000including but not limited to conference rooms, shared kitchens, hallways, rest50,000rooms, elevators, mechanical rooms, etc. Profitable centers have a greaterpercentage of rentable space (66%) than those that are running at a loss (55%).A 1% increase in the rentable share of space is related to a 6,035 increase in 40,000annual net revenues.Rentable Square Footage per 10,000 SquareFeet of Common Area30,000Profitable centers have 40,000 sq. ft. of rentable square feet for every 10,000 sq.20,000ft. of common area, where centers running a loss have 25,000 sq. ft. of rentablesquare feet per 10,000 sq. ft. of common area. There is not a direct correlation 10,000between size and profitability, as Break Even centers have 53,000 rentable sq. ft.per 10,000 sq. ft. of common area.ProfitLossBreak EvenThe total amount of rentable square footage is not the only factor that impacts profitability, because centers that are operating in breakeven position have the highest average percent of rentable square footage at 70%.Vacancy RatesNonprofit centers should be leasing their spaces to the fullest. Higher vacancy rates are associated with lower net revenues in thestatistical models. For example, a 1% increase in a center’s vacancy rate is correlated with a 25,466 reduction in net revenues.Profitable spaces had an average vacancy rate of 1%, within a range of 0 to 20%. Centers operating at a loss had an average vacancyrate of 5%, within a range of 0 to 40%.TenancyHaving a strong, stable tenant base seems to differentiate the profitable centers from their less successful counterparts. On average,a space running a surplus has 26 tenants. Spaces that are running in the red have, on average, 15 tenants. A larger tenant baseprovides more stability in terms of revenues streams, because each one is a smaller percentage of the whole rental revenue than ifthere were only a few tenants.Additionally, profitable centers have tenants that stay longer. The average length of tenancy at profitable centers is 5.8 years, whileunprofitable centers only see their tenants stay for an average of 3.9 years. Consequently, profitable centers have an average annualturnover rate of 4%. Centers operating at a loss have an average annual turnover rate of 7%Looking at tenant mix through the lens of the most common types of centers – theme centers, service centers, multi-sector centers,and incubators – there was little variation. Incubators are the least profitable subset of shared spaces, which can be attributed to theamount of costs that they are subsidizing for their tenant organizations. Theme, service, and multi-sector centers were very similar interms of profitability.Average Years of Tenancy by Financial PositionProfitLossBreak Even2123456Nonprofit Centers Network 2016TheTheNonprofitCenters Network 201678
Expenses per Square FootOne of the most striking findings was 100the difference in center spendingbetween centers. In order to account forthe range of sizes of centers, the totalexpenses required to run the building, 80inclusive of staff, were divided by thecenter’s square footage, both gross andrentable. Groups that run a profit have 60the lowest costs per square foot in boththe total and rentable areas, averagingapproximately 22 per rentable square 40foot. In groups running a loss, thecosts per gross square foot are almost2.5 times higher than their profitable 20counterparts. This issue is exacerbatedby the distribution of square footage. Ifcosts are evaluated on rentable squarefeet, the cost is almost 4.5 times that ofprofitable centers.Expenses Per Square FootPer Total Sq. Ft.Per Rentable Sq. Ft.ProfitLossBreak EvenAn important component of a center’s expense ratio is in how the center is staffed. Centers that operate at break-even employ thefewest management staff overall. The average number of management staff is about the same in both profit and loss scenarios, butthose centers running at a loss have more paid part-time help. A larger full-time management staff relative to center size decreases thelikelihood of generating a surplus. For example, a one-standard deviation change in full-time staff from 0.7 per 10,000 square feet to1.5 per 10,000 square feet is associated with a reduced predicted probability of a surplus by 19.4 percentage points.AgeOlder centers are more likely to be profitable. The average age for profitable centers is 15.7 years, while the average age for thoserunning a loss was 9.4 years. Forty-two percent of nonprofit centers running a loss have been open five years or less. A center that hasbeen open 10 years is around 7.7 percentage points more likely to have a surplus than a center open one year.Debt FinancingA common theory is that nonprofit centers will not be profitable if they use debt to finance their acquisition or renovation of thebuilding. The State of the Shared Space Sector data tells a different story. Forty percent of profitable centers used debt as a part oftheir financing plan. Only 25% of centers running a loss used debt. Debt financing requires more fiscal rigor, and the borrower isaccountable to a lender. These factors may help set spaces up for success in the future.Maintenance ReserveWhile it is unclear if having a maintenance reserve leads to profitability or vice versa, the data is clear that a majority (77%) of profitablegroups have a building maintenance reserve. Only 40% of groups that are running a loss have a maintenance reserve.OwnershipWhile there was an even distribution of centers in each category that were owned and leased, deeper statistical analysis indicateda significant difference. Owning a facility is correlated with a 23.6 percentage point reduction in the likelihood of having a surplus.Although we did not specifically touch on this in the survey, there are many reasons why owning a space might not provide the financialstability that an organization expects. The building may be in a need of an extensive amount of renovation and have inefficient buildingsystems. The square footage of the space owned may be greater than necessary. Additionally, if nonprofits are unable to secureproperty tax exemption for their buildings, this can be a significant expense.3BalancingAct: SustainableFinancesforinSharedManaging Collaboration:Staffing& SalariesShared SpacesSpace
LocationMore centers in urban areas are profitable when compared to their suburban counterparts. Fifty percent of centers in urban areasare profitable, compared to 33% of centers in suburban areas. Only two nonprofit centers reported that they were in rural areas, sono conclusions can be drawn there. Groups in suburban areas were fairly evenly distributed with 33% running a profit, 29% breakingeven, and 33% running a loss.NCN did not ask questions about the desirability of the location within a city or a suburb (i.e., in a downtown core, proximity to transit orother amenities, etc.), although it is likely that these factors would contribute to high occupancy rates.Optimizing your Business ModelThe findings in this report can be used by centers at all stages of development to strengthen their social enterprise business model.Centers in the planning stages can use these findings as benchmarks in designing their space, adjusting as local demand dictates.Centers under operation can use these facts to refine their business model and improve their ratio of revenues to expenses. For aquick analysis, practitioners should consider the following: What is your ratio of common space to rentable space? If you have flexibility with your space layout, consider transforming somecommon area into rentable cubicles or offices.Reduce your vacancy rate. If you do not have a deed restriction, search for small businesses or missioned-aligned for-profits.Expand the number of tenants your space can serve. If you have the available space, consider adding a hot desking or part-timemembership model to your community.Analyze your expenses on a per square foot basis. Although every space will be different, aim for a cost per rentable square footas close to 22 as possible. Make sure that you are using part-time or contract staff efficiently.ConclusionThis report marks the first time that the profitability of the nonprofit shared space model has been reported and analyzed, and thefindings validate many common practices across for-profit and nonprofit shared spaces. While there is room for much additionalresearch in this arena, this work shows the importance of the size of a center, proportion of rentable square feet to common area,vacancy rates, and number of tenants. At the same time, this research confirms that successful nonprofit centers are largely notdependent on fundraising. Additionally, it dispels the myth that taking on debt financing ensures that a nonprofit center will continuallyrun at a loss. This report does not contain the ultimate recipe for profitability; shared spaces find many ways to make their businessmodels work. It does, however, demonstrate clear indicators for financial strength in this model.4Nonprofit CentersCenters Network 2016TheTheNonprofitNetwork 2016
even or profitable financial position. At the same time, The Nonprofit Centers . An important component of a center's expense ratio is in how the center is staffed. Centers that operate at break-even employ the . Centers in the planning stages can use these findings as benchmarks in designing their space, adjusting as local demand .